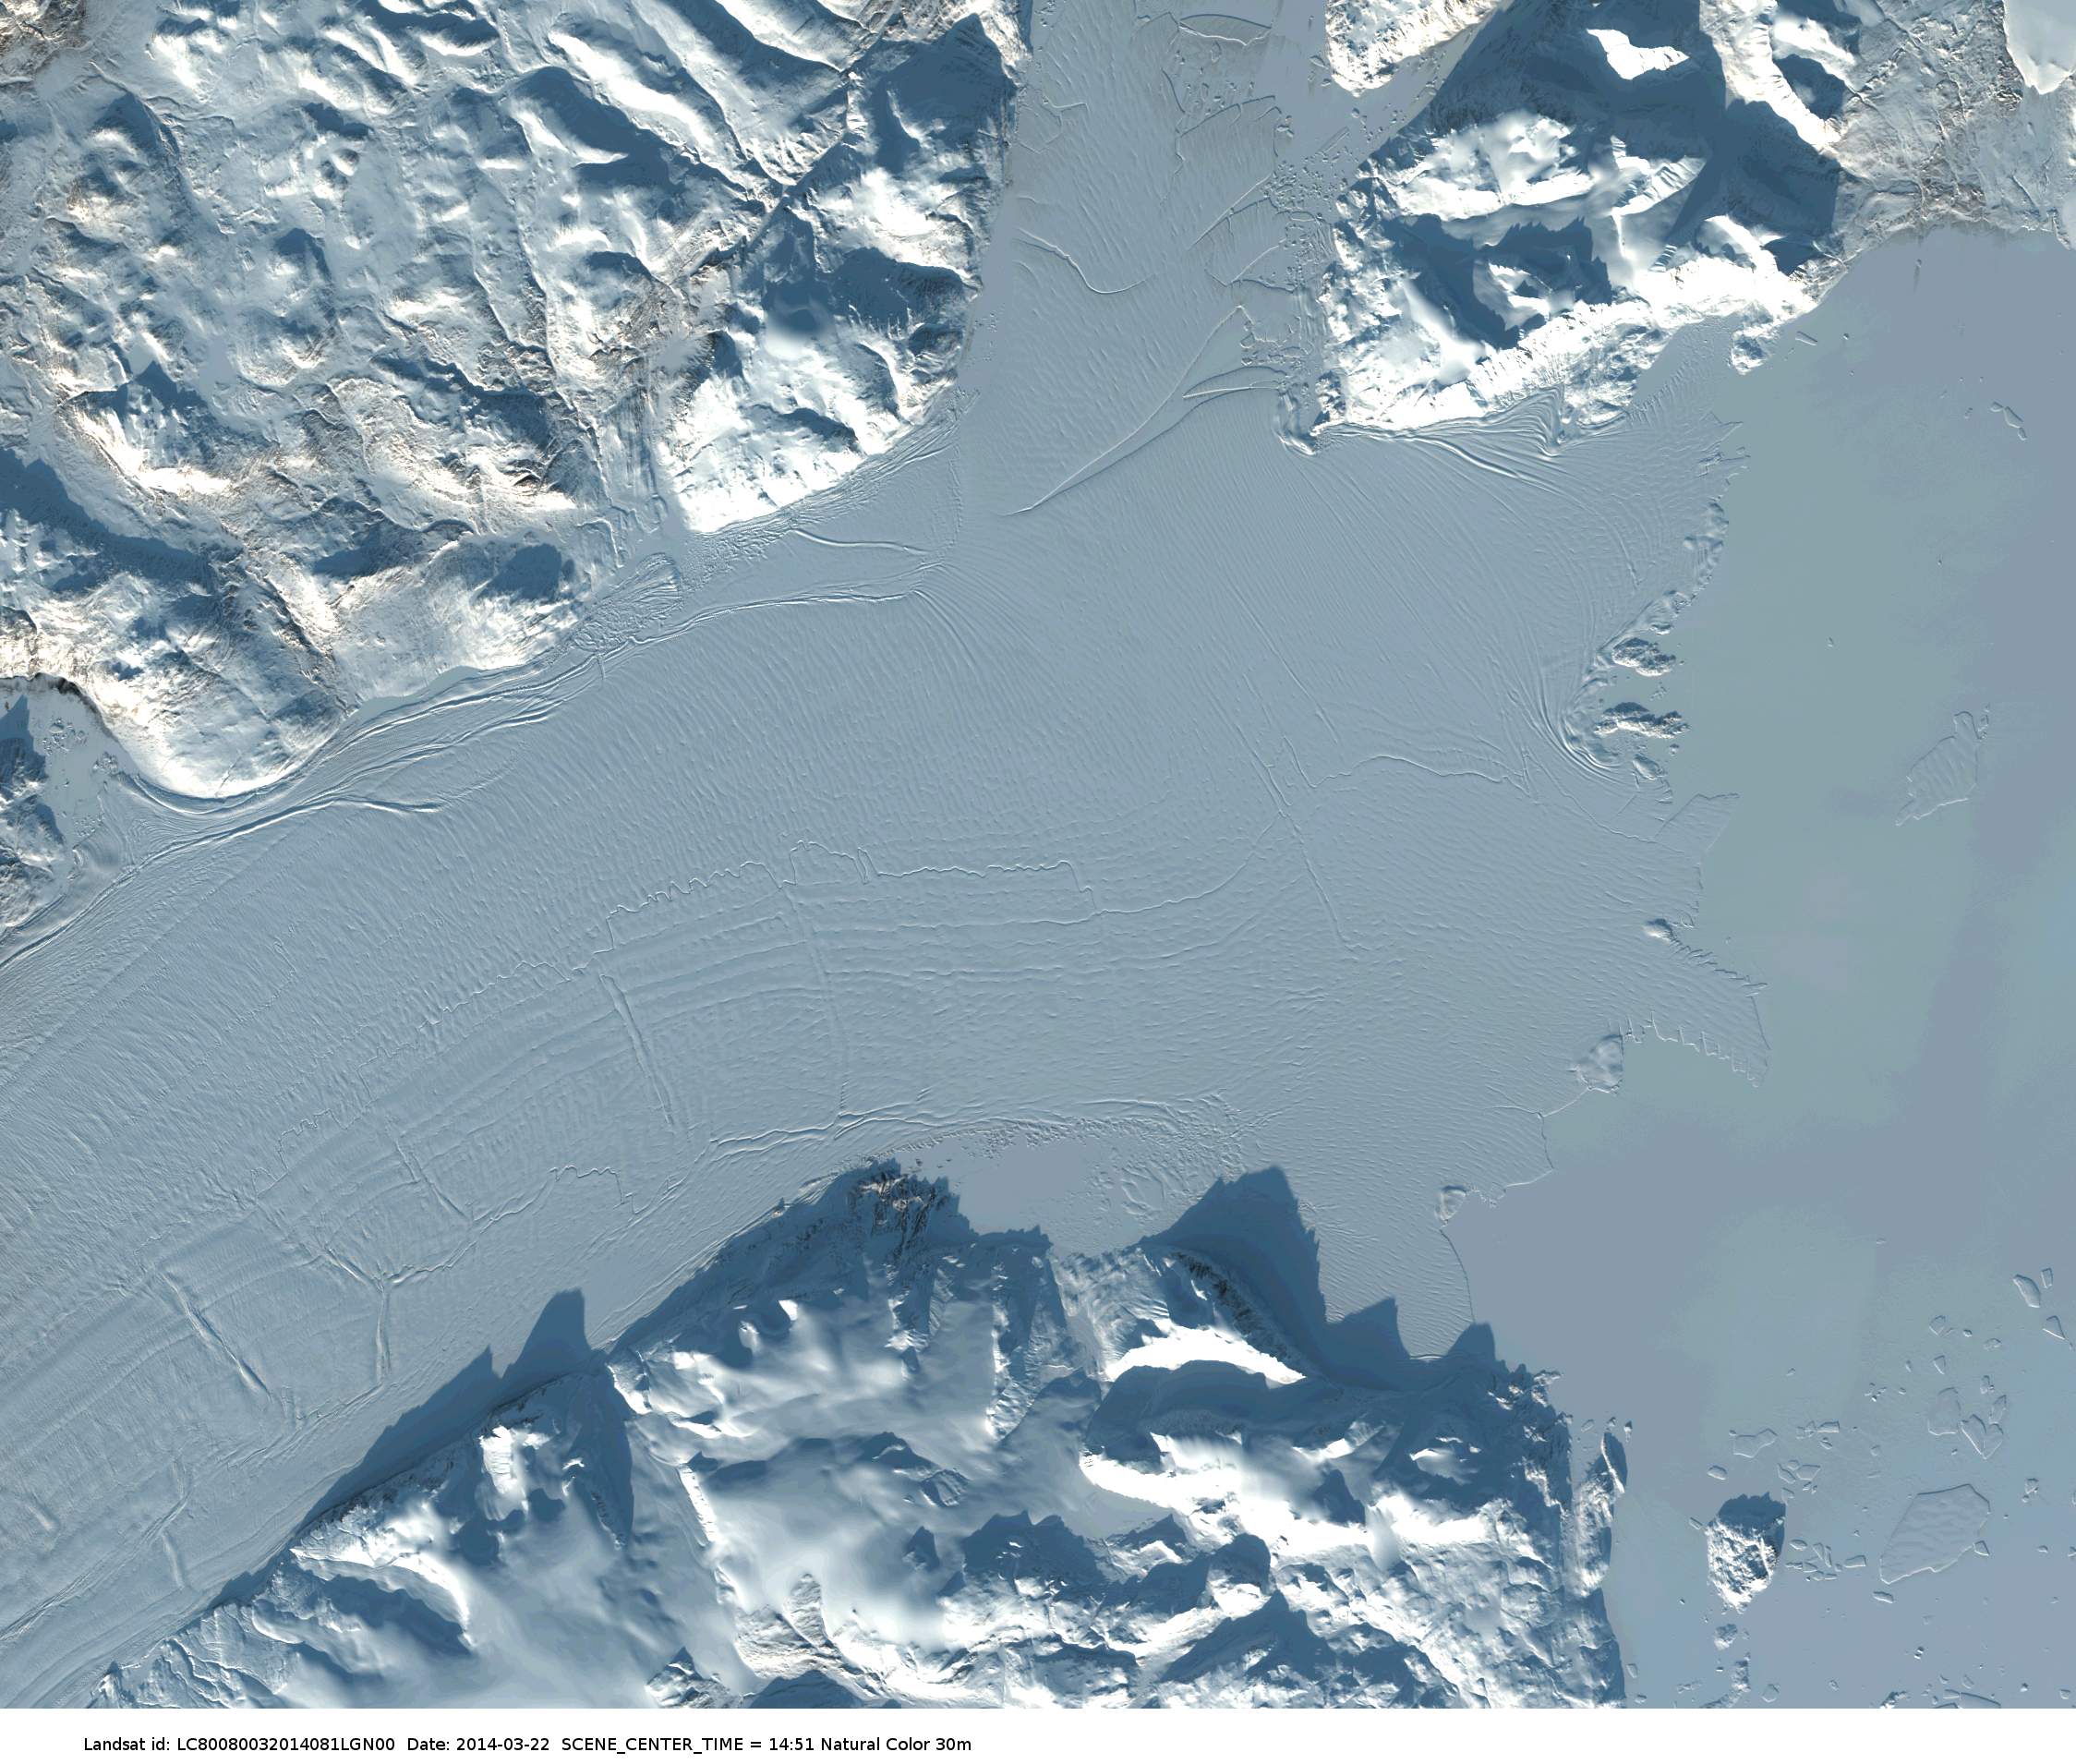
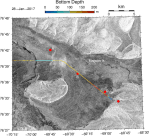
Greenland hunters, seals, and polar bears all need sea ice atop a frozen ocean to eat, breath, or live. The sea ice around northern Greenland changes rapidly by becoming thinner, more mobile, and less predictable as a result of warming ocean and air temperatures. I will need to be on the sea ice to the north and west of Thule Air Base in March and April about 6 weeks from to conduct several connected science experiments. The ice should be “land fast,” that is, it should be a solid, not moving plate of ice. The work is funded by the National Science Foundation who asked me to prepare a sea ice safety plan to keep the risk to people working with me to a minimum. In a science plan I included this satellite image of what the ice and land looked like in march of 2016:

Optical satellite image of Wolstenholme Fjord, Greenland on March-21, 2016 with Thule Air Base in bottom right. Darker areas show thin ice.
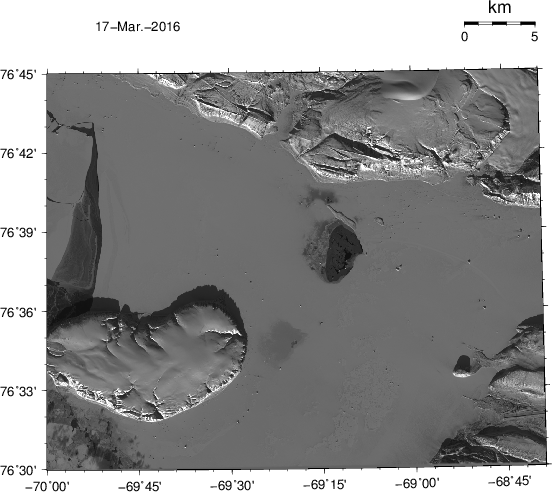
This LandSat image captures the reflection of sun light during a cloud-free day at ~15 m pixel size. No such imagery exists for 2017 yet, because the sun does not set until late February with this US satellite overhead. The European Space Agency (ESA), however, flies a radar on its Sentinel satellite. This radar sends out its own radio waves that are then reflected back to its antenna. The radar sees not only during the polar night, it can also see through clouds. And ESA provides these data almost instantaneous to anyone who wants it and knows how to deal with large data files. If you think your 8 mega pixels are sharp, these images are closer to 800 mega pixels. Here are three such images from January 3, 24, and 28 (yesterday):
-
- Wolstenholme Fjord, Greenland Jan.-03, 2017 from Sentinel-1 radar.
-
- Wolstenholme Fjord, Greenland Jan.-24, 2017 from Sentinel-1 radar.
-
- Wolstenholme Fjord, Greenland Jan.-28, 2017 from Sentinel-1 radar.
The lighter white tones indicate that lots of radar signals return to the satellite. The many tiny white specks to the south of the Manson Islands are grounded icebergs. The different shades of gray indicate different types of ice and snow. The Jan.-24 and Jan.-28 images show a clear boundary near longitude of -70 degrees to the north of the island (Saunders Island) that separates land-fast ice to the east from thinner and mobile ice in Baffin Bay to the west.
-
- Wolstenholme Fjord on Aug.-27, 2016. The view to the west with Mount Dundas on the left (south) and southern part of Saunders Island on the right (north).
-
- Wolstenholme Fjord on Aug.-27, 2016. The view to the west with the northern part of Saunders Island on the left (south) and smaller Manson Islands on the right (north) next to then northern shore of the fjord.
-
- Wolstenholme Fjord on Aug.-27, 2016. The view to the south-west with Manson Islands in the foreground and Saunders Island in the background
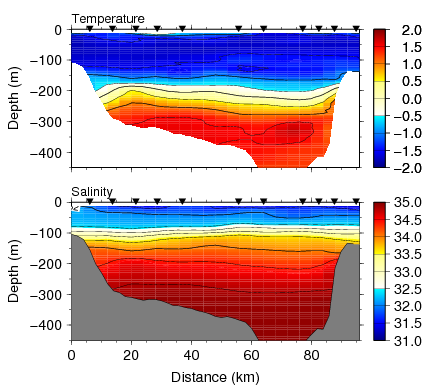
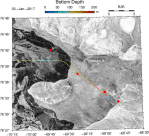
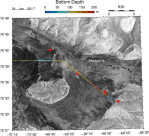
I plan to work from Thule Air Base (red dot bottom right) out along points C, B, towards A. The color of line near these points is a section where I have very accurate bottom depth from a 2003 US Coast Guard Icebreaker that was dropping off scientists at Thule on August 15, 2003. I was then one of the scientist dropped off after a 3 week excursion into Nares Strait and Petermann Fjord. Along this section I hope to test and deploy and under-water acoustic network that can send data via whispers from C to A via B. First, however, we will need to know how sound moves along this track and before that, for my ice safety plan, I will need to know how thick or thin the ice is. The imagery does not tell me ice thickness.

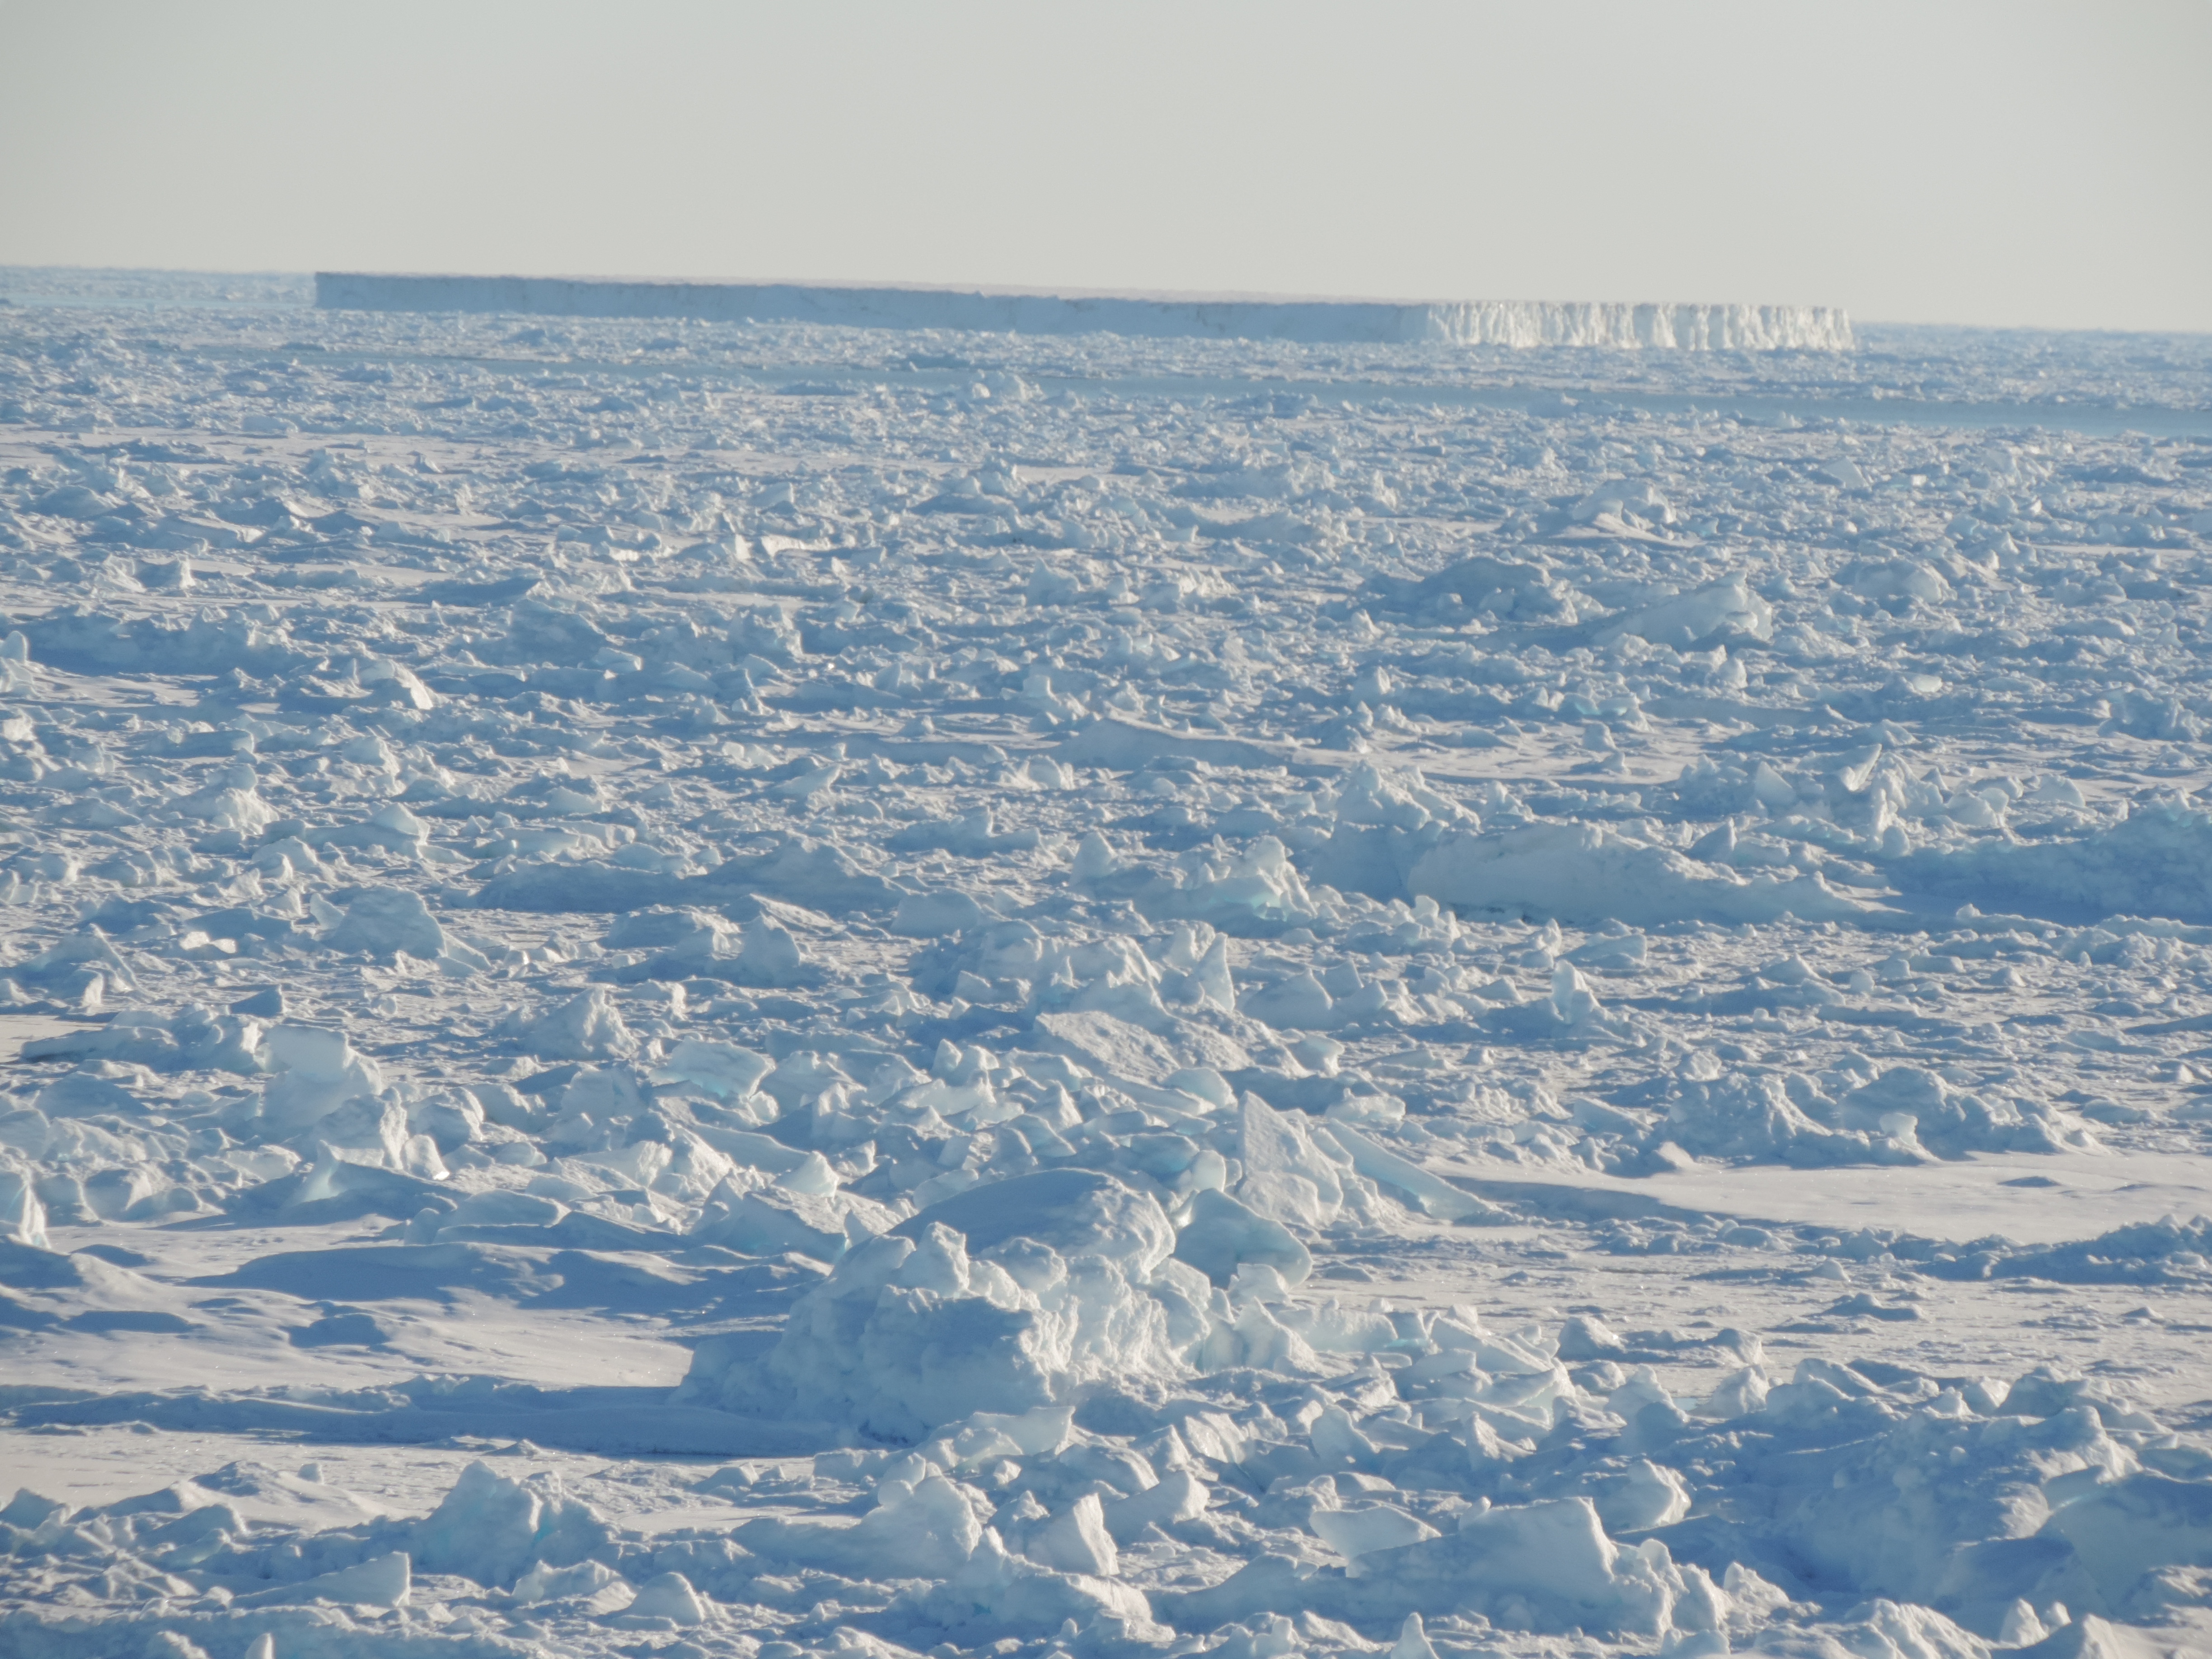
Flying to Thule Greenland with US Air force Air Mobility Command delivering cargo and people.
Arriving in Thule on Mar.-8, we will first need to measure ice thickness along this A-B-C section with a sharp ice-cutting Kovacs drill and a tape measure. The US National Snow and Ice Data Center (NSIDC) distributes a “Handbook for community-based sea ice monitoring” that we will follow closely. This first ice survey will also give us a feel and visual on how the radar satellite imagery displays a range of ice and snow surfaces. One of my PhD students, Pat Ryan, will process and send us the ESA Sentinel-1 radar data while a small University of Delaware and Woods Hole Oceanographic Institution group will work on the ice in early April.
The mental preparation for this scientific travel to Thule and the sea ice beyond gives me the freedom and pleasure to explore new data such as Sentinel-1 imagery and perspectives on tremendous local traditional knowledge of the Inugguit who have lived with the sea ice for perhaps 4000 years. The town of Qaanaaq is 45 minutes by helicopter to the north of Thule Air Base (TAB) at Pituffik. The town was established in 1953 when local populations living in the TAB area were forcibly removed. Despite these challenges the displaced people have prospered throughout the Cold War, but a less predictable and rapidly changing sea ice poses a severe threat to the community whose culture, health, and livelihood still depends on hunting and traveling on sea ice. Stephen Leonard is an anthropological linguist at the University of Cambridge who lived in Qaanaaq for a year in 2010/11 when he made this video:
P.S.: If possible, I would very much like to work with a local person who knows sea ice and wild life that we would need protection from. Danish contacts are reaching out on my behalf to people they know in Siorapaluk, Qaanaaq, and Savissivik.
![Dr. Helen Johnson in August 2009 on the pier of Thule AFB with CCGS Henry Larsen and Dundas Mountain in the background. [Credit: Andreas Muenchow]](https://icyseas.org/wp-content/uploads/2013/06/img_0006.jpg)
![Thule AFB with its airport, pier, and ice-covered ocean in the summer. The island is Saunders Island. The ship is most likely the CCGS Henry Larsen in 2007. [Credit: Unknown]](https://icyseas.org/wp-content/uploads/2013/06/thule_air_base_aerial_view.jpg)