I started my California hike in the wrong direction heading south rather than north trying to reach the Ansel Adams Wilderness on my way to Yosemite National Park. It took me two hours to notice my error and another hour to get back to my starting point. Thus I was already exhaused with blisters on my feet before my hike had even started. “Expert move” my trail diary states dryly, as I had spent the prior 5 months pouring over maps, gear, and spreadsheets. And yet, I could not tell north from south. A more serious error the next day almost ended my big pre-retirement adventure on its second day.

The photo above on the left shows my three U.S. Postal Service packages with food to resupply my backpack filled with the stuff in the center photo. Each food package weighted about 14 lbs (~6.5 kg) to give me 3500 kcal for each of 7 days. So I was planing for a 28-day trip, but it turned out that I spent 35 days in the wilderness and used only 2 of those 3 resupply packages. I also feasted on restaurant food the day before my hike in Mammoth Lakes (a large steak on Aug.-9), the day of my first resupply stop in Yosemite Valley (an unlimited breakfast buffet on Aug.-19), the day of my first shower at Reds Meadow (a double cheeseburger for dinner and a massive breakfast burito on Aug.-26), and the day of my second and last resupply stop at Vermillion Valley Resort (a pizza with 4 beers for dinner and a Lumberjack breakfast on Sept.-1/2). My body shed 20 lbs (8 kg) during those 5 weeks in the mountains.
The map below shows San Francisco, the Central Valley of California, and the Sierra Nevada Mountains with my start (north) and end (south) point in blue. The red symbols show where I pitched my tent. The first part is a loop into and out of the backcountry of Yosemite National Park. Starting at Devil’s Postpile National Monument near Mammouth Lakes, I walked to Yosemite Village in 9 and back in 8 days. The second part was much easier as I stayed mostly on the John Muir Trail heading south for about 17 days. My lowest campsite was at 4000′ (1220 m) in Yosemite Village where I picked up first food resupply package while my highest campsite was at 11,700′ (3560 m) just below Muir Pass where I helped a Park Ranger with the evacuation of a hurt hiker by a police helicopter. You can access the interactive map at
https://caltopo.com/m/T8T7780/EDPCGF0HVB07PMG6
to zoom in for more detail.
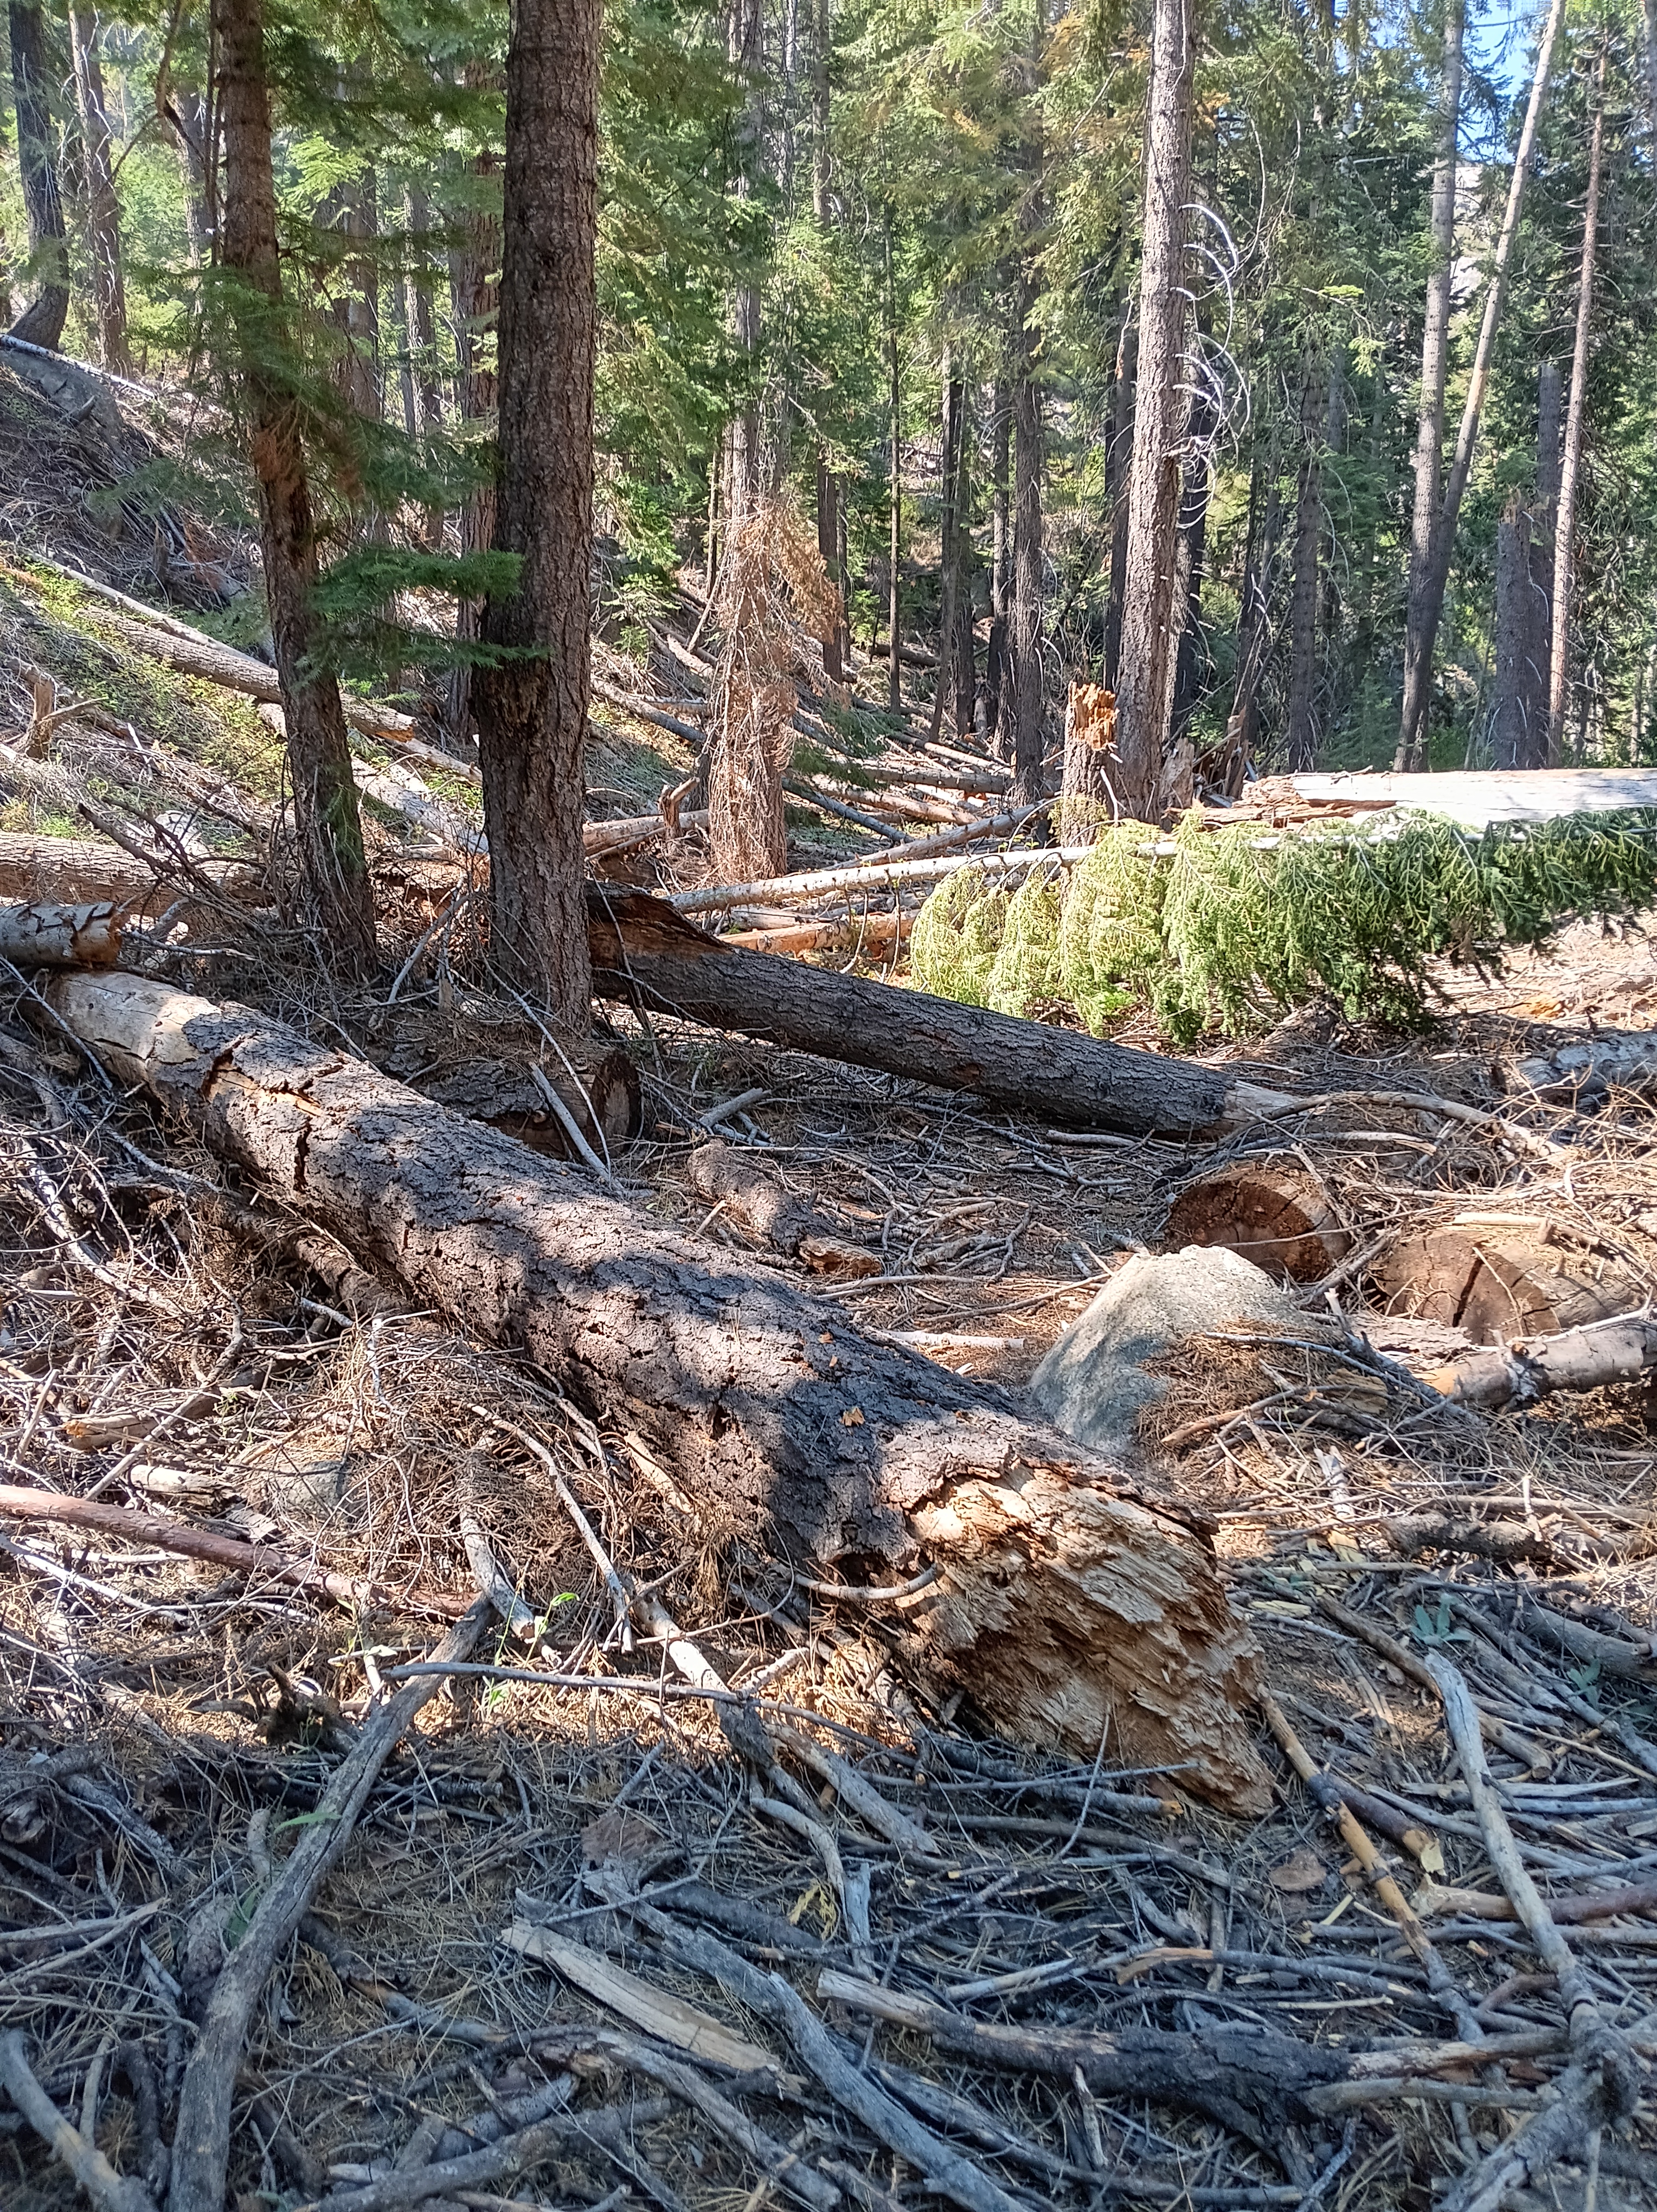
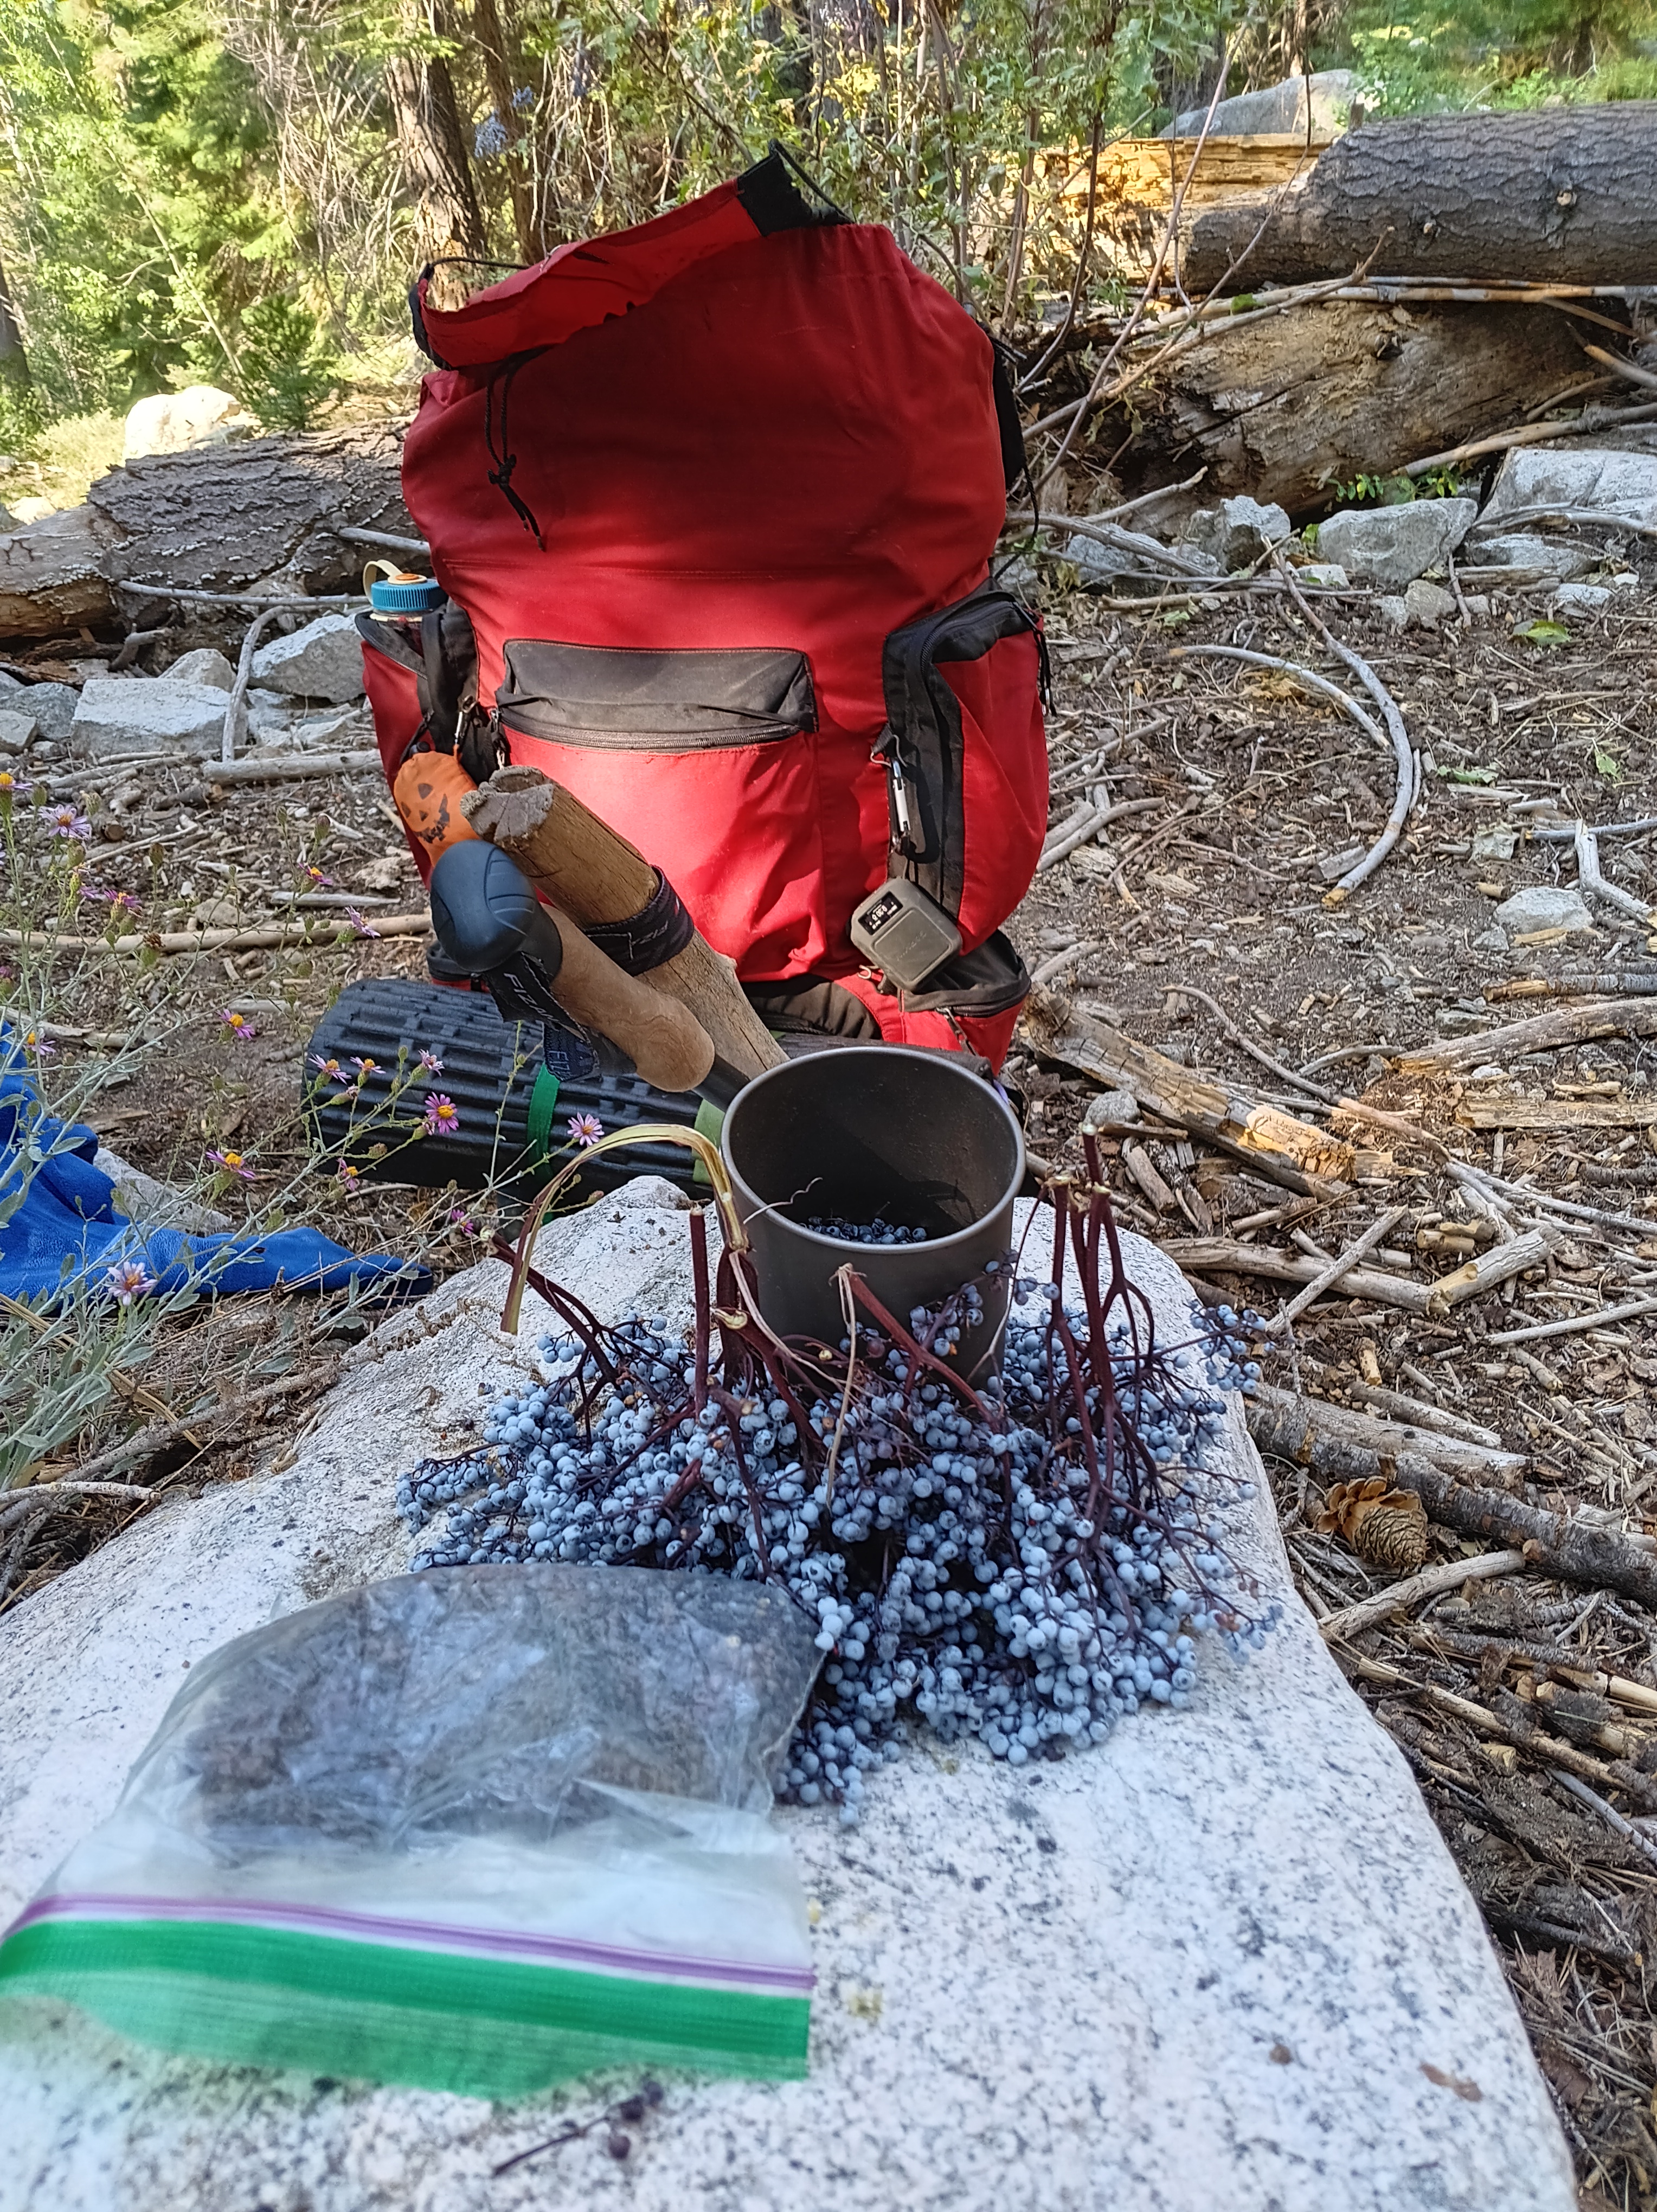
On Day-20 I found Ida Bell Hot Springs in Fish Valley. It was rough to get there, because that day I had to climb over and under constant wood piles created by toppled trees. The photo below on the left show the path that is littered by fallen trees along the steeply sloping V-shapped valley. This went on for 3 miles or 3 hours. Without the wood piles I usually hike at twice that speed. A more fun way to get slowed down, though, is to find, collect, and cook wild elderberries (middle photo below). Setting up camp along Fish Creek later, eating dinner with elderberry soup for desert, I went another 1.5 miles to look for the hot springs.
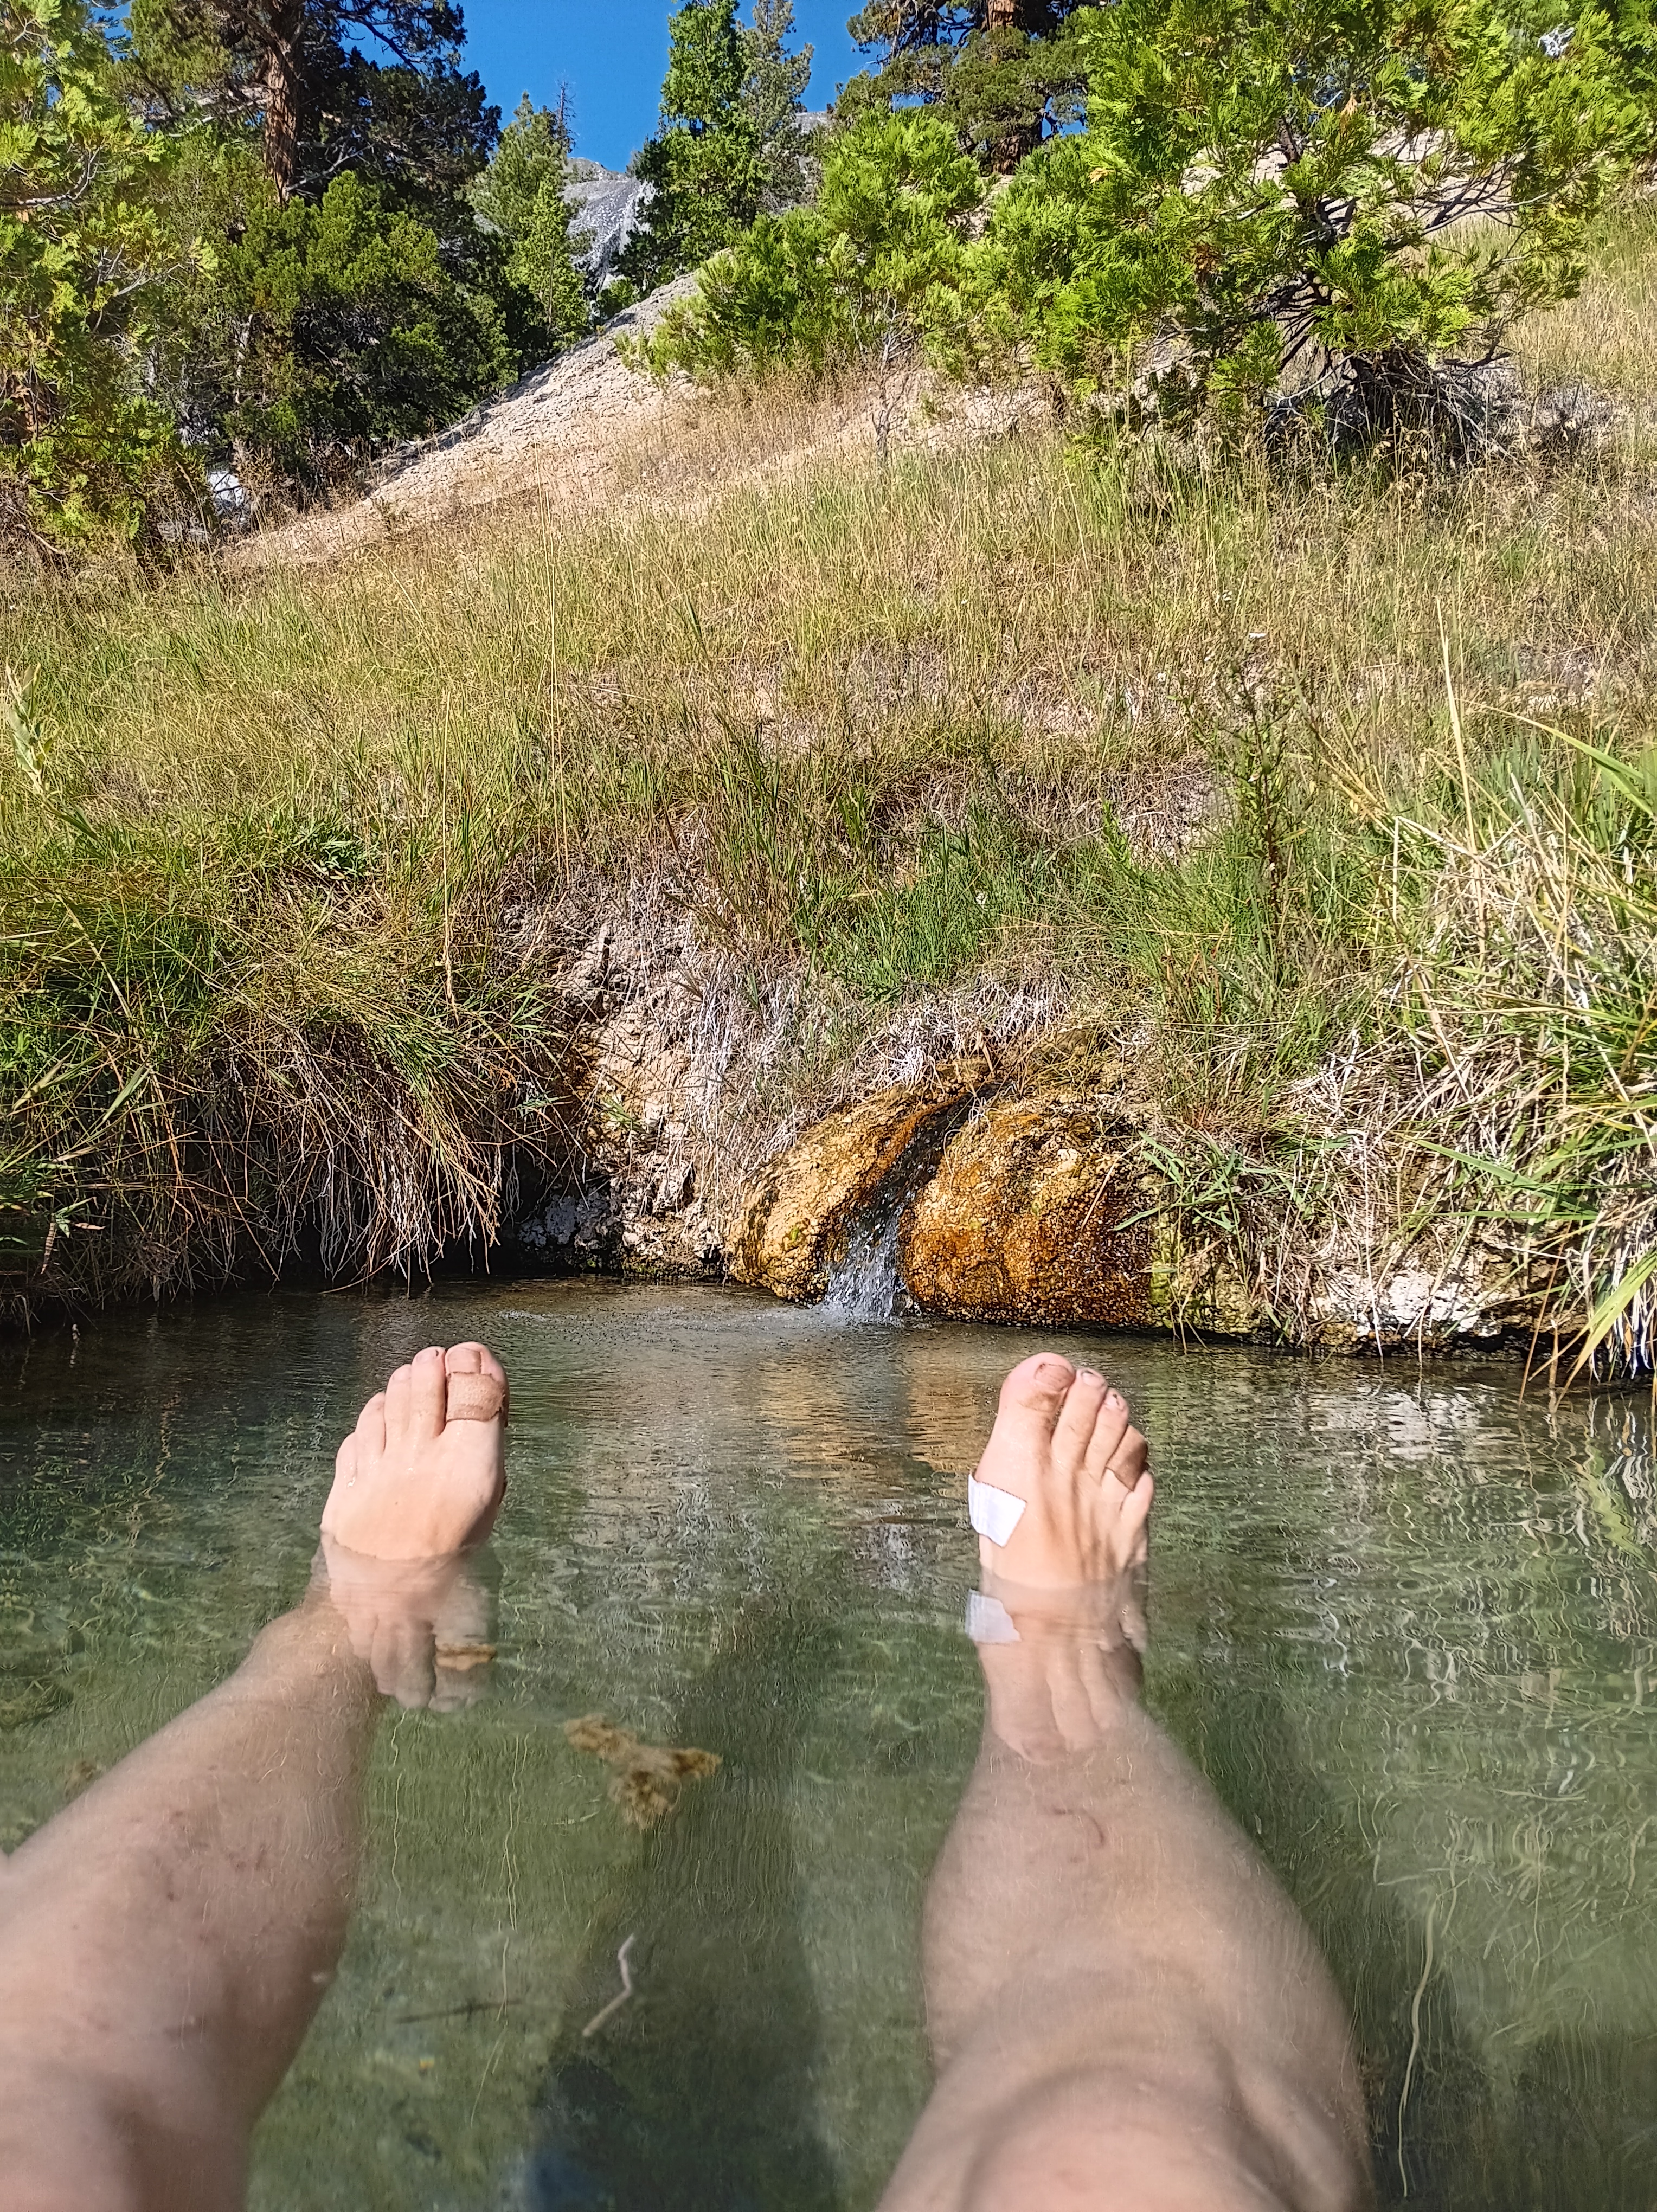
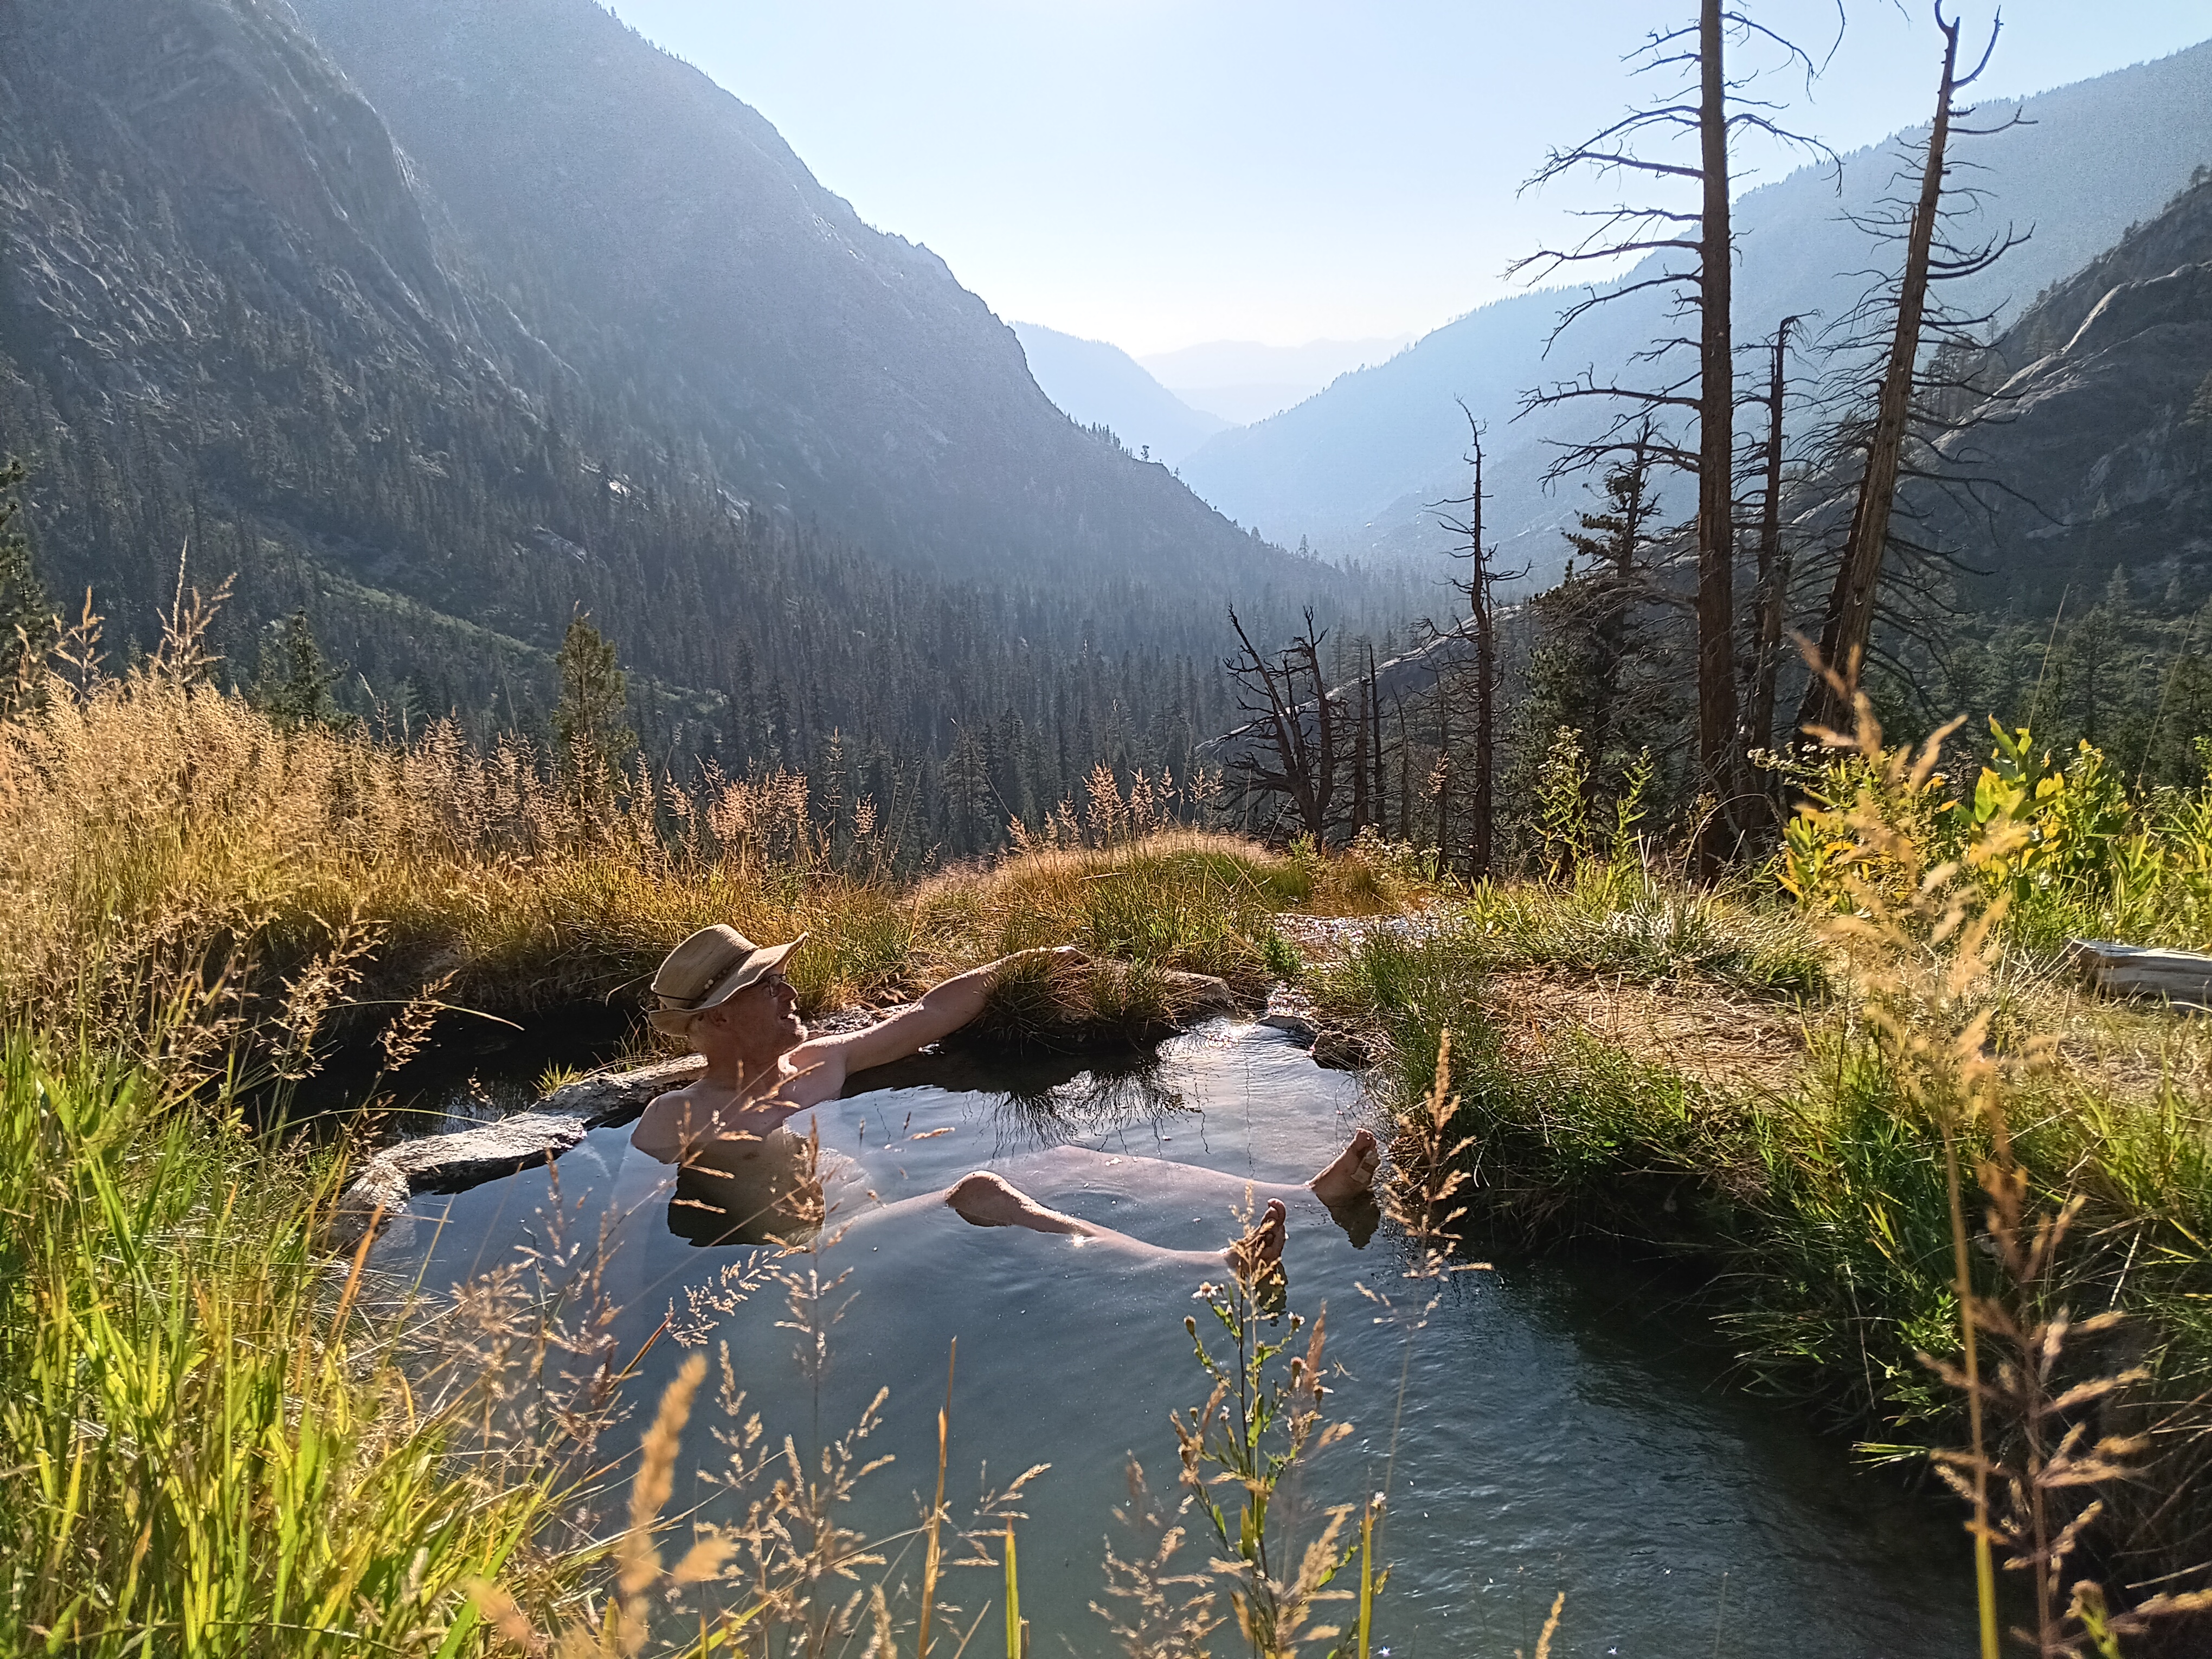
There are several hot springs, the hot water just emerges from rocks in the ground and is pooled (right photo with my blistered feet), but the one I liked best is at 7536′ (my tent was at 7133′). Its location offers a stunning view downstream into Fish Valley from where I had walked that day. The photo in the bottom shows me during a 2 hour soaking. And before I went to sleep at 8pm, I had another elderberry soup that I cooked with a tiny bit of water and the protein/dextrose/sugar mix that usually refurbishes my muscles at the end of each day. My trail diary states “Elderberries and soup were out of this world.” It was certainly one of many highlights of my 35 days walking in the wilderness.
Now, why did my adventure almost fail on the second day? Looking back, I did not know how to read maps just yet. My high resolution paper map has a dotted line that connects Minaret Lake with Cecile Lake, and Iceberg Lake just north of my trailhead (see map below). A dotted line means “Unmaintained Trail,” but I now know that this generally means that there is no trail at all. One thus has to “bushwack,” however, this dotted line was above the tree line near 10300′ (3140 m) without vegitation. Instead it was all rocks, boulders, talus, and scree. My trail diary states “… hard scramble almost vertical at times is hard with a heavy pack …” All was well initially, because I carefully navigated across a field of boulders, but these disappeared near the shore of Cecile Lake where dense vegitation gave the false impression of a more even ground. And here I twisted my ankle really bad. Initially I thought it was broken, but since I could wiggle my toe, I was lucky. Taking off my backpack, shoes, and socks, I cooled my ankle in the lake for an hour to minimize swelling. I then limped slowly along Cecile Lake at 10240′ and down past a tiny glacier discharging into Iceberg Lake at 9774′. Here I camped for the night nursing my ankle.

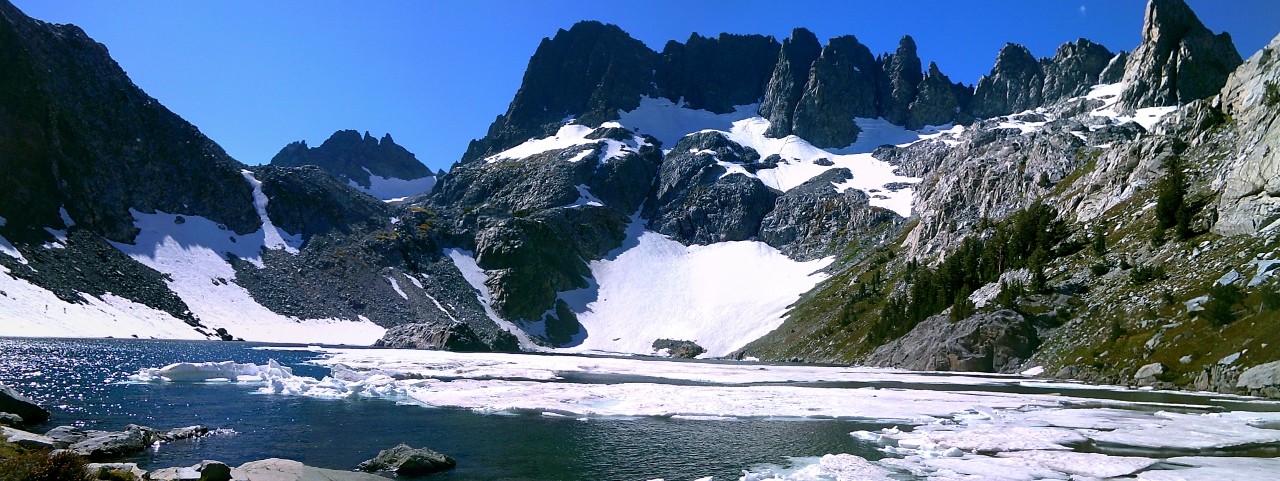
I walked and limped only 6 miles this day and cooled my ankle again in Iceberg Lake with a view on two small glaciers discharging their ice into the correctly names Iceberg Lake. There are no photos, because I had bricked my cell phone the night before by turning it off to save power not knowing the PIN of my SIM-cards. So I found this image of Iceberg Lake posted by Denise at beaut-tree.net
I was much surprised how well sleep, rest, and a positive attitude heals the body. As a result I walked 8 careful miles the next day only as my body allowed and felt comfortable. My trail diary states “… I need to be very careful where to place each step … I learnt my lesson. No bushwacking even if there is a dotted line on the map.”
There was another lesson, though, that served me well the next 33 days: Listen to your body and enjoy the moment. If your body wants to stop for a rest, a nap, or the day, do so. Hence I never knew where I would be at the end of the day or sleep the day after. There was a general plan, but the path was the goal and I quickly abandoned any plan or goal that was not fun or caused pain here or there. This, I believe, is why I succeeded to enjoy every day of the 35 days in the mountains. Mental fitness trumps physical fitness.