Tag Archives: freshwater

How oceans interact with Greenland’s last floating glaciers

Testifying before the US Congress back in 2010, I refused to endorse the view that a first large calving at Petermann Gletscher in North Greenland was caused by global warming. When a second Manhattan-sized iceberg broke off in 2012, I was not so sure anymore and looked closely at all available data. There was not much, but what little I found suggested that ocean temperatures were steadily increasing. Could it be that warm waters 1000 feet below the surface could melt the glacier at all times of the year? Did this melting from below thin the glacier? Did these changes increase the speed at which it moves ice from land into the ocean? These were the questions that motivated a number of projects that began in earnest in 2015 aboard the Swedish icebreaker I/B Oden. Professional videos of this expeditions are at https://icyseas.org/2019/07/04/petermann-glacier-videos-science/

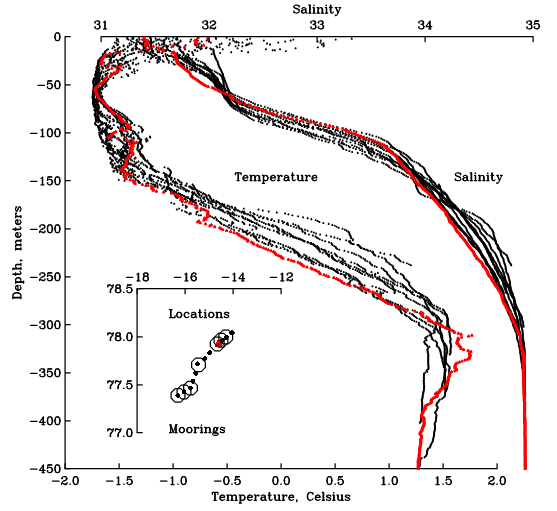
Scientists and technicians from the British Antarctic Survey drilled three holes through the floating section of Petermann Gletscher to access the ocean and ocean sediments below it. The ocean temperature and salinity profile confirmed both the warming trend observed in the fjord and ocean adjacent to the glacier, but more importantly, we placed ocean sensors below the glacier ice to measure temperature and salinity every hour for as long as the sensors, cables, and satellite data transmission would work. This has never been done around Greenland, so our data would be the first to report in real time on ocean properties below 100 to 300 m thick glacier ice at all times. What we saw when the data started to come in after 2 weeks, a month, and half a year stunned us, because (a) the ocean waters under the glacier changed by a very large amount every two weeks. Nobody has ever seen such regular and large changes in tempertures (and salinity) under a glacier bathed in total darkness at air temperatures of -40 degrees Celsius and Fahrenheit, but then our station went offline after 6 months and did not report any data to us via satellite.

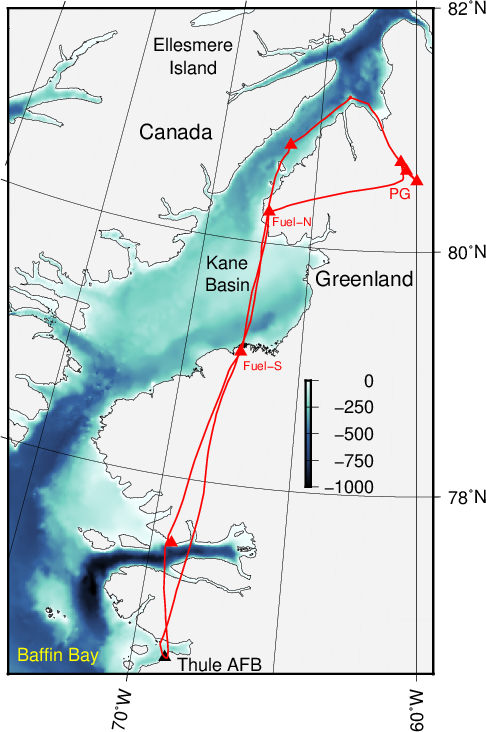
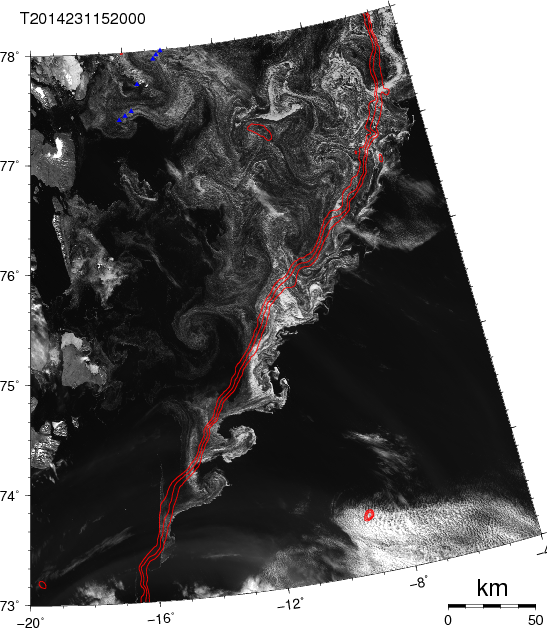
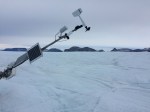
Helicopter flight path on 27/28 August 2016 to reach Petermann Gletscher (PG) via southern (Fuel-S) and northern (Fuel-N) fuel stops in northern Inglefield and southern Washington Land, respectively. Background color is ocean bottom depth in meters.

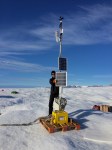
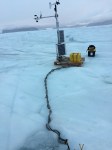
Refurbished Petermann Glacier Ocean Weather station on 28. August 2016 with Greenland Air helicopter and British Antarctic radar station in the background.

The first work on the grant was to visit our station by helicopter in 2016 using two fuel caches that we placed the year prior from the Swedish icebreaker. At this point Petermann Gletscher and our projects attracted the attention of journalists of the Washington Post who had read some of the blog articles at this site. The two journalists accompanied us for a week and produced a beautiful visual report of our work that is posted at

https://www.washingtonpost.com/sf/business/2016/12/30/with-enough-evidence-even-skepticism-will-thaw/

A detailed news report on our science and new findings appeared on page-1 of the Washington Post on January 1, 2017 [Broader Impacts]. I briefly summarize the results and findings of our subsequent data analyses of all data from August of 2015 through October of 2017 [Intellectual Merit]:

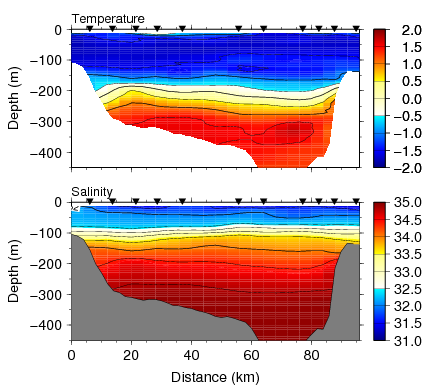
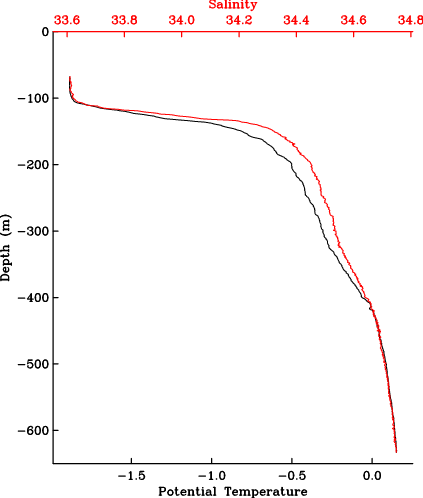
1a. Ocean temperatures increase at all five depths below the 100-m thick floating ice shelf of the glacier. These warmer waters are also saltier which demonstrates their Atlantic origin.

1b. Surface sensors indicate short, but intense pulses of meltwater passing our ocean array at spring-neap tidal cycles.

2a. Melt rate data reveal that these pulses occur during reduced tidal amplitudes and follow peaks in glacier melting that exceeded 30 feet per year.

2b. Statistical analyses indicate that the melt waters originate from a location near where the glacier sits on bed rock and that the melt water then moves seaward towards the ocean.

3a. Ocean melting below the glacier varies from summer (strong) to winter (weak) rising from a winter mean of 6 feet per year to a maximum of 240 feet per year during the summer.

3b. The large summer melting is caused by the increased discharge of subglacial runoff into the ocean near the grounding line.

3c. The larger discharge strengthens ocean currents under the floating glacier that drive ocean heat toward the glacier’s ice base.

The work formed one basis for the dissertation of PhD student Peter Washam who published the items #2 and #3 in the Journal of Physical Oceanography and Journal of Glaciology, respectively. He helped to drill holes and install sensors for the project that we first described at #1 in Oceanography. These three peer-reviewed journal articles are all published by not-for-profit professional organizations and societies dedicated to higher learning and public outreach. Furthermore we placed three separate data sets (1 | 2 | 3) at the Arctic Data Center that is funded by the National Science Foundation. More will come as we continue to work on the hard-won data from below Petermann Gletscher.

Look down the 0.3 meter wide drill hole. Yellow kevlar rope supports cable and ocean sensors.

Post Scriptum:
A modified version of the above was submitted the US National Science Foundation as part of the final reporting on grant 1604076 (“Glacier-Ocean interactions at a Greenland ice shelf at tidal to interannual time scales”) that funded this work with $360,400 at the University of Delaware from August 2016 through July 2019.
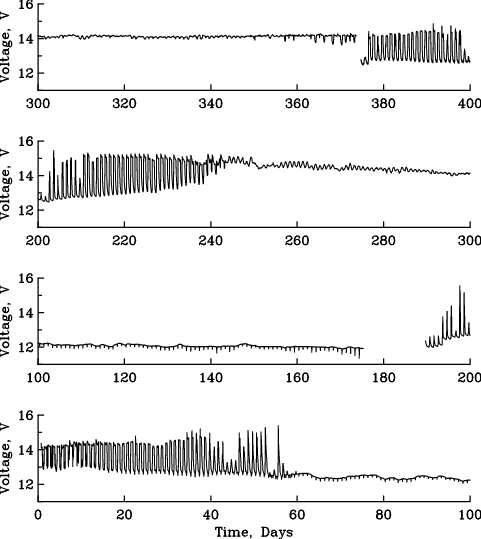
Oceanography below Petermann Gletscher for 400 Days

Ocean data from 810 meters below sea level under one of Greenland’s last remaining ice shelves arrives every 3 hours at my laptop via a 3-conductor copper cable that passes through 100 meter thick ice to connect to a weather station that via a satellite phone system connects to the rest of the world. This Ocean-Weather station on the floating section of Petermann Gletscher has reported for 400 days today. I am still amazed, stunned, and in awe that this works.

The station started 20th August of 2015 as a small part of a larger joint US-Swedish expedition to North Greenland after friends at the British Antarctic Survey drilled holes through the Empire-State-Building thick ice shelf. It is powered by two 12 Volt car batteries that are recharged by two solar panels. When the sun is down, the car batteries run the station as in winter when temperatures reached -46 C. When the sun is up, the solar cells run the station and top off the batteries. The voltage during the last 400 days shows the “health” of the station:

Battery voltage at the Petermann Ocean-Weather Station from Aug.-20, 2015 through  Sept.-23, 2016. The polar night is indicated by slowly declining voltage near 12 V while during the polar day voltage is near 14 V with oscillations in spring and fall during the transition from 24 hours of darkness to 24 hours of sun light.

Battery voltage at the Petermann Ocean-Weather Station from Aug.-20, 2015 through Sept.-23, 2016. The polar night is indicated by slowly declining voltage near 12 V while during the polar day voltage is near 14 V with oscillations in spring and fall during the transition from 24 hours of darkness to 24 hours of sun light.

There is an unexplained outage without data from February 12-25 (Day 175-189) which happened a day after the first data logger shut down completely without ever recovering. Our station has 2 data loggers: A primary unit controls 2 ocean sensors, atmospheric sensors, and the Iridium satellite communication. The secondary unit controls 3 ocean sensors and the GPS that records the moving glacier. Remote access to the secondary logger is via the primary, however, each logger has its own processors, computer code, and back-up memory card.

Inside of University of Delaware command and control of five ocean sensors and surface weather station. Two data loggers are stacked above each other on the left.

Inside of University of Delaware command and control of five ocean sensors and surface weather station. Two data loggers are stacked above each other on the left.

The primary logger failed 11th February 2016 when we received our last data via Iridium satellites until Keith Nicholls and I visited the station 27th and 28th August 2016 via helicopter from Thule, Greenland. Since I could not figure out what went wrong sitting on the ice with the helicopter waiting, I spent a long night without sleep to swap the data logger with a new and tested unit. I rewired sensors to new data logger, switched the Iridium modem, transceiver, and antenna, changed the two car batteries, and now both data loggers with all five ocean sensors have since reported faithfully every 3 hours as scheduled as seen at

http://ows.udel.edu

Lets hope that the station will keep going like as it does now.

The major discovery we made with the ocean data are large and pronounced pulses of fresher and colder melt waters that swosh past our sensors about 5 and 25 meters under the glacier ice. These pulses arrive about every 14 days and this time period provides a clue on what may cause them – tides. A first descriptive report will appear in December in the peer-reviewed journal Oceanography. Our deeper sensors also record increasingly warmer waters, that is, we now see warm (and salty) waters under the glacier that in 2015 we saw more than 100 km to the west in Nares Strait. This suggests that the ocean under the glacier is strongly coupled to the ambient ocean outside the fjord and vice versa. More on this in a separate future posting.

Time series of salinity (top) and potential temperature (bottom) from four ocean sensors deployed under the ice shelf of Petermann Gletscher from 20th of August 2015 through 11th of February 2016. Temperature and salinity scales are inverted to emphasize the vertical arrangements of sensors deployed at 95m (black), 115 (red), 300 m, and 450 m (blue) below sea level. Note the large fortnightly oscillations under the ice shelf at 95 and 115 m depth in the first half of the record. [From Muenchow et al., 2016]

Time series of salinity (top) and potential temperature (bottom) from four ocean sensors deployed under the ice shelf of Petermann Gletscher from 20th of August 2015 through 11th of February 2016. Temperature and salinity scales are inverted in order to emphasize the vertical arrangements of sensors deployed at 95m (black), 115 (red), 300 m, and 450 m (blue) below sea level. Note the large fortnightly oscillations under the ice shelf at 95 and 115 m depth in the first half of the record. [From Muenchow et al., 2016]

P.S.: The installation and year-1 analyses were supported by a grants from NASA and the Jet Propulsion Laboratory, respectively, while the current work is supported by NSF for the next 3 years. Views and opinions are mine and do not reflect those of the funding agencies.

Coastal Oceanography off North-East Greenland

Greenland is melting, but it is not entire clear why. Yes, air temperatures continue to increase, but what does it matter, if those temperatures are below freezing most of the time. What if the ocean does most of the melting a few 100 m below the surface rather than the air above? It means that gut feeling and everyday experience can be poor guides for science, it means that there is more than meets the eye, and it means that some of Greenland’s melting happens out of sight without the dramatic imagery of a rapidly disintegrating glacier that sends icebergs out to sea.

Floating section of 79N Glacier in north-east Greenland as seen from LandSat in march 2014.

Floating section of 79N Glacier in north-east Greenland as seen from LandSat in march 2014.

In order to “see” where changes may happen out of sight American tax payers supported me via the National Science Foundation (NSF) to use available University of Delaware ocean sensors from an available German ship to investigate the ocean near two large glaciers off north-east Greenland. The sensors are in the water for over a year now and will stay there for another to collect data every half hour. The data are stored on computers inside the sensors and it is a marvel of smart engineering that we can measure water temperature, salinity, and velocity at the bottom of an ice-covered ocean. Now what would I do with such data?

Two ocean sensor packages ready for deployment near Isle de France, Greenland 10 June 2014.

Two ocean sensor packages ready for deployment near Isle de France, Greenland 10 June 2014.

First, one needs to know that in the Arctic Ocean temperature increases as one moves a thermometer from the surface towards the bottom for the first 900 feet or 300 meters. This only make sense, if the warm water is heavier than the cold water above. This is the case in the Arctic, because the warm water at depth is also very salty. The cold waters above contain less salt and that’s why they float. The warmest waters originate from the Atlantic Ocean to the south-east of Iceland. Lets call it Atlantic Water for this reason. The surface waters contain sea ice and its fresh melt water and thus are always close to the freezing point, so lets call them Polar Waters.

Vertical profiles of temperature and salinity across Norske Ore Trough, Greenland. The insert shows station locations for profiles (small symbols) and moorings (large circles). The red dot marks the location of the red profile.

Vertical profiles of temperature and salinity across Norske Ore Trough, Greenland. The insert shows station locations for profiles (small symbols) and moorings (large circles). The red dot marks the location of the red profile.

All along the East Coast of Greenland, we find a strong southward flow of ice and Polar Water called the East Greenland Current. On a rare clear day one can “see” this flow as a beautifully structured undulating band separating the deep Greenland Sea from the shallow and broad continental shelves. Now recall that the warmest waters are in the Atlantic layer way down and somewhat offshore. How do these waters cross the East Greenland current and the very wide continental shelf to reach the glaciers along the coast? It is this question my project tries to answer with lots of help from NSF and German friends.

Satellite image ocean current instabilities on Aug.-19, 2014 as traced by ice along the the shelf break, red lines show 500, 750, and 1000 meter water depth. Small blue triangles top left are ocean moorings.

Satellite image ocean current instabilities on Aug.-19, 2014 as traced by ice along the the shelf break, red lines show 500, 750, and 1000 meter water depth. Small blue triangles top left are ocean moorings.

We think that the warm and salty waters flow near the bottom below the East Greenland Current at deep bottom depressions such as canyons. Testing this idea, we placed our sensors in a line across the canyon with a small ice-capped island called the Isle of France on one side and Belgica Bank on the other. We deployed seven instrument as an array across the canyon to measure the speed and direction of the flow as well as its temperatures and salinities. Our canyon connects the deep Greenland Sea 150 miles to the east with two glaciers another 100 miles to the north-west. We all anxiously hope that no iceberg wiped out bottom moorings and that they all record data faithfully until the summer of 2016 when we plan to recover instruments and data.

Section of temperature across Norske Ore Trough with Isle de France, Greenland on the left and Belgica Bank towards Fram Strait on the right. The view is towards 79N Glacier.

Section of temperature across Norske Ore Trough with Isle de France, Greenland on the left and Belgica Bank towards Fram Strait on the right. The view is towards 79N Glacier.

Before and after the placement of our moored instruments, however, we did survey the section from the ship and I show the temperature and salinity across our canyon. We now see that the water below 200 m depth are indeed very warm and salty as expected, but there is a detail that I cannot yet explain: notice the slight upward sloping contours of salinity near km-80 at the rim of the canyon and the downward sloping contours on the other side near km-10. Such sloping contours represent a flow out of the page at km-80 and into the page at km-10 which is exactly the opposite of what I expected. All I can say at the moment is that this snapshot does not resolve motions caused by the tides, the winds, and the seasonal cycles properly, but our moorings do. So, there are still mysteries to be solved by the data sitting on the bottom of the ocean guarded by towering spectacles of ice.

Tabular iceberg and sea ice cover near Isle de France 10 June 2014

Tabular iceberg and sea ice cover near Isle de France 10 June 2014

[This entry will be submitted to NSF as a Final Outcome Report for award 1362109 “Shelf-Basin Exchange near 79N Glacier and Zachariae Isstrom, North-East Greenland.” The work would not have been possible without the generous support of NSF as well as the German Government as represented by the Alfred Wegener Institute who sponsored the expedition to North-East Greenland in 2014. Torsten Kanzow, Benjamin Rabe, and Ursula Schauer of AWI all deserve as much and even more credit for this work than do I.]

Budéus, G., & Schneider, W. (1995). On the hydrography of the Northeast Water Polynya Journal of Geophysical Research, 100 (C3) DOI: 10.1029/94JC02024

Hughes, N., Wilkinson, J., & Wadhams, P. (2011). Multi-satellite sensor analysis of fast-ice development in the Norske Øer Ice Barrier, northeast Greenland Annals of Glaciology, 52 (57), 151-160 DOI: 10.3189/172756411795931633

Reeh, N., Thomsen, H., Higgins, A., & Weidick, A. (2001). Sea ice and the stability of north and northeast Greenland floating glaciers Annals of Glaciology, 33 (1), 474-480 DOI: 10.3189/172756401781818554

Wadhams, P., Wilkinson, J., & McPhail, S. (2006). A new view of the underside of Arctic sea ice Geophysical Research Letters, 33 (4) DOI: 10.1029/2005GL025131

Lab Notes of a Physical Oceanographer

I go to sea to learn about oceans, glaciers, weather, and climate. Despite dramatic photos of exciting field work, those action-packed scenes or serene nature shots of beauty and violence are misleading. Most of my time is spent sitting an a desk in a spacious office with books, papers, telephone, and most important of all, my computers.

Most of my time is spent writing. The writing is varied and ranges from illustrated essays on IcySeas.org to computer code. Add technical writing of research proposals, papers, and reviews for funding agencies and scientific journals. My screen rarely looks like what is shown above with the beautiful LandSat image of 79N Glacier as a screen-saver, it actually looks like this

Picture 2

The blog-writing window is open on the right while a Fortran computer code is in the top left. The code processes temperature, salinity, and pressure data from Petermann Glacier. When the code is run in the bottom-left window, it produces numbers. In this specific case, the numbers are from the only profile of temperature and salinity that exists from Petermann Glacier. Koni Steffen collected the data in 2002. Columns are depths that start at -68 (meters), salinity at 33.774 (no units, think of this as grams per kilogram), temperature at -1.885 (degrees centigrade), and the last column is the density anomaly These numbers are better presented as a graph:

Koni2002raw

Notice that temperature and salinity start only at -68 meters. This is because the ice at this location was about 68-m thick. The Big Ben clock in London is about 96-m high, but this piece if Petermann was chosen because it was less hard to drill through 2/3 of Big Ben’s height when compared to drilling through the glacier ice a mile away where the ice is thicker than the Empire State Building in New York; but I digress.

The profile above reveals a pattern we find almost anywhere in deeper Arctic Waters: Temperature increases with depth. Under the ice at 68-m depth, water is at its freezing point. As you move down the water towards the bottom, salinity increases and so does temperature. It is still cold, about +0.2 degrees Celsius, but this is heat from the North Atlantic Ocean that for perhaps 20-50 years circled all the way around the Arctic Ocean from northern Norway, past Siberia, past Alaska, past Canada to reach this spot of Greenland. While this appears marvelous, and it is, this is NOT what gets a physical oceanographer excited, but this does:

Koni2002Gade

It is the same data, but I did some reading, physics, algebra and code-writing in that order. First, instead of temperature, the blue line shows the difference between temperature T and the temperature Tf above the freezing. The difference T-Tf relates to the amount of heat available to melt the ice somewhere. The black line is the real killer, though. It combines salinity and temperature observations to reveal where the glacier water resides at this location that was melted somewhere else. Without going into the physical details, glacier meltwater is present where the black line touches zero (the so-called Gade-line, so named after a Swedish oceanographer who proposed its use in 1979). This happens at a depth from about 280-m to 500-m depth. This means that the glacier is NOT melting where it is as thin as Big Ben, but instead where it is as thick as the Empire State Building. So this is where we will need to place our instruments.

Proving my initial point, I spent two hours of fun writing this blog. I now will have to focus on more technical writing to pay the many bills of sea-going research. These “lab-notes” also serve as a document to raise $10,845 to install instruments this summer through Petermann Gletscher, have a look and give a little, if you can at

https://experiment.com/projects/ocean-warming-under-a-greenland-glacier

First sensors for future Petermann Gletscher Observatory, Greenland

Two ocean sensors arrived from Germany where I used them last in an experiment off the coast of Greenland last year. I bought them in 2002 and they have been in Arctic waters most of the time where they measure ocean temperature and conductivity very accurately a few times every second. Conductivity of seawater is what oceanographers measure when they want to talk about salinity and Arctic oceanographers must know salinity if they want to talk about ocean density. Water from cold melting ice and glaciers is less dense (because it is fresh) than the warm and salty water from the Atlantic Ocean that does the melting. You need heat to melt ice, but the heat that melts Greenland from below by the ocean comes from the Atlantic. The heat is at depth 200-400 meters deep, because of salt in the water that makes it dense and sink.

Oceanography and physics are fun, but here are the photos of what I work with over the weekend at home … maybe in my garden, too, to practice for the Arctic deployment, you may even watch me do it on the web-cam in my garden pointing towards the heated bird-bath. Geeks at play, science is fun:

Two SBE37sm with one set of 12 lithium batteries.

Two SBE37sm with one set of 12 lithium batteries.

The housing of these two instruments are rated for 7,000-m depth, I will have to install the lithium batteries ($4.80 for a single AA battery); each instrument needs 12 of those. Since 2003 we deployed a number of these in the Arctic where they collected data for over 3 years every 15 minutes. One of my students, Berit Rabe now works in Scotland and her dissertation and peer-reviewed publication was based on data from a single 2003-06 deployment of about 20 such instruments.

SBE37sm connect via RS-232 cable to the serial port of an old Dell computer.

SBE37sm connect via RS-232 cable to the serial port of an old Dell computer.

The instruments connect via a serial cable to the computers. In the past I had problems with instruments bought 12 years ago, because computers develop faster than oceanographic instrumentation. So, new is not always better, so I bought an old Dell Windows XP machine on e-Bay for $200 (actually I bought 2) to make sure that my sensors match software, CPU, and operating systems of the time that the instruments were bought. In order to “talk” to the sensors, I will need to put the lithium batteries into them. I am very much looking forward to do this over the weekend.

To be continued …

Note: This is a lab-note from my crowd-funding experiment at https://experiment.com/projects/ocean-warming-under-a-greenland-glacier.