Tag Archives: oceanography

Greenland Glacier-Driven Ocean Circulation

Greenland’s coastal glaciers melt, shrink, and add to globally rising sealevel. They also drive local ocean currents that move icebergs around unless they are stuck on the bottom. The glaciers’ melt is cold fresh water while the adjacent ocean is both salty and warm. Checking on what we may expect against observations, I here use data from NASA’s Ocean Melts Greenland initiative that dropped ocean probes from an airplane into the ice waters off coastal Greenland to measure ocean temperature and salinity.

For six years these data show how the coastal ocean off Greenland varies from location to location next to glaciers as well as from year to year. More specifically, I picked Melville Bay in North-West Greenland for both its many glaciers and many dropped NASA ocean sensors. The ocean data allow me to estimate ocean currents by using a 100 year old physics method. I just taught this to a small class of undergraduate science students at the University of Delaware. My students are strong in biology, but weak on ocean physics. This essay is for them.

Melville Bay is a coastal area off north-west Greenland between the town of Upernavik (Kalaallisut in Greenlandic) near 73 N latitude where 1100 people live and the village of Savissivik (Havighivik in Inuktun) at 76 N latitude where 60 Inuit live. There are no other towns or settlements between these two villages that are about as far apart as Boston is from Philadelphia, PA. Imagine there were no roads from Boston to New York to Philadelphia but only one large glacier next to another large glacier. This is Melville Bay.

Below I show an excellent set of photos of Savissivik by a French husband and wife team who visited in 2013/14. Their photographic gallery captures elements of contemporary subsistence living in remote Greenland where animals like seals, birds, fish, narwhal, and polar bears provide food, fuel, clothing, and income.

NASA dropped some 50 ocean sensors into Melville Bay froma plane during the short summer seasons each year 2016 through 2021. I met NASA pilots, engineers, and scientists doing their experiments when I was doing mine from a snowmobile in April of 2017 and again with Danish friends from a Navy ship in August of 2021, but these are stories for another day.

Let me start with a map of where NASA dropped their ocean profiling floats into Melville Bay and thus introduce the data. While the surface waters are usually near the freezing point, waters 300-400 meters deep down are much warmer. They originate from the Atlantic Ocean to the south and one of the goals of NASA’s “Ocean Melts Greenland” campaigns was to determine if and how these Atlantic waters reach the coastal glaciers. Most glaciers of Melville extend into this warm ocean layer and thus are melted by the ocean.

In the map above I paint the maximal temperatures in red and the bottom depths in blue tones. The profile on the right shows data for all depths at one station. As salinity increases uniformly (red curve) the temperature increases to a maximum near 300-m depth (black curve). It is this maximal subsurface temperature that I extract for each station and then put on the contour and station map on the left. The straight blue line connects Upernavik in the south with Sassivik in the north. It is an arbitrary line, coast-to-coast cutting across Melville Bay.

The warmest warm waters we find near Upernavik in the south and within a broad submarine canyon that brings even warmer waters from Baffin Bay towards the coast. Temperatures here exceed 2.4 or even 2.7 degrees Celsius. Most coastal waters along Melville Bay have a temperature maximum of about 1.5 to 1.8 degrees Celcius (about 35 Fahrenheit) and this “warm Atlantic” ocean water melts the coastal glaciers. The ocean melts the glaciers summer and winter while the warm air melts it only in summer.

There is more, because the glaciers’ melt also discharge fresh water into the ocean where it mixes to to form a layer of less dense or buoyant water. The buoyant waters create a local sealevel that is a little higher along the coast than farther offshore. The map above indicates that this “little higher sealevel” comes to about 4 cm or 2 inches. If this pressure difference across the shore is balanced by the Coriolis force, as it often does, then an along-shore coastal current results. This coastal current would move all icebergs from south to north unless they get stuck on the bottom. Along the northern coastline of Melville Bay the surface flow is from east to west. The coastal current is strongest near Savissivik where we find a (geostrophic) surface current larger than 40 cm/s. At that speed an iceberg would move more than 21 miles per day. Such strong surface flows are exceptional and diminish rapidly with depth. Hence a freely floating iceberg with a draft of several hundred meters would move much slower than the surface current.

I met a hunter from Savissivik in April of 2017 and for a fast-moving night we discussed the state of local fishing, hunting, living, traveling, and working on the sea ice next to the glaciers of Melville Bay. He invited me to become his apprentice. As such I would now ask him about the surface currents outside his home. Which way does he observe the icebergs to move in summer or winter? Has hunting on the sea ice in winter changed over his life time? When is it safe to travel there with a dog-sled? Could he and I perhaps work together during the spring to deploy ocean sensors through the sea ice? I am dreaming again …

Ice, ocean, and glacier change in northern Greenland

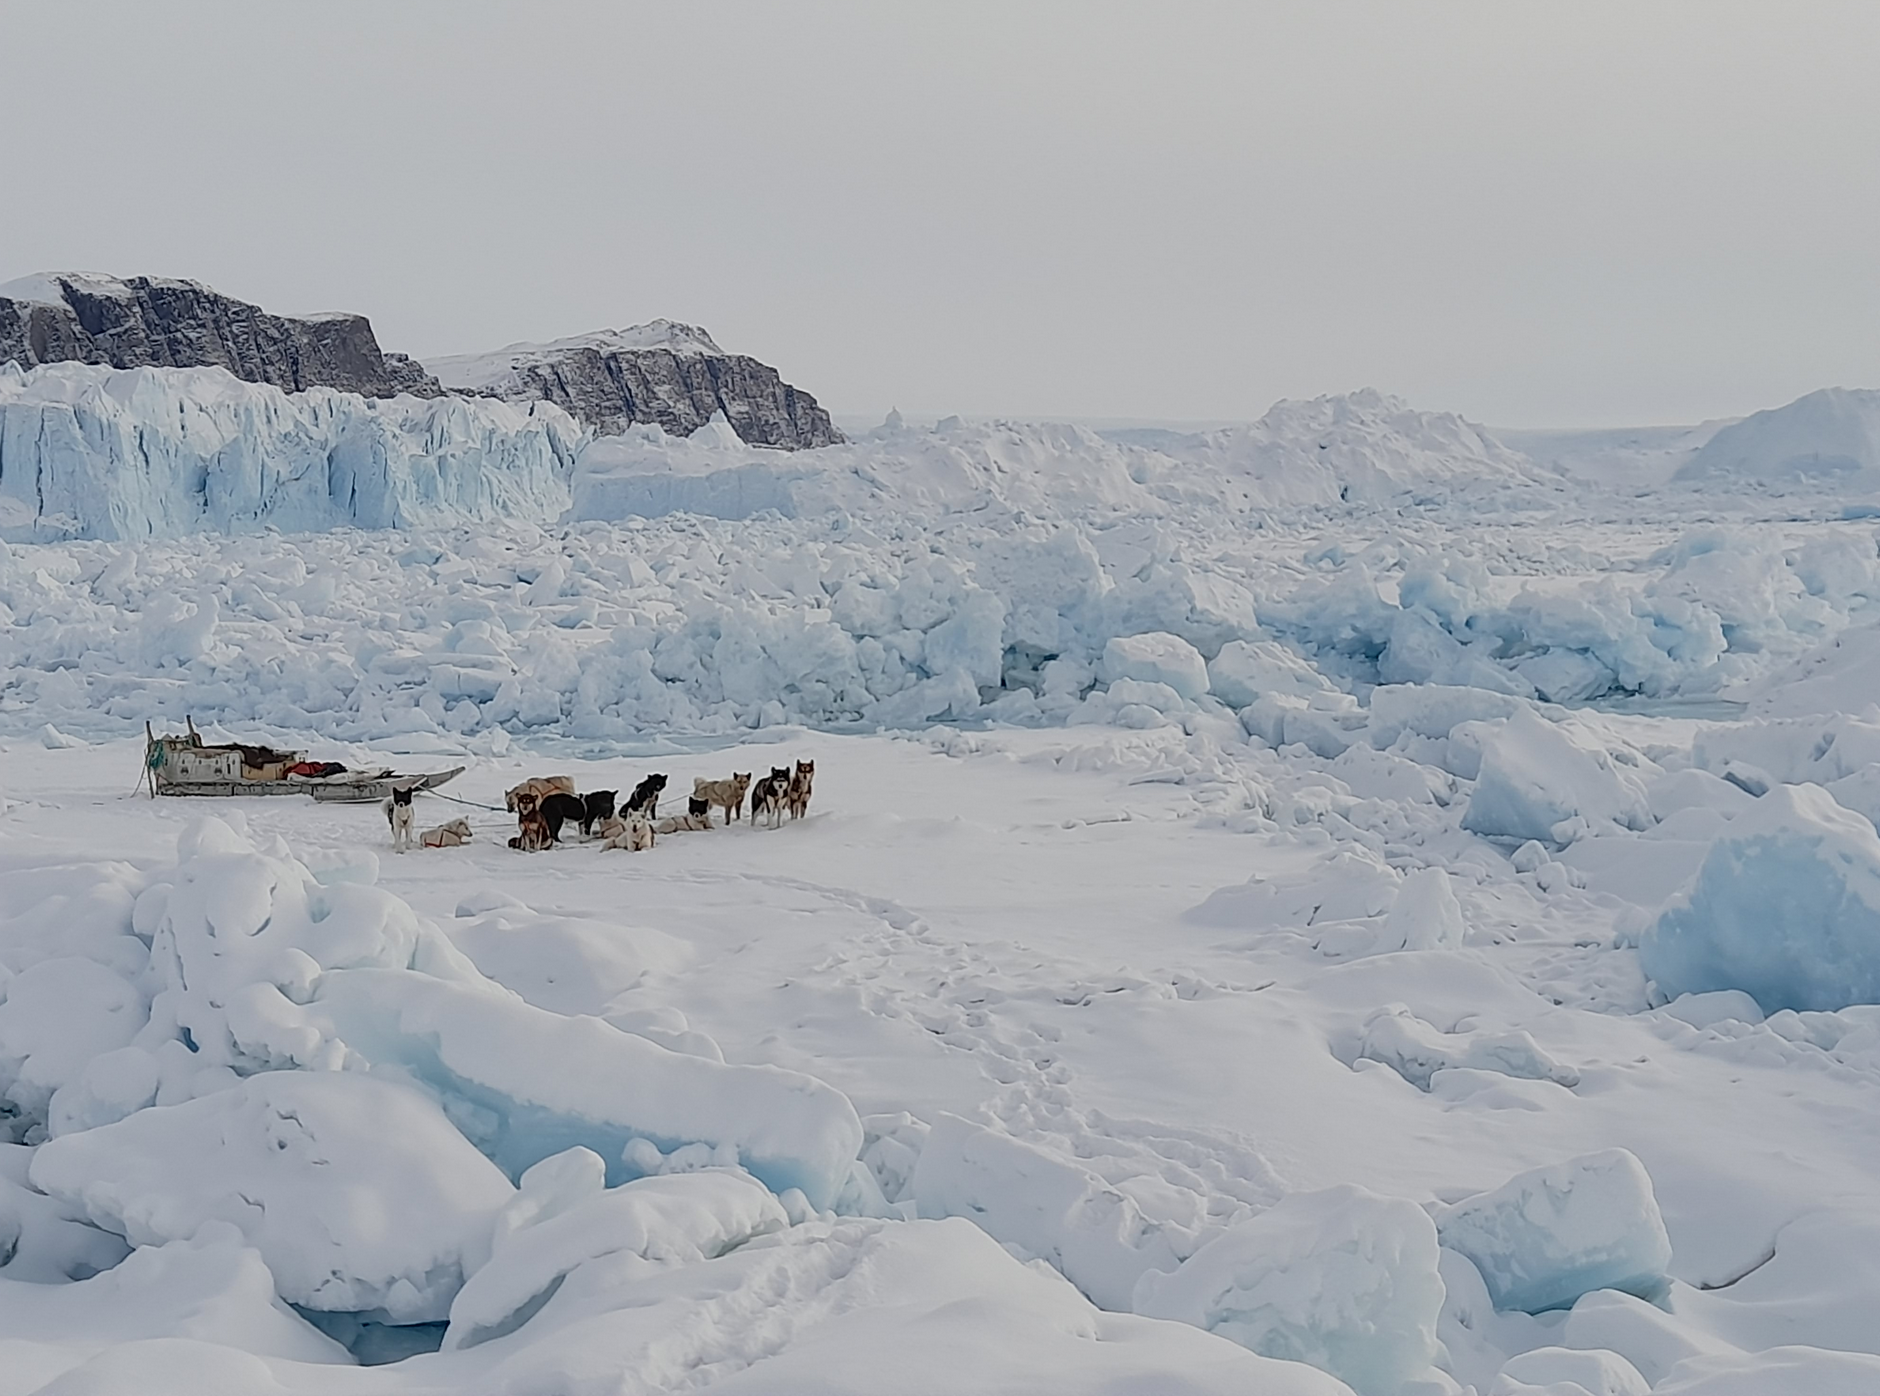
Steffen Olsen is a Danish physical oceanographer with a skill to present beauty to an artist like my wife and a scientist like me. Three days ago he posted a photo on Twitter with these words

Local hunters from Qaanaaq navigating our CTD system in the frozen ice mélange in front of Tracy Galcier 66W 77N to measure the ocean below. Heat loss to melting of glacial ice leaves the ocean at sub-zero temperatures down to 400m @arctic_passion @dmidk @ruth_mottram

Photo: Dogsled from Qaanaaq near the northern edge of Tracy Gletscher in Inglefield Fjord April 2022. [Credit: Dr. Steffen Olsen, Danish Meteorological Institute.]

Steffen’s photo shows his study area, research platform, and mode of transportation. There is a glacier in the background between the rocks on the left (north) and unseen mountains to the right (south). Equally unseen is the ocean under all this crushed and broken and piled up sea ice covered by fresh snow. We see tracks of people walking to the vantage point from where the photo is taken. The dogs rest on a small patch of level sea ice perhaps 3-5 feet (1 to 1.5 meters) thick.

There are boxes on the sled that contain gear to drill through the sea ice and then to send a probe down towards the ocean bottom to measure ocean temperature, saltiness, and oxygen during its decent. I did similar work with a snowmobile in 2017 based at Thule Air Base for 6 weeks. Steffen and I work together on such data. He collected these every year since 2011 both adjacent to Tracy Gletscher and along most of the ~120 km long and ~1000 meter deep fjord. I am grateful to Steffen to share this photo: It helps me to focus on my passions rather than my outrage at soldiers and leaders of the Russian Federation in their war to destroy Ukraine and its people building a free, vibrant, and democratic country for themselves. There is more, but I stop here now.

Let me start with a map of where in Greenland the photo was taken and where Steffen collected his data each since 2011. The red star in the insert top-right shows the location of the map between Canada and Greenland. I color ocean bottom depths in blue shades and land heights in green, yellow, and brown shades. The glacier in Steffen’s photo is at the north-eastern end of Inglefield Fjord where I placed the label Tracy. The label Qaanaaq shows where about 650 Inughuit live along the coast near the center of the fjord. It probaby took the dogs about 2-3 days to travel with their cargo from Qaanaaq to Tracy Gletscher. Red dots are stations served by a Danish Navy ship in the summer of 2015, but I here only talk about the blue dots.

Figure: Map of the study area with ocean sampling stations in Inglefield Fjord (blue dots) and adjacent northern Baffin Bay. [Unpublished own work.]

The blue dots are stations where Steffen and his companions drilled through the sea ice in 2018. Note that some of those ocean stations appear on land. This cannot be, but the glacier has retreated between the time the topographic data was collected and 2018 when Steffen collected the ocean data. Three LandSat satellite images below show how the glacier changed from 1973 to July and August of 2021. Icebergs are visible, too. A citizen scientist with the handle “Espen” at the Arctic Sea Ice Forum extracted these satellite photos from public U.S. databases. He is part of an online international community of Greenland and sea ice enthusiasts who posts at this forum for over a decade making daily discovers. These are people with regular jobs that in their spare time post satellite imagery and open data they found which they share openly often with insightful interpretations. It is citizen science at its very best. I go there often to read, ask, and learn. I even met a prominent member once for lunch when visiting Copenhagen on my way to Greenland. He gifted me LandSat imagery of my favorite glaciers printed on cloth that I framed for its scientific and artistic beauty. Thank you, Espen 😉

Gallery: Space photography (LandSat) of glaciers terminating from the Greenland ice sheet in Inglefield Fjord in 1973 (right), July 2021 (center), and August 2021 showing the retreat of Tracy but not Heilprin Gletscher. [Credit: Espen Olsen at Arctic Sea Ice Forum.]

So how does the ocean below all this ice next to a glacier look? Well, lets look at a set of station from Qaanaaq to Tracy Gletscher that shows how temperature, salinity, and oxygen of the water changes both with depth and along the fjord. We always find very cold, somewhat fresher, and highly oxygenated water near the ocean surface about 40 m (near glacier) to 100 m (near Qaanaaq) below the sea ice and warmer, saltier, and less oxygenated water below with a temperature maximum of 1 degree Celsius near 300 m depth. It is this warm water that melts the adjacent glacier. As Dr. Olsen says “… Heat loss to melting of glacial ice leaves the ocean at sub-zero temperatures …” In other words, the deeper waters 1. enter the fjord at temperatures above zero degrees Centigrade, 2. reach the glacier, 3. cool down as they melt the glacier, and 4. leave the fjord at temperatures below zero degrees Centigrade. This is why the two stations near the glacier show slightly fresher and cooler waters between 300 and 500 m depth. This water contains the glacial melt. The section represents the 10 year average from 2011 through 2020.

Figure: Section of salinity (bottom), temperature (center), and dissolved oxygen (top) along Inglefield Fjord as an average of data collected annually between 2011 and 2020. [Unpublished own work.]

Earlier this year I tried to visit Copenhagen to finish this work that places this emerging story into both a historical and spatial context, but Covid restrictions derailed this and other plans. Nevertheless, have excellent data from 1928 when this fjord was first surveyed by Danish oceanographers. At that time the waters had dramatically different temperatures (much colder) and salinities (a little fresher) both inside the fjord and in Baffin Bay adjacent to it. The changes are probably related to a much changed sea ice cover and perhaps ocean circulation that relates how the winds impact the ocean with and without sea ice. For the 1979 to present satellite record, we can quantify how much sea ice covers both the fjord and adjacent ocean. I made the graph below last week from 14073 almost daily satellite images whose data the U.S. National Snow and Ice Data Center distributes freely. I show annual averages for each of the 42 years that these SSM/I satellites have been measuring sea areal coverage from space.

Figure: Annual averages of sea ice cover 1979 through 2021 with linear trend lines for two 21-year subsets (blue) and the entire 42-year record (red). [Unpublished own work.]

Before the year 2000 the sea ice cover fluctuated between 26,000 and 39,000 km2 and if one for how these changes are trending between 1979 and 2002, one finds a slight increase in the blue line, however, this increase is not significantly different from zero at a high 95% level of confidence. For the second period after 2002, the ice covered area fluctuates much less, from about 22,000 to 28,000 km2 and the trend line in blue now indicates decreasing sea ice cover. As before, however, this blue trend line is no different from zero at the same high level of confidence. We also notice that there is a red trend line that I derive from using all 42 years of data. This line is very different and statistically significant, but it does not quiet do justice to the almost step-like change that appears to happen around 2000 through 2005. What happened then? I do not know, yet, but this is the fun of doing science: There is always more to discover. The sea ice cover in northern Greenland does not always follow a straight line. This is not different from our climate or life. Expect the unexpected, adjust, and keep moving. Or in Dr. Olsen’s words:

“… you have a number of years where conditions don’t follow the more linear track of (predicted) scenarios,” explained Dr. Olsen. “A warming tendency can be reversed for some years, for example.” [From https://phys.org, Oct.-13, 2021]

How oceans interact with Greenland’s last floating glaciers

Testifying before the US Congress back in 2010, I refused to endorse the view that a first large calving at Petermann Gletscher in North Greenland was caused by global warming. When a second Manhattan-sized iceberg broke off in 2012, I was not so sure anymore and looked closely at all available data. There was not much, but what little I found suggested that ocean temperatures were steadily increasing. Could it be that warm waters 1000 feet below the surface could melt the glacier at all times of the year? Did this melting from below thin the glacier? Did these changes increase the speed at which it moves ice from land into the ocean? These were the questions that motivated a number of projects that began in earnest in 2015 aboard the Swedish icebreaker I/B Oden. Professional videos of this expeditions are at https://icyseas.org/2019/07/04/petermann-glacier-videos-science/

Scientists and technicians from the British Antarctic Survey drilled three holes through the floating section of Petermann Gletscher to access the ocean and ocean sediments below it. The ocean temperature and salinity profile confirmed both the warming trend observed in the fjord and ocean adjacent to the glacier, but more importantly, we placed ocean sensors below the glacier ice to measure temperature and salinity every hour for as long as the sensors, cables, and satellite data transmission would work. This has never been done around Greenland, so our data would be the first to report in real time on ocean properties below 100 to 300 m thick glacier ice at all times. What we saw when the data started to come in after 2 weeks, a month, and half a year stunned us, because (a) the ocean waters under the glacier changed by a very large amount every two weeks. Nobody has ever seen such regular and large changes in tempertures (and salinity) under a glacier bathed in total darkness at air temperatures of -40 degrees Celsius and Fahrenheit, but then our station went offline after 6 months and did not report any data to us via satellite.

Helicopter flight path on 27/28 August 2016 to reach Petermann Gletscher (PG) via southern (Fuel-S) and northern (Fuel-N) fuel stops in northern Inglefield and southern Washington Land, respectively. Background color is ocean bottom depth in meters.

Refurbished Petermann Glacier Ocean Weather station on 28. August 2016 with Greenland Air helicopter and British Antarctic radar station in the background.

The first work on the grant was to visit our station by helicopter in 2016 using two fuel caches that we placed the year prior from the Swedish icebreaker. At this point Petermann Gletscher and our projects attracted the attention of journalists of the Washington Post who had read some of the blog articles at this site. The two journalists accompanied us for a week and produced a beautiful visual report of our work that is posted at

https://www.washingtonpost.com/sf/business/2016/12/30/with-enough-evidence-even-skepticism-will-thaw/

A detailed news report on our science and new findings appeared on page-1 of the Washington Post on January 1, 2017 [Broader Impacts]. I briefly summarize the results and findings of our subsequent data analyses of all data from August of 2015 through October of 2017 [Intellectual Merit]:

1a. Ocean temperatures increase at all five depths below the 100-m thick floating ice shelf of the glacier. These warmer waters are also saltier which demonstrates their Atlantic origin.

1b. Surface sensors indicate short, but intense pulses of meltwater passing our ocean array at spring-neap tidal cycles.

2a. Melt rate data reveal that these pulses occur during reduced tidal amplitudes and follow peaks in glacier melting that exceeded 30 feet per year.

2b. Statistical analyses indicate that the melt waters originate from a location near where the glacier sits on bed rock and that the melt water then moves seaward towards the ocean.

3a. Ocean melting below the glacier varies from summer (strong) to winter (weak) rising from a winter mean of 6 feet per year to a maximum of 240 feet per year during the summer.

3b. The large summer melting is caused by the increased discharge of subglacial runoff into the ocean near the grounding line.

3c. The larger discharge strengthens ocean currents under the floating glacier that drive ocean heat toward the glacier’s ice base.

The work formed one basis for the dissertation of PhD student Peter Washam who published the items #2 and #3 in the Journal of Physical Oceanography and Journal of Glaciology, respectively. He helped to drill holes and install sensors for the project that we first described at #1 in Oceanography. These three peer-reviewed journal articles are all published by not-for-profit professional organizations and societies dedicated to higher learning and public outreach. Furthermore we placed three separate data sets (1 | 2 | 3) at the Arctic Data Center that is funded by the National Science Foundation. More will come as we continue to work on the hard-won data from below Petermann Gletscher.

Look down the 0.3 meter wide drill hole. Yellow kevlar rope supports cable and ocean sensors.

Post Scriptum:
A modified version of the above was submitted the US National Science Foundation as part of the final reporting on grant 1604076 (“Glacier-Ocean interactions at a Greenland ice shelf at tidal to interannual time scales”) that funded this work with $360,400 at the University of Delaware from August 2016 through July 2019.

What’s happened at Petermann Gletscher since the Industrial Revolution 150 years ago?

More than 15 years ago I first set sight on the floating Petermann Gletscher when the United States’ Coast Guard Cutter Healy visited north-west Greenland for the first time on 10th August of 2003. We only had to sail 20 km into the fjord to reach a flat expanse of glacier ice that stuck less than 5 m (15 feet) above the sea. In 2012 and 2015 we had to sail another 20 km, because two large calving events had shortened the glacier farther back than it has since first records were kept in 1876. The terminus was also much higher, almost 25 m (75 feet) above the sea:

DSCN4444

Terminus of Petermann Gletscher 5th August 2015 from aboard the Swedish icebreaker Oden. View is to the south-east. [Photo Credit: Andreas Muenchow]

I published more detailed results on observed glacier change and estimated melt rates with Drs. Laurie Padman and Helen Fricker in the Journal of Glaciology from which I take these two figures:

Muenchow2014_01

Petermann Gletscher’s two large calving events in 2010 and 2012 as seen from MODIS satellite. The glacier is floating on the ocean seaward of the grounding line indicated by the thick black line. Black areas are open ocean water, white is ice. Adapted from Muenchow et al., 2014.

Muenchow2014_02

Time series from 1876 to 2014 of the length of Petermann Gletscher as measured from its grounding line at y=0 km. Triangles are observations while lines indicate a steady 1 km per year advance. The insert shows three maps of observed glacier shapes. From Muenchow et al., 2014.

Back in 2003 the glacier advanced about 1 km each year and it does so still. Almost the same, but not exactly, because the removal of 6 “Manhattans” in 2010 and 2012 increased the forward speed some, that is, the glacier now moves faster forward than it did before. Many sensors placed on the glacier measured this speeding, but the glacier also gets thinner as it speeds up. It is stretched thin. I published this back in 2016 together with Drs. Laurie Padman, Keith Nicholls, and my PhD student Peter Washam in Oceanography:

Muenchow2016_03

Speed at which Petermann Gletscher moves out into the sea from many different measurements. The glacier moves more slowly over land (negative distances) than it does floating over the ocean (positive distances). Estimates made after 2012 are about 10-20 % higher than RADARSAT estimates before that date. From Muenchow et al., 2016.

With substantial help from the British Antarctic Survey we installed in 2015 a small ocean observing system under the floating glacier. It transmitted data from 800 meters (2400 feet) below the 100 m (300 feet) thick glacier ice via cables connected to a weather station. We sucessfully repaired the station (as well as a Danish weather station nearby) that stopped transmitting data via satellites in 2016. Two journalists of the Washington Post, Chris Mooney and Whitney Shefte joined Keith Nicholls and myself. Their outstanding and accurate reporting of our work includes video and graphics for a wider audience that you can find at this link:

Washington Post Video of 2016 Petermann Gletscher Site Visit

The ocean and glacier data were worked over carefully by Peter Washam who defended his dissertation last month. Dr. Washam moved to Georgia Tech in Atlanta to work with Dr. Britney Schmidt whose interests relate to the ice-covered oceans below some moons of Jupiter. Peter connected ocean temperature and salinity with ice radar and remote sensing data to estimate how much the glacier is melted by the ocean and how the ocean does this. His main result will be published later this year in the Journal of Glaciology [Added July-12, 2019: Published online as Washam et al., 2019 at the Journal of Glaciology.], that is

“… This increase in basal melt rates confirms the direct link between summer atmospheric warming around Greenland and enhanced ocean-forced melting of its remaining ice shelves. We attribute this enhanced melting to increased discharge of subglacial runoff into the ocean at the grounding line, which strengthens under-ice currents and drives a greater ocean heat flux toward the ice base…”

The next large calving will be no surprise: Large fractures cross much of the glacier. They are visible about 10-20 km behind the current terminus and are discussed and closely monitored almost every day at the excellent site of Greenland Enthusiasts from all walks of life who post at

https://forum.arctic-sea-ice.net/index.php/topic,53.600.html

Furthermore, a new sophisticated computer model of Petermann Gletscher reveals that the loss of this large “still attached” ice island is already gone from the glacier in terms of the friction that it provides along the sidewalls. Another way of putting this, all it takes is a little wiggle or bump and the separation will become visible. Dr. Martin Rueckamp just published this study in the Journal of Geophysical Research.

There is much more to be explored with regard to Petermann. Here are some of the readings and writings that I have done with many fellow sailors through uncertain climates:

Johnson, H.L., A. Muenchow, K.K. Falkner, and H. Melling: Ocean circulation and properties in Petermann Fjord, Greenland. Journal of Geophysical Research, 116, doi:10.1029/2010JC006519, 2011. .pdf

Muenchow, A., L. Padman, and H.A. Fricker: Interannual changes of the floating ice shelf of Petermann Gletscher, North Greenland, from 2000 to 2012 Journal of Glaciology, 60, doi:10.3189/2014JoG13J135, 2014. .pdf

Muenchow, A., L. Padman, P. Washam, and K.W. Nicholls, 2016: The ice shelf of Petermann Gletscher, North Greenland and its connection to the Arctic and Atlantic Oceans, Oceanography, 29, 84-95, 2016. .pdf

Rueckamp, M, N. Neckel, S. Berger, A. Humbert, and V. Helm: Calving induced speed-up of Petermann Glacier, Journal of Geophysical Research, 124, 216-228, 2019. .pdf

Shroyer, E., L. Padman, R. Samelson, A. Muenchow, and L. Stearns: Seasonal control of Petermann Gletscher ice-shelf melt by the ocean’s response to sea-ice cover in Nares Strait, Journal of Glaciology, 63, doi:10.1017/jog.2016.140, 2017. .pdf

Washam, P., A. Muenchow, and K.W. Nicholls: A decade of ocean changes impacting the ice shelf of Petermann Gletscher, Greenland, Journal of Physical Oceanography, 48, 2477-2493, 2018. source

Washam, P., K.W. Nicholls, A. Muenchow, and L. Padman: Summer surface melt thins Petermann Gletscher ice shelf by enhancing channelized basal melt, Journal of Glaciology, 65, doi:10.1017/jog.2019.43, 2019. .pdf

Germany 1985 to 2018

I left my native Germany in 1985 to study oceanography in North Wales. I returned in 2018 as an American Professor of polar oceanography.  

  Much has changed in 33 years. For one, the divided country that I left is no more. The largely peaceful unification of Germany and Europe removed barbed wires, concrete walls, and shoot-to-kill orders along a violent border. The Cold War was over, I saw the scenes of joy on TV in a bar in Newark, Delaware more than 4100 miles (5600 km) away:

https://abcnews.go.com/Archives/video/nov-10-1989-celebration-berlin-wall-8980622

I experienced the “new” Germany for the first time when sailing aboard Germany’s icebreaker R/V Polarstern in 2014 to deploy ocean moorings. At the time I counted four distinct German cultures.  

  Today is a national holiday that celebrates the “Tag der Deutschen Einheit” or “Day of German Unity.” It is very much work in progress as Germany is becoming more diverse with its over 10 Million people born in countries other than Germany. Turkey (1.5 Mil), Poland (0.9 Mil), and Syria (0.7 Mil) field the most foreign-born people as of 2017. From my American perspective Germany has become a more normal country with its recent politics, troubles, inconveniences, and strengths that these diverse backgrounds entail.

Dragonfly and I arrived in Bremerhaven three months ago to live and work here for at least a year. It took us two days to get bicycles and another two days to find a well-furnished apartment. My parents visited the second weekend and we became Bremerhaven tourists for two days. We purchased the required catastrophic health insurance from a credible company for about €550/year each, but after 3 months we are still waiting for the installation of an internet connection at our home, but we are hopeful that this may change soon.

Author aboard German research vessel F/S Maria S. Merian in port of Longyearbyen, Svalbard in the fall of 2018. [Photo by Dragonfly Leathrum.]

Author aboard German research vessel F/S Maria S. Merian in port of Longyearbyen, Svalbard in the fall of 2018. [Photo by Dragonfly Leathrum.]