Tag Archives: glacier

Peanut Earth

I got in trouble in class today. When the earth was introduced as a sphere, I disagreed and stated that the earth was shaped like a peanut instead. While it got me laughs from some students, not everyone was amused. And yet, I am serious on two counts:

First, a sphere is a well defined shape that depends only on its radius. A sphere is a perfect mathematical idealization without a blemish such as a scratch, a bump, or a hole. It is also perfectly symmetric in two angles that I call longitude and latitude.

Second, a peanut eludes definition, because each peanut differs slightly from the next. It approximates a sphere poorly. Perhaps a spheroid is better approximation. It results when an air-filled beach ball is squished at its North-Pole. Still this does not look like a peanut, but instead of one parameter (its radius a), we now use two parameters (a and b) to describe it better. Or better yet, let us use three parameters (a and b and c).

For a perfect sphere three perpendicular lines from the center to the surface all have the same distance a (top) while for a spheriod only two of the three perpendicular lines have the same distance from the center (bottom right). If all three perpendiculars are different then we have something called a triaxial spheroid [Adapted from WikiPedia].

We can keep going like this for many, many more parameters by fancy sounding mathematical constructs. Still, neither peanut nor earth will ever be defined by perfectly defined mathematical objects, but a finite sum of them may approximate a true shape well enough. Both peanut and earth occur in nature and thus reflect physics, biology, and chemistry. As such our peanut earth can only be approximated by something mathematical, but the mathematics are always off by an amount that we can always make smaller by adding more parameters to describe the shape. In my glacier work off Greenland I use about 2200 such parameters to describe the shape of the earth to accurately represent its floating ice shelf.

Closing my argument, I find that the little peanut has more in common with our planet earth than a sphere. Peanut and earth may look different from a distance, but the closer we look, and the better our sensors become, and the more accuracy we require, the closer our approximation of earth resembles our approximation of the peanut. The sphere is just the first of many approximations of the real thing. The real thing has a name and the Smithonian Institution defines and describes geoid much better than I do here calling it peanut earth.

The colors in this image represent the gravity anomalies measured by GRACE. One can define standard gravity as the value of gravity for a perfectly smooth ‘idealized’ Earth, and the gravity ‘anomaly’ is a measure of how actual gravity deviates from this standard. Red shows the areas where gravity is stronger than the smooth, standard value, and blue reveals areas where gravity is weaker. [Credit: NASA/JPL/University of Texas Center for Space Research]

Scoresby Sund – Greenland’s Longest Fjord

Fog, fog, and more fog is all we saw as we approached Scoresby Sund aboard the German research ship Maria S. Merian from Denmark Strait to the south-east. The fog lifted as soon as we passed Kap Brewster and began work on ocean currents and waters at the entrance of this massive fjord system. My artist friend and wife Dragonfly Leathrum posted a wonderful travel essay with many photos that did not include these:

We were here to explore how the coastal ocean off Greenland may relate to Daugaard-Jensen Gletscher at the head of the fjord some 360 km away (195 nautical miles or about a day of constant steaming at 8 knots). This tidewater glacier discharges as much icy mass out to sea as does Petermann Gletscher or 79N Glacier to the north or half as much as Helheim, Kangerdlugssuaq, and Jacobshavn Glaciers to the south. Unlike all those other glaciers, Daugaard-Jensen and its fjord are still largely unexplored.

Location Map of Scoresby Sund. Kap Brewster is at bottom right while Daugaard-Jensen Gletscher 360 km away is near the top left.

Location Map of Scoresby Sund. Kap Brewster is at bottom right while Daugaard-Jensen Gletscher 360 km away is near the top left.

Part of the chart of the East Greenland coast drawn up by William Scoresby Jr. in 1822, showing the numerous features that he names in Liverpool land (Liverpool Coast) and adjacent areas. From: Scoresby (1823)

Part of the chart of the East Greenland coast drawn up by William Scoresby Jr. in 1822, showing the numerous features that he names in Liverpool land (Liverpool Coast) and adjacent areas. From: Scoresby (1823)

While the entrance between Kap Tobin and Kap Brewster was known to whalers in the early 19th century, it was William Scoresby Sr. after whom the fjord is named. His scientist son William Scoresby Jr. mapped coastal Greenland between 69.5 and 71.5 North latitude during his last voyage in 1822. Nobody entered the fjord until 1891 when Lt. Carl Ryder of the Danish Navy sailed deep into the fjord to explore the area for a year with 10 companions. They built a hut next to a natural port that they named Hekla Harbor. Amazingly, they also measured ocean temperature profiles almost every month from the surface to 400 m depth. I found these data at the National Ocean Data Center of the United States Government.

Ocean temperature (left panel) and salinity (right panel) as it varies with depth in different years. Blue represents measurements from 1891/92, red from 1990, and black from 2018.

Ocean temperature (left panel) and salinity (right panel) as it varies with depth in different years. Blue represents measurements from 1891/92, red from 1990, and black from 2018.

Searching for data from Scoresby Sund, I found 17 profiles of water temperature with data from at least 10 depths. Funny that 12 of these profiles were collected in 1891 and 1892 while the other 5 profile contain salinity measurements made in 1933, 1984, 1985, 1988, and 2002. The 1988 cast was taken by an Icelandic vessel and also contained continous data from a modern electronic sensor rather than waters collected by bottles. I “found” another 4 modern sensor profiles collected in 1990 at the Alfred-Wegener Institute in Germany.

That’s pretty much “it” … until we entered the fjord in 2018 when we collected another 27 casts thus more than doubling the ocean profiles. More exciting, though, is the very large shift in ocean temperatures from 1990 to 2018. The 1990 temperatures are very similar to the 1891/92 temperatures, but all old temperatures (also from 1933 and 1985, not shown) are all about 1 degree Celsius (2 degrees Fahrenheit) cooler than those we measured in 2018. Why is this so? Does such warming originate from outside the fjord? If so, how does the warmer Atlantic water at depth in deep water crosses the 80 km wide shallow continental shelf to enter Scoresby Sund? Are any of these ideas supported by actual data? What data are there?

Ocean data location off eastern Greenland collected from 1890 to 2010 that reside in NODC archives. Red are water bottle data while yellow are modern electronic sensor measurements. The white box bottom left is the entrance to Scoresby Sund. Light blue areas are water less than 500 m deep while dark blue shades are deeper than 1000 m.

Ocean data location off eastern Greenland collected from 1890 to 2010 that reside in NODC archives. Red are water bottle data while yellow are modern electronic sensor measurements. The white box bottom left is the entrance to Scoresby Sund. Light blue areas are water less than 500 m deep while dark blue shades are deeper than 1000 m.

Discoveries in science can be pretty basic, if one is at the right location at the right time with the right idea. Also, there is more data to the south that I did not yet look at to investigate the question of what causes the warming of bottom waters in Scoresby Sund.

EDIT Dec.-31, 2019: Replace “warmer” with “cooler” when comparing 1891 and 1990 (cooler) to 2018 (warmer) water temperatures.

What’s happened at Petermann Gletscher since the Industrial Revolution 150 years ago?

More than 15 years ago I first set sight on the floating Petermann Gletscher when the United States’ Coast Guard Cutter Healy visited north-west Greenland for the first time on 10th August of 2003. We only had to sail 20 km into the fjord to reach a flat expanse of glacier ice that stuck less than 5 m (15 feet) above the sea. In 2012 and 2015 we had to sail another 20 km, because two large calving events had shortened the glacier farther back than it has since first records were kept in 1876. The terminus was also much higher, almost 25 m (75 feet) above the sea:

DSCN4444

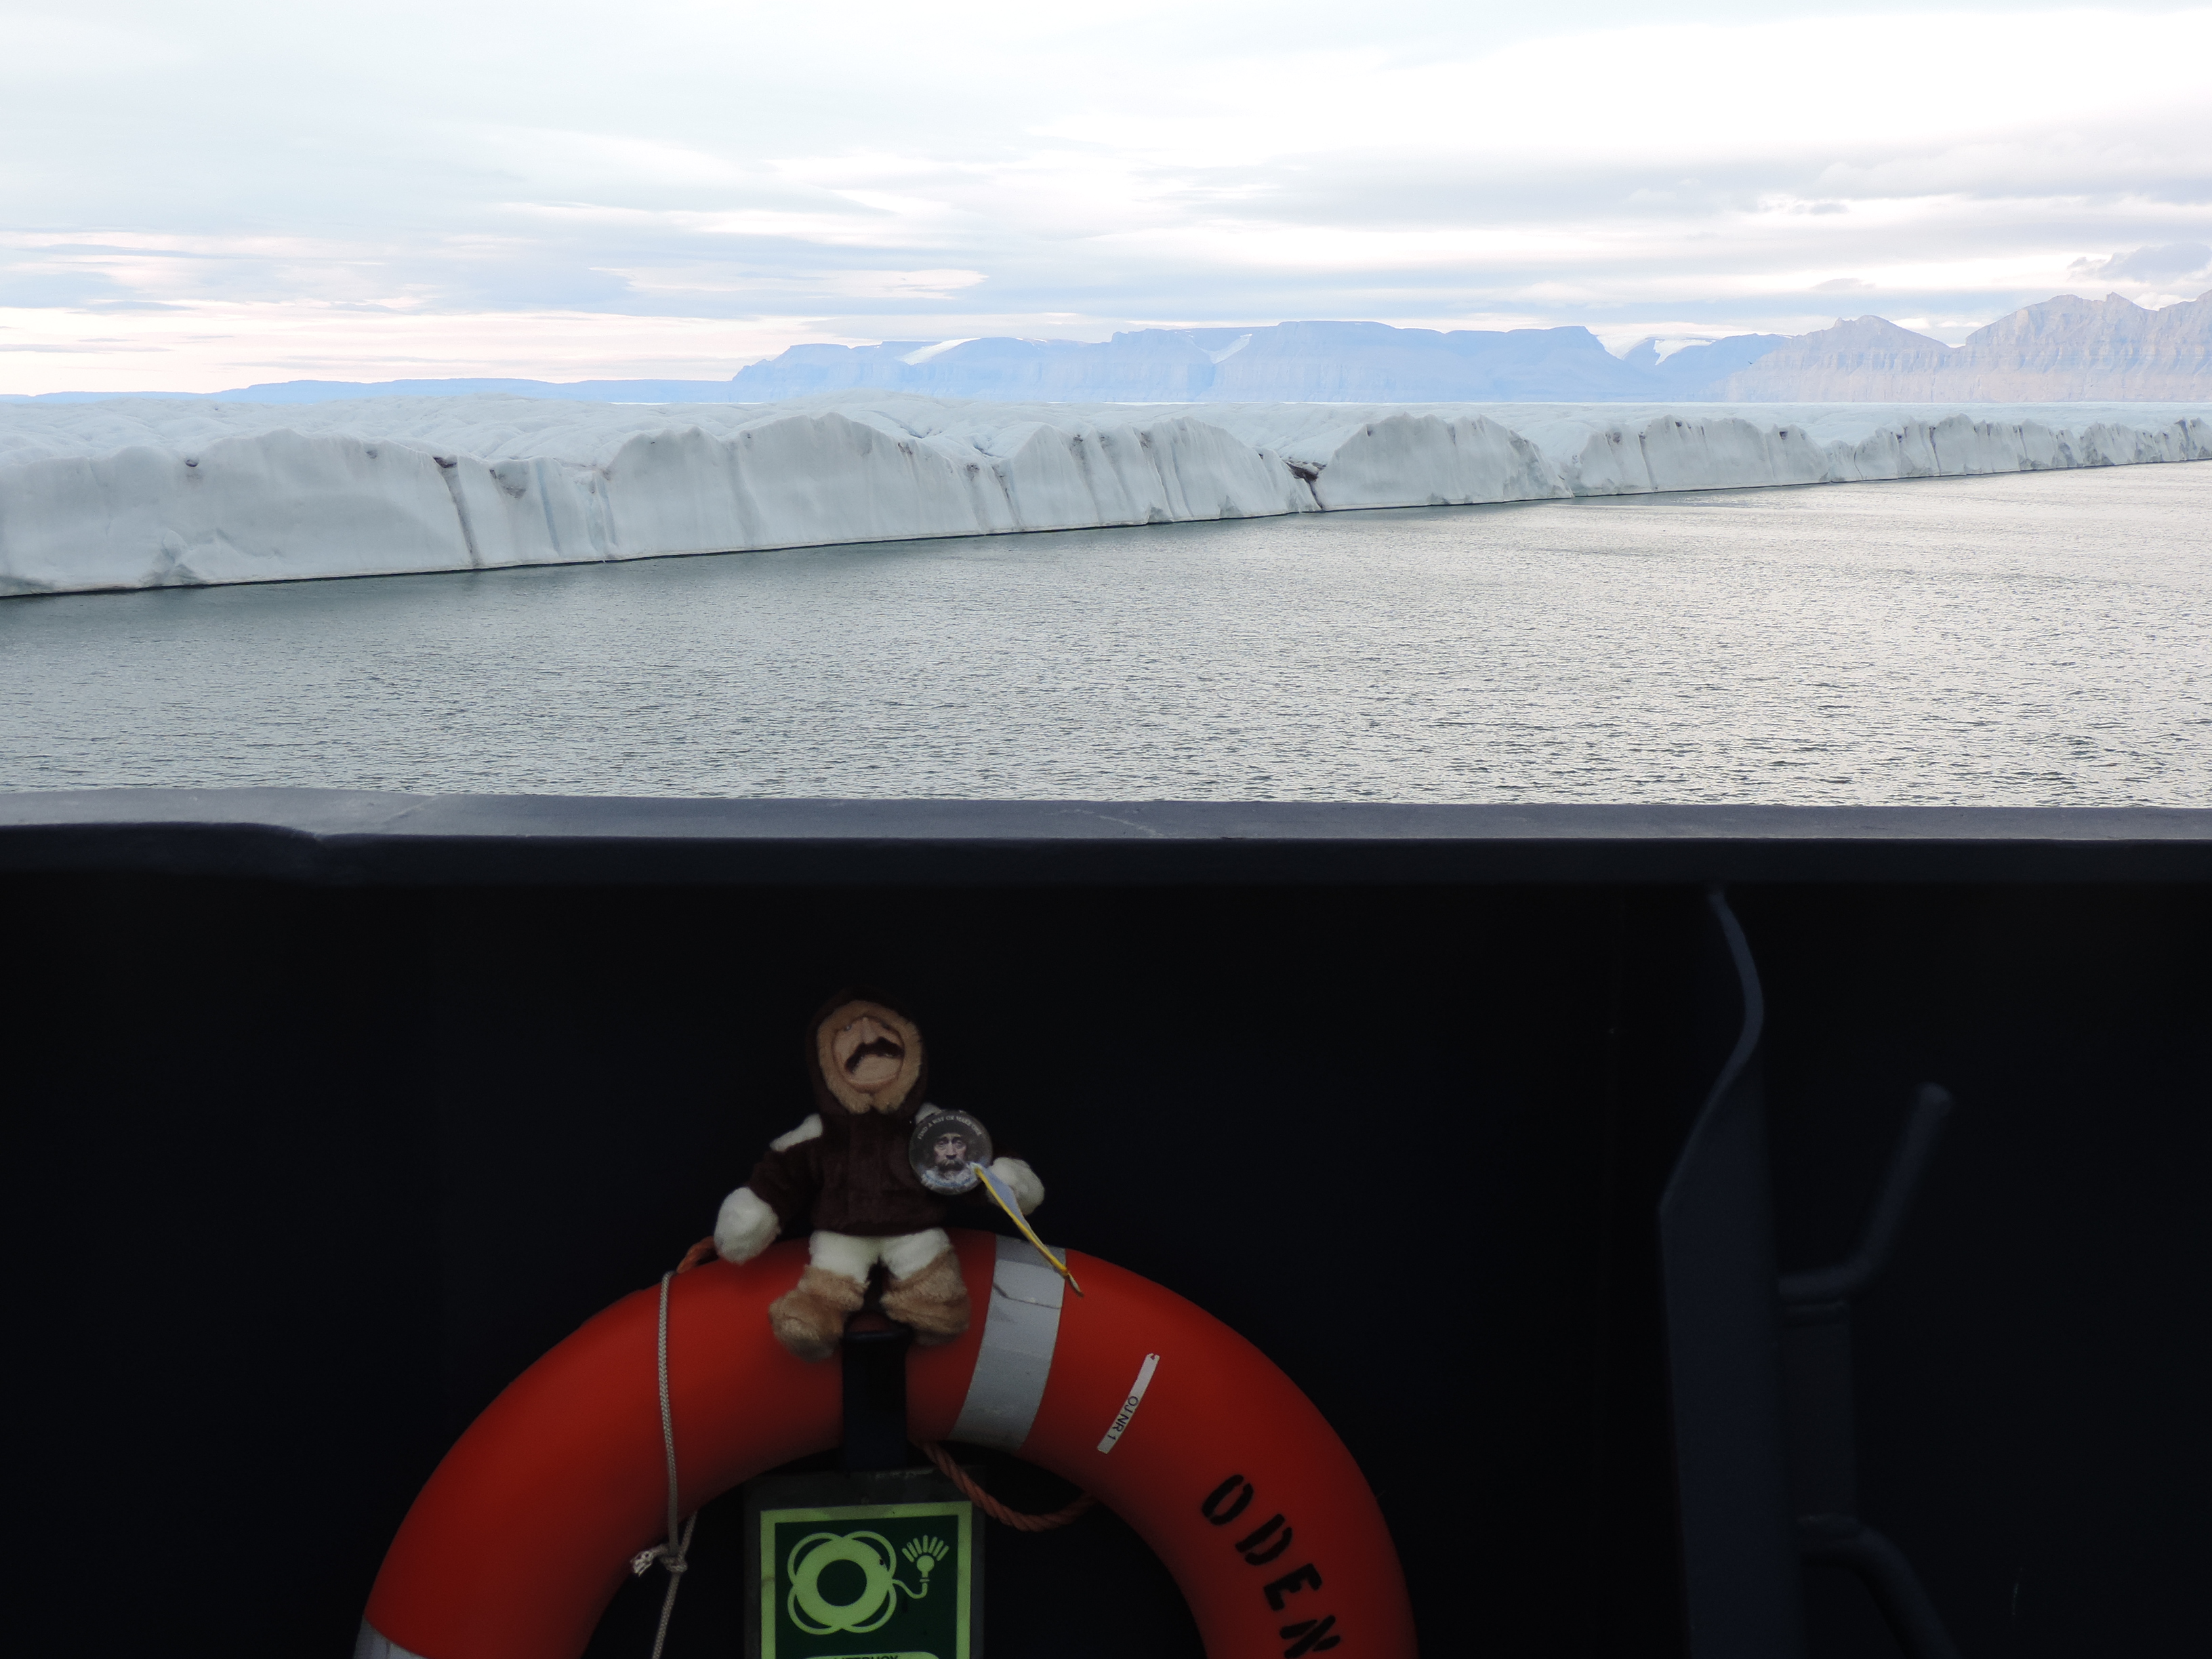
Terminus of Petermann Gletscher 5th August 2015 from aboard the Swedish icebreaker Oden. View is to the south-east. [Photo Credit: Andreas Muenchow]

I published more detailed results on observed glacier change and estimated melt rates with Drs. Laurie Padman and Helen Fricker in the Journal of Glaciology from which I take these two figures:

Muenchow2014_01

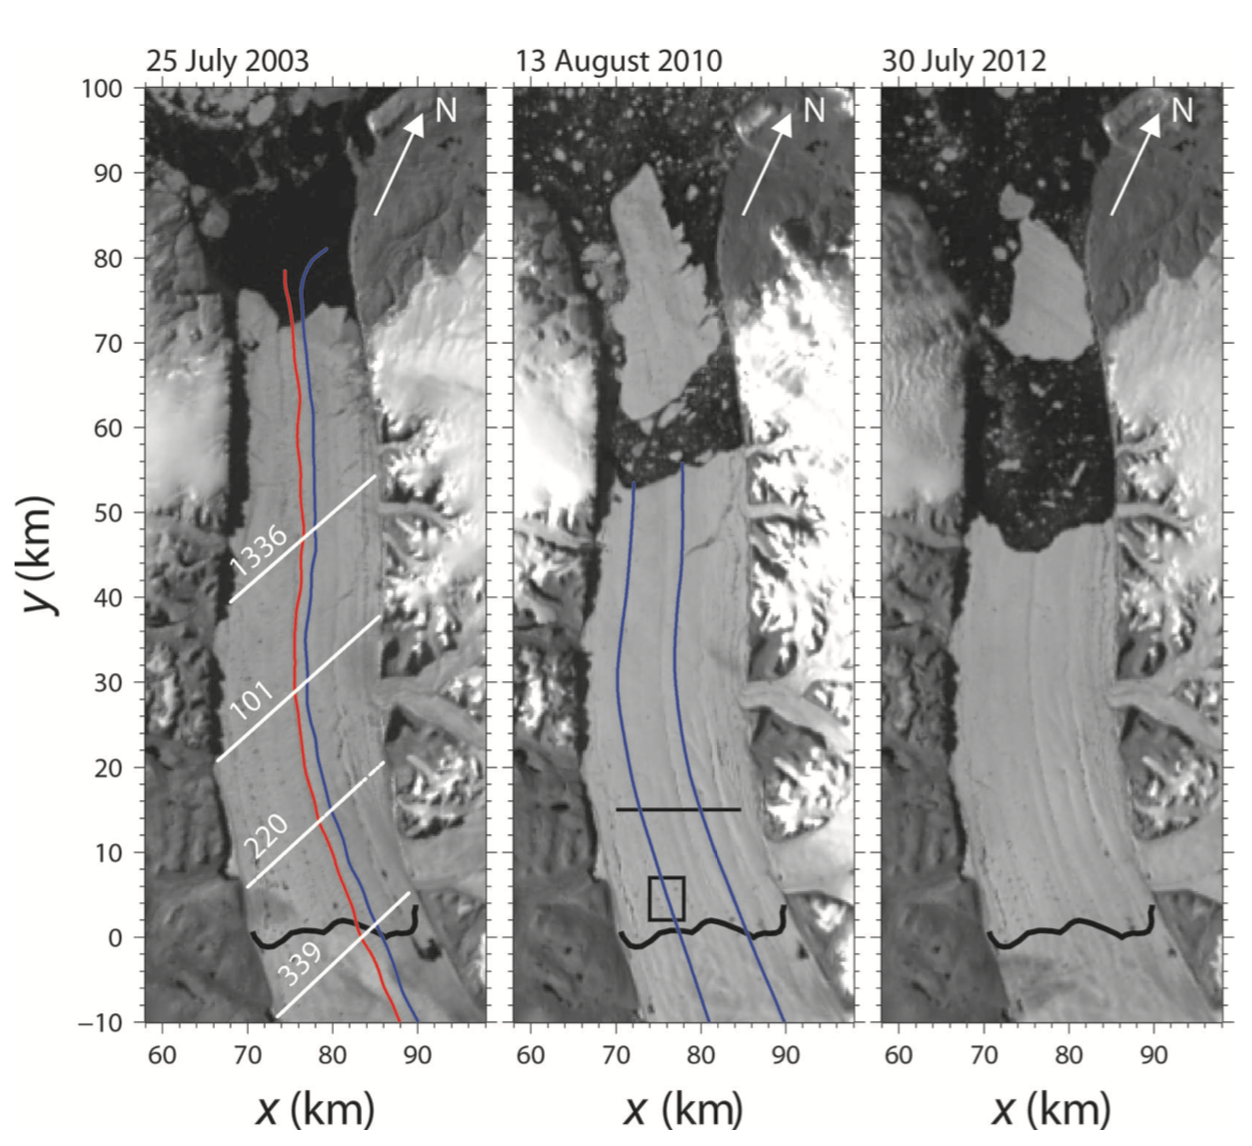
Petermann Gletscher’s two large calving events in 2010 and 2012 as seen from MODIS satellite. The glacier is floating on the ocean seaward of the grounding line indicated by the thick black line. Black areas are open ocean water, white is ice. Adapted from Muenchow et al., 2014.

Muenchow2014_02

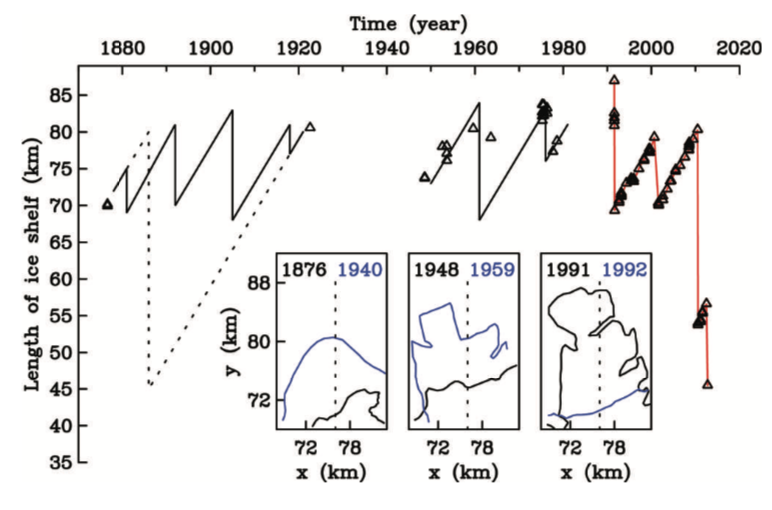
Time series from 1876 to 2014 of the length of Petermann Gletscher as measured from its grounding line at y=0 km. Triangles are observations while lines indicate a steady 1 km per year advance. The insert shows three maps of observed glacier shapes. From Muenchow et al., 2014.

Back in 2003 the glacier advanced about 1 km each year and it does so still. Almost the same, but not exactly, because the removal of 6 “Manhattans” in 2010 and 2012 increased the forward speed some, that is, the glacier now moves faster forward than it did before. Many sensors placed on the glacier measured this speeding, but the glacier also gets thinner as it speeds up. It is stretched thin. I published this back in 2016 together with Drs. Laurie Padman, Keith Nicholls, and my PhD student Peter Washam in Oceanography:

Muenchow2016_03

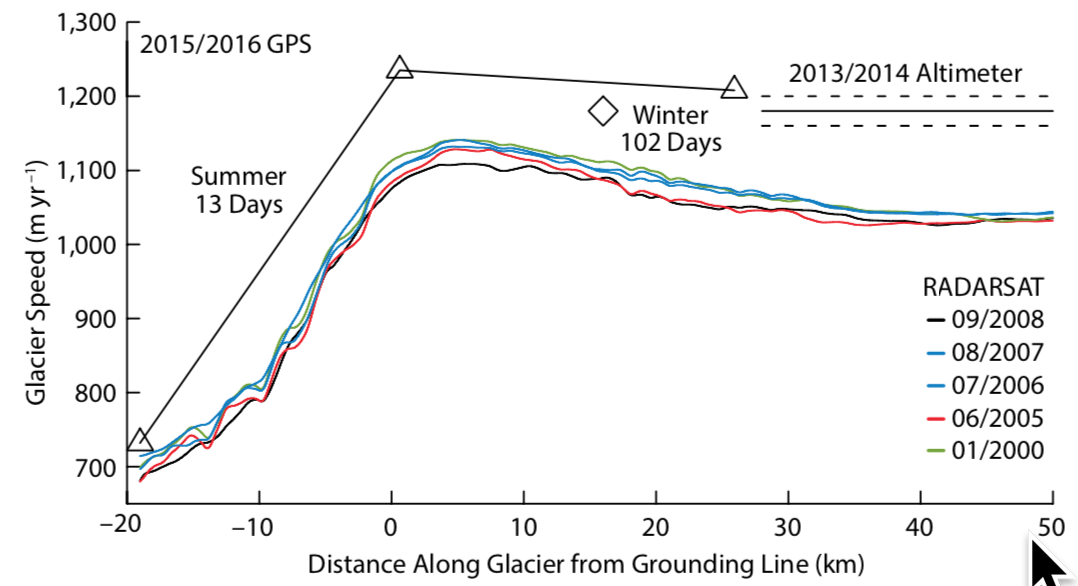
Speed at which Petermann Gletscher moves out into the sea from many different measurements. The glacier moves more slowly over land (negative distances) than it does floating over the ocean (positive distances). Estimates made after 2012 are about 10-20 % higher than RADARSAT estimates before that date. From Muenchow et al., 2016.

With substantial help from the British Antarctic Survey we installed in 2015 a small ocean observing system under the floating glacier. It transmitted data from 800 meters (2400 feet) below the 100 m (300 feet) thick glacier ice via cables connected to a weather station. We sucessfully repaired the station (as well as a Danish weather station nearby) that stopped transmitting data via satellites in 2016. Two journalists of the Washington Post, Chris Mooney and Whitney Shefte joined Keith Nicholls and myself. Their outstanding and accurate reporting of our work includes video and graphics for a wider audience that you can find at this link:

Washington Post Video of 2016 Petermann Gletscher Site Visit

The ocean and glacier data were worked over carefully by Peter Washam who defended his dissertation last month. Dr. Washam moved to Georgia Tech in Atlanta to work with Dr. Britney Schmidt whose interests relate to the ice-covered oceans below some moons of Jupiter. Peter connected ocean temperature and salinity with ice radar and remote sensing data to estimate how much the glacier is melted by the ocean and how the ocean does this. His main result will be published later this year in the Journal of Glaciology [Added July-12, 2019: Published online as Washam et al., 2019 at the Journal of Glaciology.], that is

“… This increase in basal melt rates confirms the direct link between summer atmospheric warming around Greenland and enhanced ocean-forced melting of its remaining ice shelves. We attribute this enhanced melting to increased discharge of subglacial runoff into the ocean at the grounding line, which strengthens under-ice currents and drives a greater ocean heat flux toward the ice base…”

The next large calving will be no surprise: Large fractures cross much of the glacier. They are visible about 10-20 km behind the current terminus and are discussed and closely monitored almost every day at the excellent site of Greenland Enthusiasts from all walks of life who post at

https://forum.arctic-sea-ice.net/index.php/topic,53.600.html

Furthermore, a new sophisticated computer model of Petermann Gletscher reveals that the loss of this large “still attached” ice island is already gone from the glacier in terms of the friction that it provides along the sidewalls. Another way of putting this, all it takes is a little wiggle or bump and the separation will become visible. Dr. Martin Rueckamp just published this study in the Journal of Geophysical Research.

There is much more to be explored with regard to Petermann. Here are some of the readings and writings that I have done with many fellow sailors through uncertain climates:

Johnson, H.L., A. Muenchow, K.K. Falkner, and H. Melling: Ocean circulation and properties in Petermann Fjord, Greenland. Journal of Geophysical Research, 116, doi:10.1029/2010JC006519, 2011. .pdf

Muenchow, A., L. Padman, and H.A. Fricker: Interannual changes of the floating ice shelf of Petermann Gletscher, North Greenland, from 2000 to 2012 Journal of Glaciology, 60, doi:10.3189/2014JoG13J135, 2014. .pdf

Muenchow, A., L. Padman, P. Washam, and K.W. Nicholls, 2016: The ice shelf of Petermann Gletscher, North Greenland and its connection to the Arctic and Atlantic Oceans, Oceanography, 29, 84-95, 2016. .pdf

Rueckamp, M, N. Neckel, S. Berger, A. Humbert, and V. Helm: Calving induced speed-up of Petermann Glacier, Journal of Geophysical Research, 124, 216-228, 2019. .pdf

Shroyer, E., L. Padman, R. Samelson, A. Muenchow, and L. Stearns: Seasonal control of Petermann Gletscher ice-shelf melt by the ocean’s response to sea-ice cover in Nares Strait, Journal of Glaciology, 63, doi:10.1017/jog.2016.140, 2017. .pdf

Washam, P., A. Muenchow, and K.W. Nicholls: A decade of ocean changes impacting the ice shelf of Petermann Gletscher, Greenland, Journal of Physical Oceanography, 48, 2477-2493, 2018. source

Washam, P., K.W. Nicholls, A. Muenchow, and L. Padman: Summer surface melt thins Petermann Gletscher ice shelf by enhancing channelized basal melt, Journal of Glaciology, 65, doi:10.1017/jog.2019.43, 2019. .pdf

Pine Island Glacier Grounding and Unhinging

I can’t get Pine Island Glacier, Antarctica out of my mind. Checking my e-mail over breakfast, I was alerted to the forum post of Dr. King, a geophysicist working at the University of Newcastle in northern England. His post provided a hint and link to data on where all glaciers around Antarctica are grounded. The file at the National Snow and Ice Data Center was too slow to download at home, so I quickly bicycled to work, got the data, wrote a little script , and plotted Pine Island Glacier’s grounding and “coastline”:

Pine Island Glacier, Antarctica as seen Jan.-12, 2012 from MODIS Terra. The blue colors top-left are ocean, red-yellow are ice. Thick black line shows where the glacier is grounded to the bedrock below sea level, that is, all "red" areas to the left (west) of this line are floating on the ocean. The thin black line is the "coastline." Grounding and coastlines are from National Snow and Ice Data Center'. North is to the top.

The image indicates a problem in a rapidly changing world: Both the “coastline” and the “grounding line” change with time, rapidly so. The black lines shown above come from hundreds of cloud-free satellite images from the 2004/05 summer in Antarctica. Dr. Scambos, Lead Scientist for the National Snow and Ice Data Center painstakingly analyzed these data and assembled them into the “Mosaic of Antarctica.” The derived coastline for the Pine Island region suggests, that the glacier advanced over 10 km in 7 years. The crack behind it identifies the next ice island that, I speculate, has already separates from the glacier, as its front is moving 10 times faster than the glacier itself. The grounding line looks different from one that I have seen before, too, e.g.,

Bottom topography under Pine Island Glacier and grounding line. North is to the bottom. (NASA)

Trying to resolve this issue, I google searched “Pine Island Grounding Line” only to find a number of excellent science essays and publications on the impacts that Pine Island Glacier and its streaming ice have on climate change and global sea level rise:

Good science essays hide in strange places: “West-Antarctic Ice: Slip-sliding Away” by Dr. Bruce E. Johansen of the University of Nebraska makes reference to a 2010 publication in the Proceedings of the Royal Society of Dr. Katz, University of Oxford. This theoretical fluid dynamicist modeled “Stability of ice-sheet grounding lines” . It is a very theoretical paper whose results are summarized in The New Scientist. This is where I am now, hoping on my bicycle to visit my BrewHaHa coffee shop to read the paper away from my desk over lunch.

Oh, I also stumbled into a NASA animation of how Pine Island and adjacent ice streams accelerate and become thinner very far inland as a result. The graphics are stunning, the data are free, and the message is scary, yet, the science is exciting and I feel very lucky to be able to study this. Watch it, get hooked on science, and have fun.

Swirling Ice in Coastal Waters off Eastern Greenland

Nature provides us with art that is always changing in time and space. Delicate swirls and vortices give a rare glimpse of how the ocean’s surface looked today off eastern Greenland. The data originate from the MODIS/Terra satellite which from 440 miles above the earth captures light that is reflected from anything below. Here it shows the ice-free ocean (bottom right) and Greenland’s ice-free Scoresby Sound (bottom left) in very dark blues, lightly vegetated lands (left) in light blue, and a highly organized pattern of sea ice (top right) in white. The resolution of this image of light just beyond the visible, just beyond the red is about 300 yards and the swirls and elongated filaments are about 3-5 miles. To me, they vividly show the ocean’s surface circulation.

Swirling surface motion on the continental shelf off eastern Greenland Sept.-12, 2011 as indicated by sea ice. Black lines show contours of bottom depth from 300 to 1200 meters in 300 meter increments.

The physics of these motions are similar to those I was reading into another beautiful work of art to the north of Norway. The postulated physics involve the earth’s rotation as well as differences in density. The density of the ocean relates to its temperature a little and to its salinity a lot. Near the coast and at the surface, ocean waters are much fresher and thus lighter than they are offshore and at depth, because Greenland’s melting glaciers and sea ice are fresher than the waters of the Atlantic Ocean. The thin black lines show bottom depths to distinguish the deep Atlantic Ocean to the right in the image from the shallow continental shelf off eastern Greenland to the left in the image. Note that all the swirls, eddies, and filaments are within 30 kilometers (20 miles) off the coast in water less than 300-m deep. The same physics apply to the algal blooms off Norway which is the reason that the swirls and eddies are of similar size here and there as well.

Incidentally, the same physics also apply the discharges from rivers and estuaries such as the Delaware or Cheasapeake Bay. There, the pattern are not quiet as visible to the naked (satellite) eye as off Norway or Greenland, but if one takes measurements of the ocean, similar patterns of ocean salinity and velocity as, I speculate, they do here for the ice (Greenland) and algae blooms (Norway). While my academic journey of fresh water discharges started with the discharge of the Delaware River into the Atlantic almost 25 years ago, I am still fascinated by the many ways these patterns always come back to me. Physics and oceanography are beautiful in both their many natural manifestations and its unique balance of forces. There is so much more in how the oceans interact with the ice and glaciers off Greenland and elsewhere. To be continued …