Category Archives: Polar Exploration

How big is Greenland?

Maps of Greenland were sketched with broken bones, frozen limbs, and starved bodies of men and dogs alike. On April 10, 1912 four men and 53 sled dogs crossed North Greenland from a small Inuit settlement on the West Coast where today the US Air Force maintains Thule Air Base. In 1912 Knud Rassmussen, Peter Freuchen, Uvidloriaq, and Inukitsoq searched for two explorers lost somewhere on Greenland’s East Coast 1200 km (760 miles) away. They returned 5 months later with 8 dogs without finding Einar Mikkelsen or Iver Iversen. These two arrived in North-East Greenland to find diaries, maps, and photos of three earlier explorers who had starved to death in the fall of 1908. Mikkelsen and Iverson found the records, but struggled to survive the winters of 1910/11 and 1911/12 alone stranded before a passing ship found them. I ordered their 1913 Expedition Report yesterday.

Dog sled teams drive across Greenland’s Inland ice in April 1912 from Clemens Markham’s Glacier in the west to Denmark Fjord in the east. All 4 explorers returned, but only 8 dogs did.
Map of Greenland as included in the Report of the First Thule Expedition 1912 by Knud Rasmussen.

I worked along these coasts in 2014, 2015, 2016, 2017, and 2018 on German research vessels, Swedish icebreakers, Greenland Air helicopters, and American snowmobiles. We explored the oceans below ice and glaciers with digital sensors but without hunger, cold, or lack of comfort. I feel that I know these coasts well, read what others have written and suffered. I make my own maps, too, to reveal patterns of oceans, ice, and glaciers that change in space and time. And yet, I am often lost by distances and areas. I do not know how big Greenland is.

Clockwise from top left: Ocean observatory on sea ice off Thule Air Base (Apr.-2017); refuelling helicopter in transit to ocean observatory on Petermann Gletscher (Aug.-2016); Swedish icebreaker in Baffin Bay (Aug.-2015); and deployment of University of Delaware ocean moorings from Germany’s R/V Polarstern off North-East Greenland at 77 N latitude (Jun.-2014).

At home I know distances that I walk, bicycle, or drive as part of my daily routine. I know areas where I live from weather and google maps, weekend strolls, and where family and friends live. Once we travel in unfamiliar lands, however, we are lost. Americans rarely know how small most European countries are while Europeans rarely know how far the Americas stretch from Pacific to Atlantic Oceans. Nobody knows the size of Greenland or Africa. On World Atlases Greenland appears as large as Africa, but this is false. Just look at this map:

The size of Africa on the same scale as the USA (green), Greenland (orange), and Germany (blue). Germany is about the same size as Botswana while Greenland is a tad larger than Kongo and the USA is about as big as the Sahara.

Thus North Greenland’s explorers walked distances similar to walking across Texas, Mississippi, and Florida (and back) or distances similar to walking Germany from its North Sea to the Alps (and back) or distances similar to walking across Kenya (and back). Making these maps, I found the tool at https://thetruesize.com These playful maps compare Greenland’s size by placing its shape onto North-America, Europe, and Asia:

Three explorers starved and froze to death November 1907 because they underestimated their walking area. Their shoes wore thin and they walked barefoot. Daylight disappeared and was replaced by polar night. Food vanished with no game to hunt. Jorgen Bronland, Niels Hoeg Hagen, and Ludvig Mylius-Erichsen were 29, 30, and 35 years young when they died mapping Greenland. I sailed the ice-covered coastal ocean. I was helped by maps they made walking.

Scoresby Sund – Greenland’s Longest Fjord

Fog, fog, and more fog is all we saw as we approached Scoresby Sund aboard the German research ship Maria S. Merian from Denmark Strait to the south-east. The fog lifted as soon as we passed Kap Brewster and began work on ocean currents and waters at the entrance of this massive fjord system. My artist friend and wife Dragonfly Leathrum posted a wonderful travel essay with many photos that did not include these:

We were here to explore how the coastal ocean off Greenland may relate to Daugaard-Jensen Gletscher at the head of the fjord some 360 km away (195 nautical miles or about a day of constant steaming at 8 knots). This tidewater glacier discharges as much icy mass out to sea as does Petermann Gletscher or 79N Glacier to the north or half as much as Helheim, Kangerdlugssuaq, and Jacobshavn Glaciers to the south. Unlike all those other glaciers, Daugaard-Jensen and its fjord are still largely unexplored.

Location Map of Scoresby Sund. Kap Brewster is at bottom right while Daugaard-Jensen Gletscher 360 km away is near the top left.

Location Map of Scoresby Sund. Kap Brewster is at bottom right while Daugaard-Jensen Gletscher 360 km away is near the top left.

Part of the chart of the East Greenland coast drawn up by William Scoresby Jr. in 1822, showing the numerous features that he names in Liverpool land (Liverpool Coast) and adjacent areas. From: Scoresby (1823)

Part of the chart of the East Greenland coast drawn up by William Scoresby Jr. in 1822, showing the numerous features that he names in Liverpool land (Liverpool Coast) and adjacent areas. From: Scoresby (1823)

While the entrance between Kap Tobin and Kap Brewster was known to whalers in the early 19th century, it was William Scoresby Sr. after whom the fjord is named. His scientist son William Scoresby Jr. mapped coastal Greenland between 69.5 and 71.5 North latitude during his last voyage in 1822. Nobody entered the fjord until 1891 when Lt. Carl Ryder of the Danish Navy sailed deep into the fjord to explore the area for a year with 10 companions. They built a hut next to a natural port that they named Hekla Harbor. Amazingly, they also measured ocean temperature profiles almost every month from the surface to 400 m depth. I found these data at the National Ocean Data Center of the United States Government.

Ocean temperature (left panel) and salinity (right panel) as it varies with depth in different years. Blue represents measurements from 1891/92, red from 1990, and black from 2018.

Ocean temperature (left panel) and salinity (right panel) as it varies with depth in different years. Blue represents measurements from 1891/92, red from 1990, and black from 2018.

Searching for data from Scoresby Sund, I found 17 profiles of water temperature with data from at least 10 depths. Funny that 12 of these profiles were collected in 1891 and 1892 while the other 5 profile contain salinity measurements made in 1933, 1984, 1985, 1988, and 2002. The 1988 cast was taken by an Icelandic vessel and also contained continous data from a modern electronic sensor rather than waters collected by bottles. I “found” another 4 modern sensor profiles collected in 1990 at the Alfred-Wegener Institute in Germany.

That’s pretty much “it” … until we entered the fjord in 2018 when we collected another 27 casts thus more than doubling the ocean profiles. More exciting, though, is the very large shift in ocean temperatures from 1990 to 2018. The 1990 temperatures are very similar to the 1891/92 temperatures, but all old temperatures (also from 1933 and 1985, not shown) are all about 1 degree Celsius (2 degrees Fahrenheit) cooler than those we measured in 2018. Why is this so? Does such warming originate from outside the fjord? If so, how does the warmer Atlantic water at depth in deep water crosses the 80 km wide shallow continental shelf to enter Scoresby Sund? Are any of these ideas supported by actual data? What data are there?

Ocean data location off eastern Greenland collected from 1890 to 2010 that reside in NODC archives. Red are water bottle data while yellow are modern electronic sensor measurements. The white box bottom left is the entrance to Scoresby Sund. Light blue areas are water less than 500 m deep while dark blue shades are deeper than 1000 m.

Ocean data location off eastern Greenland collected from 1890 to 2010 that reside in NODC archives. Red are water bottle data while yellow are modern electronic sensor measurements. The white box bottom left is the entrance to Scoresby Sund. Light blue areas are water less than 500 m deep while dark blue shades are deeper than 1000 m.

Discoveries in science can be pretty basic, if one is at the right location at the right time with the right idea. Also, there is more data to the south that I did not yet look at to investigate the question of what causes the warming of bottom waters in Scoresby Sund.

EDIT Dec.-31, 2019: Replace “warmer” with “cooler” when comparing 1891 and 1990 (cooler) to 2018 (warmer) water temperatures.

Petermann Glacier & Videos & Science

I just re-discovered four stunning science videos from the last expedition to reach Petermann Gletscher in Greenland. Each video is 3-6 minutes long and was made professionally by Saskia Madlener of 77th Parallel Productions with partial support from the US National Science Foundation. They were first posted at

https://petermannsglacialhistory.wordpress.com/videos/

and relate to a joint 2015 US-Swedish Expedition. The project involved diverse groups of geological, physical, biological, and chemical scientists from Sweden, England, Scotland, Denmark, Germany, Canada, and the USA who all worked together aboard the Swedish icebreaker Oden for 6 weeks. [For full resolution HD video click on the Vimeo icon in the video.]

Petermann Glacier 2015 – Overview from 77th Parallel on Vimeo.

Petermann Glacier 2015 – Ocean & Ice from 77th Parallel on Vimeo.

Petermann Glacier 2015 – Rocks & Shells from 77th Parallel on Vimeo.

Petermann Glacier 2015 – Expedition from 77th Parallel on Vimeo.

What’s happened at Petermann Gletscher since the Industrial Revolution 150 years ago?

More than 15 years ago I first set sight on the floating Petermann Gletscher when the United States’ Coast Guard Cutter Healy visited north-west Greenland for the first time on 10th August of 2003. We only had to sail 20 km into the fjord to reach a flat expanse of glacier ice that stuck less than 5 m (15 feet) above the sea. In 2012 and 2015 we had to sail another 20 km, because two large calving events had shortened the glacier farther back than it has since first records were kept in 1876. The terminus was also much higher, almost 25 m (75 feet) above the sea:

DSCN4444

Terminus of Petermann Gletscher 5th August 2015 from aboard the Swedish icebreaker Oden. View is to the south-east. [Photo Credit: Andreas Muenchow]

I published more detailed results on observed glacier change and estimated melt rates with Drs. Laurie Padman and Helen Fricker in the Journal of Glaciology from which I take these two figures:

Muenchow2014_01

Petermann Gletscher’s two large calving events in 2010 and 2012 as seen from MODIS satellite. The glacier is floating on the ocean seaward of the grounding line indicated by the thick black line. Black areas are open ocean water, white is ice. Adapted from Muenchow et al., 2014.

Muenchow2014_02

Time series from 1876 to 2014 of the length of Petermann Gletscher as measured from its grounding line at y=0 km. Triangles are observations while lines indicate a steady 1 km per year advance. The insert shows three maps of observed glacier shapes. From Muenchow et al., 2014.

Back in 2003 the glacier advanced about 1 km each year and it does so still. Almost the same, but not exactly, because the removal of 6 “Manhattans” in 2010 and 2012 increased the forward speed some, that is, the glacier now moves faster forward than it did before. Many sensors placed on the glacier measured this speeding, but the glacier also gets thinner as it speeds up. It is stretched thin. I published this back in 2016 together with Drs. Laurie Padman, Keith Nicholls, and my PhD student Peter Washam in Oceanography:

Muenchow2016_03

Speed at which Petermann Gletscher moves out into the sea from many different measurements. The glacier moves more slowly over land (negative distances) than it does floating over the ocean (positive distances). Estimates made after 2012 are about 10-20 % higher than RADARSAT estimates before that date. From Muenchow et al., 2016.

With substantial help from the British Antarctic Survey we installed in 2015 a small ocean observing system under the floating glacier. It transmitted data from 800 meters (2400 feet) below the 100 m (300 feet) thick glacier ice via cables connected to a weather station. We sucessfully repaired the station (as well as a Danish weather station nearby) that stopped transmitting data via satellites in 2016. Two journalists of the Washington Post, Chris Mooney and Whitney Shefte joined Keith Nicholls and myself. Their outstanding and accurate reporting of our work includes video and graphics for a wider audience that you can find at this link:

Washington Post Video of 2016 Petermann Gletscher Site Visit

The ocean and glacier data were worked over carefully by Peter Washam who defended his dissertation last month. Dr. Washam moved to Georgia Tech in Atlanta to work with Dr. Britney Schmidt whose interests relate to the ice-covered oceans below some moons of Jupiter. Peter connected ocean temperature and salinity with ice radar and remote sensing data to estimate how much the glacier is melted by the ocean and how the ocean does this. His main result will be published later this year in the Journal of Glaciology [Added July-12, 2019: Published online as Washam et al., 2019 at the Journal of Glaciology.], that is

“… This increase in basal melt rates confirms the direct link between summer atmospheric warming around Greenland and enhanced ocean-forced melting of its remaining ice shelves. We attribute this enhanced melting to increased discharge of subglacial runoff into the ocean at the grounding line, which strengthens under-ice currents and drives a greater ocean heat flux toward the ice base…”

The next large calving will be no surprise: Large fractures cross much of the glacier. They are visible about 10-20 km behind the current terminus and are discussed and closely monitored almost every day at the excellent site of Greenland Enthusiasts from all walks of life who post at

https://forum.arctic-sea-ice.net/index.php/topic,53.600.html

Furthermore, a new sophisticated computer model of Petermann Gletscher reveals that the loss of this large “still attached” ice island is already gone from the glacier in terms of the friction that it provides along the sidewalls. Another way of putting this, all it takes is a little wiggle or bump and the separation will become visible. Dr. Martin Rueckamp just published this study in the Journal of Geophysical Research.

There is much more to be explored with regard to Petermann. Here are some of the readings and writings that I have done with many fellow sailors through uncertain climates:

Johnson, H.L., A. Muenchow, K.K. Falkner, and H. Melling: Ocean circulation and properties in Petermann Fjord, Greenland. Journal of Geophysical Research, 116, doi:10.1029/2010JC006519, 2011. .pdf

Muenchow, A., L. Padman, and H.A. Fricker: Interannual changes of the floating ice shelf of Petermann Gletscher, North Greenland, from 2000 to 2012 Journal of Glaciology, 60, doi:10.3189/2014JoG13J135, 2014. .pdf

Muenchow, A., L. Padman, P. Washam, and K.W. Nicholls, 2016: The ice shelf of Petermann Gletscher, North Greenland and its connection to the Arctic and Atlantic Oceans, Oceanography, 29, 84-95, 2016. .pdf

Rueckamp, M, N. Neckel, S. Berger, A. Humbert, and V. Helm: Calving induced speed-up of Petermann Glacier, Journal of Geophysical Research, 124, 216-228, 2019. .pdf

Shroyer, E., L. Padman, R. Samelson, A. Muenchow, and L. Stearns: Seasonal control of Petermann Gletscher ice-shelf melt by the ocean’s response to sea-ice cover in Nares Strait, Journal of Glaciology, 63, doi:10.1017/jog.2016.140, 2017. .pdf

Washam, P., A. Muenchow, and K.W. Nicholls: A decade of ocean changes impacting the ice shelf of Petermann Gletscher, Greenland, Journal of Physical Oceanography, 48, 2477-2493, 2018. source

Washam, P., K.W. Nicholls, A. Muenchow, and L. Padman: Summer surface melt thins Petermann Gletscher ice shelf by enhancing channelized basal melt, Journal of Glaciology, 65, doi:10.1017/jog.2019.43, 2019. .pdf

How to whisper under sea ice: Wireless Acoustic Sensor Network Design

I want to build a cell phone system under water. I want it to send me a text messages every 30 minutes from 200 feet below the ocean that is covered by sea ice next to a glacier in northern Greenland where polar bears roam to catch seals for food at -40 Fahrenheit. Why would I want to do this and is this is even possible?

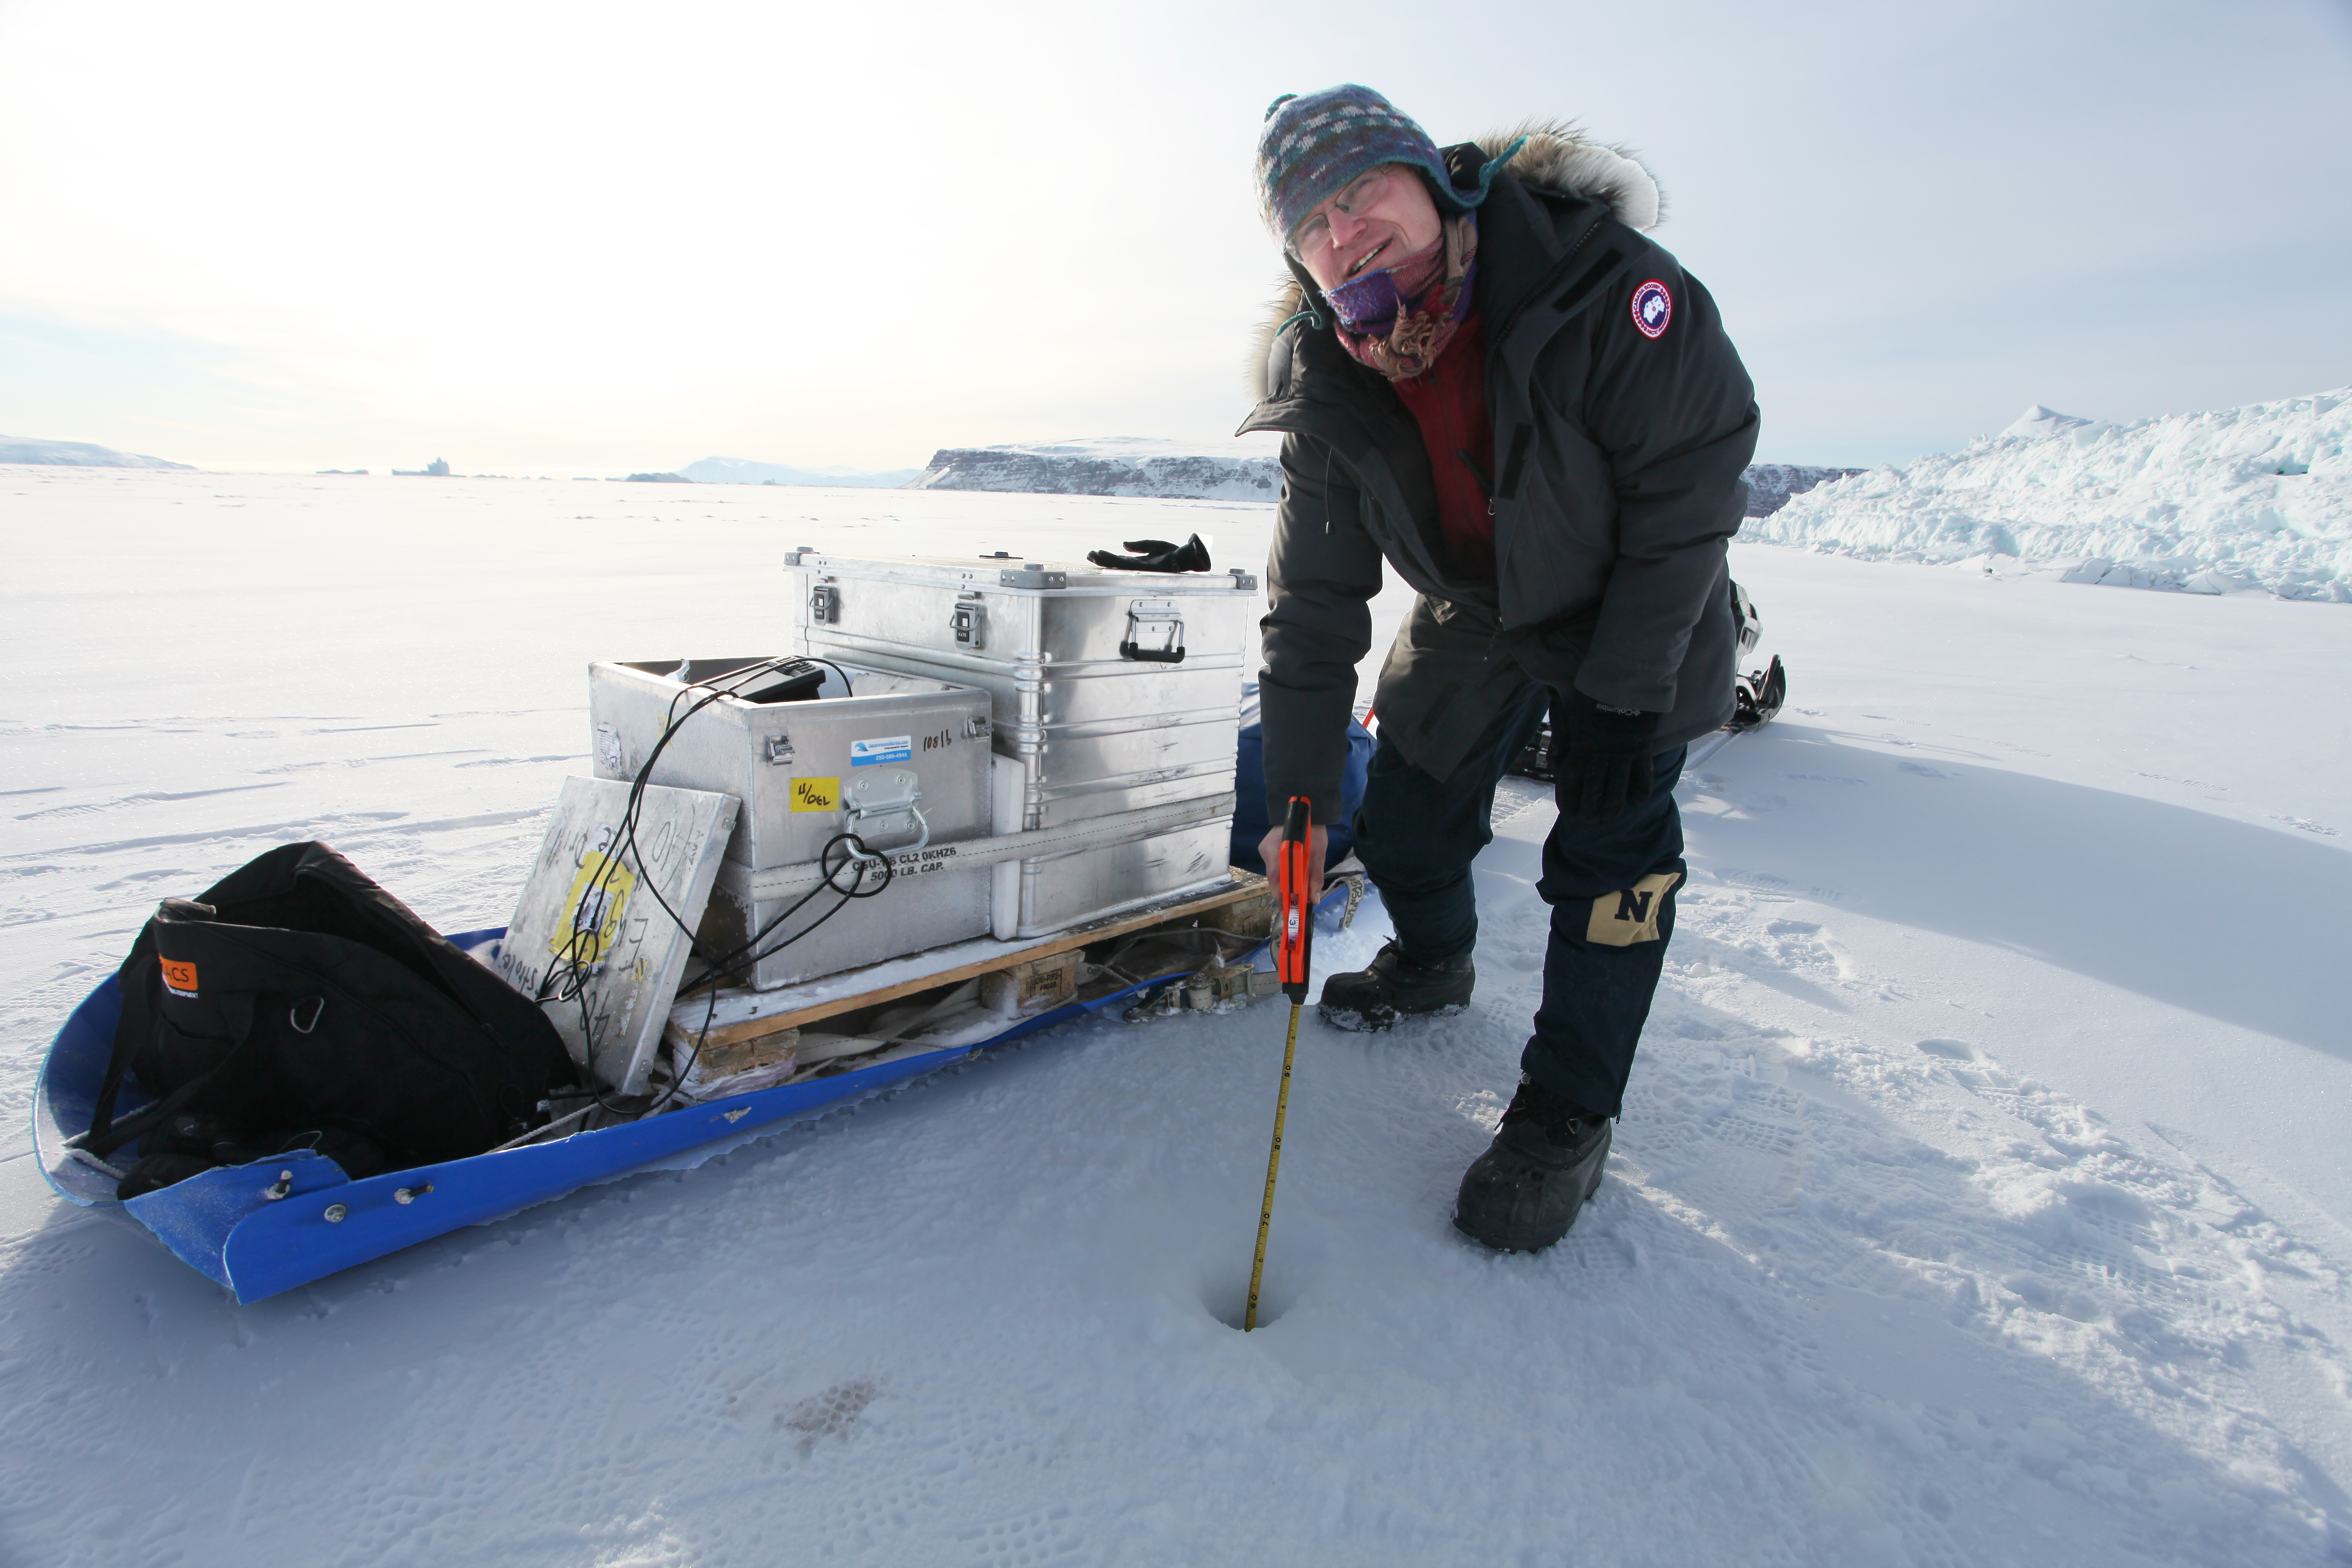
The author measuring sea ice thickness in Wolstenholme Fjord, Greenland April-17, 2017.

The author measuring sea ice thickness in Wolstenholme Fjord, Greenland April-17, 2017.

Our project successfully showed that it is possible to move data as text messages from a computer in the ocean to another and on to another and then via a cable to a weather station and then on to a satellite and then on to my laptop at home somewhere, anywhere, really [Intellectual Merit]. The ocean data that we moved by whispering from modem to modem (my acoustic cell phone towers) under water can be anything that any scientist may want to study. It could, for example, detect pollutants in the water that seep out of the sediment like gas or oil or radioactive materials burried accidentally [Broader Impacts] such as a nuclear-tipped B-52 bomber that crashed into Wolstenholme Fjord on January-21, 1968 at the height of the Cold War. The propagation of sound under ice also has military applications, because our communication network operates in both ways, that is, if I can receive a text message, I can also send one [Broader Impacts].

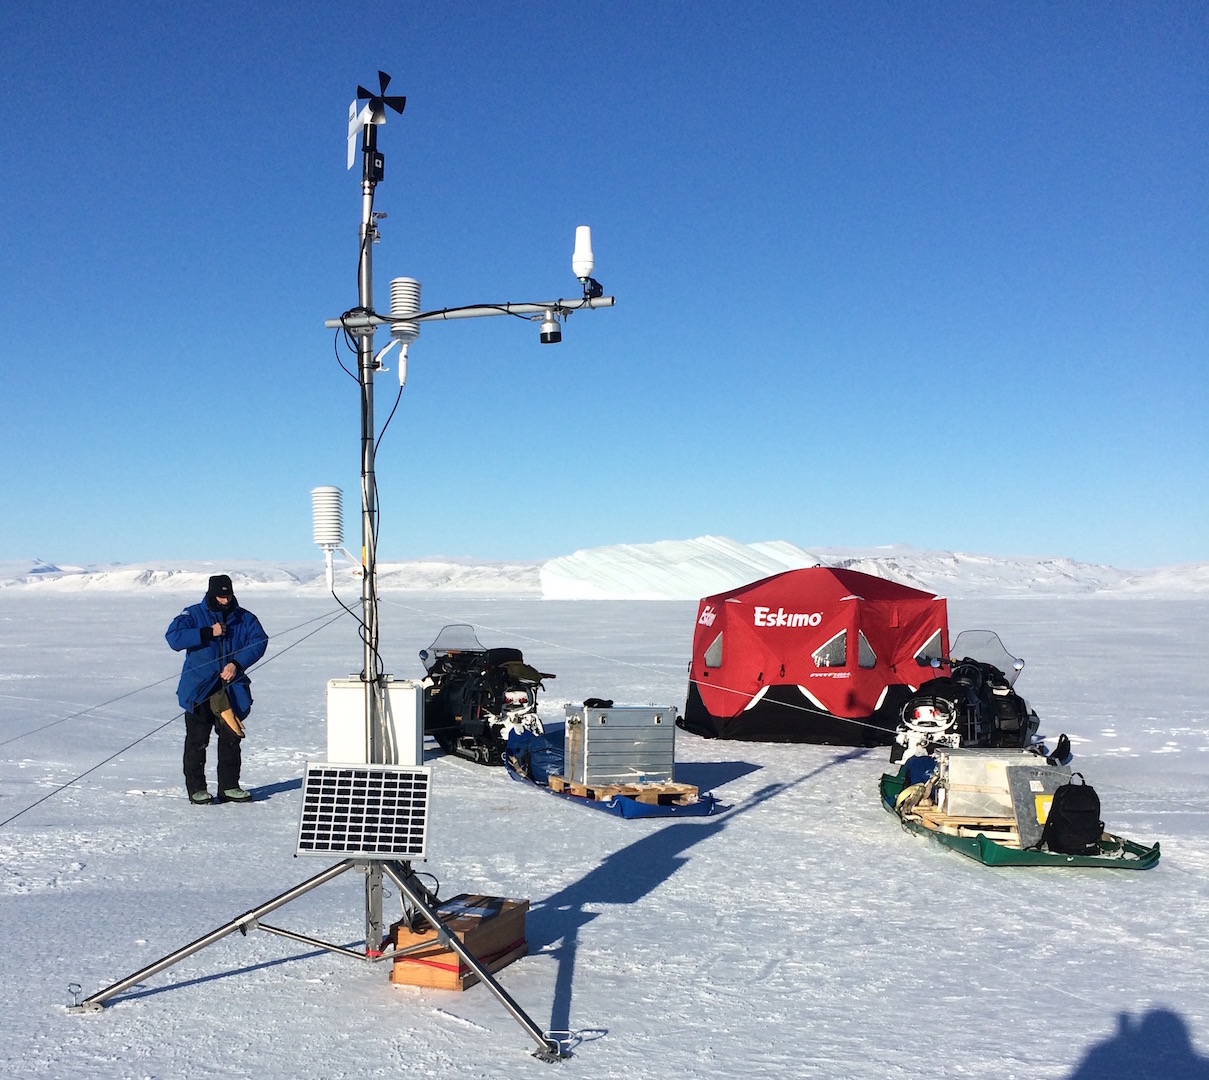
Installation of Automated Weather Station on Mar.-23, 2017 near Thule, Greenland via snowmobile. The station includes a satellite connection to the internet and a cable to the ocean.

Installation of Automated Weather Station on Mar.-23, 2017 near Thule, Greenland via snowmobile. The station includes a satellite connection to the internet and a cable to the ocean.

While the problem sounds simple enough, it is hard, real hard, because it requires many different people with very different skill sets. Our project included mechanical, electrical, and computer engineers but also scientists who know about acoustics, oceanography, and sea ice, as well as technicians with common sense and practical abilities to keep machines and people moving and running safely. This includes guns that we had to carry while working on the sea ice via snowmobile to protect from polar bears and medically trained personnel who could spot frostbites before they bite. All of this has to come together in just the right way and right time. Good and successful science is more than just engineering and machines, there is a strong human element in all polar field work such as ours. 

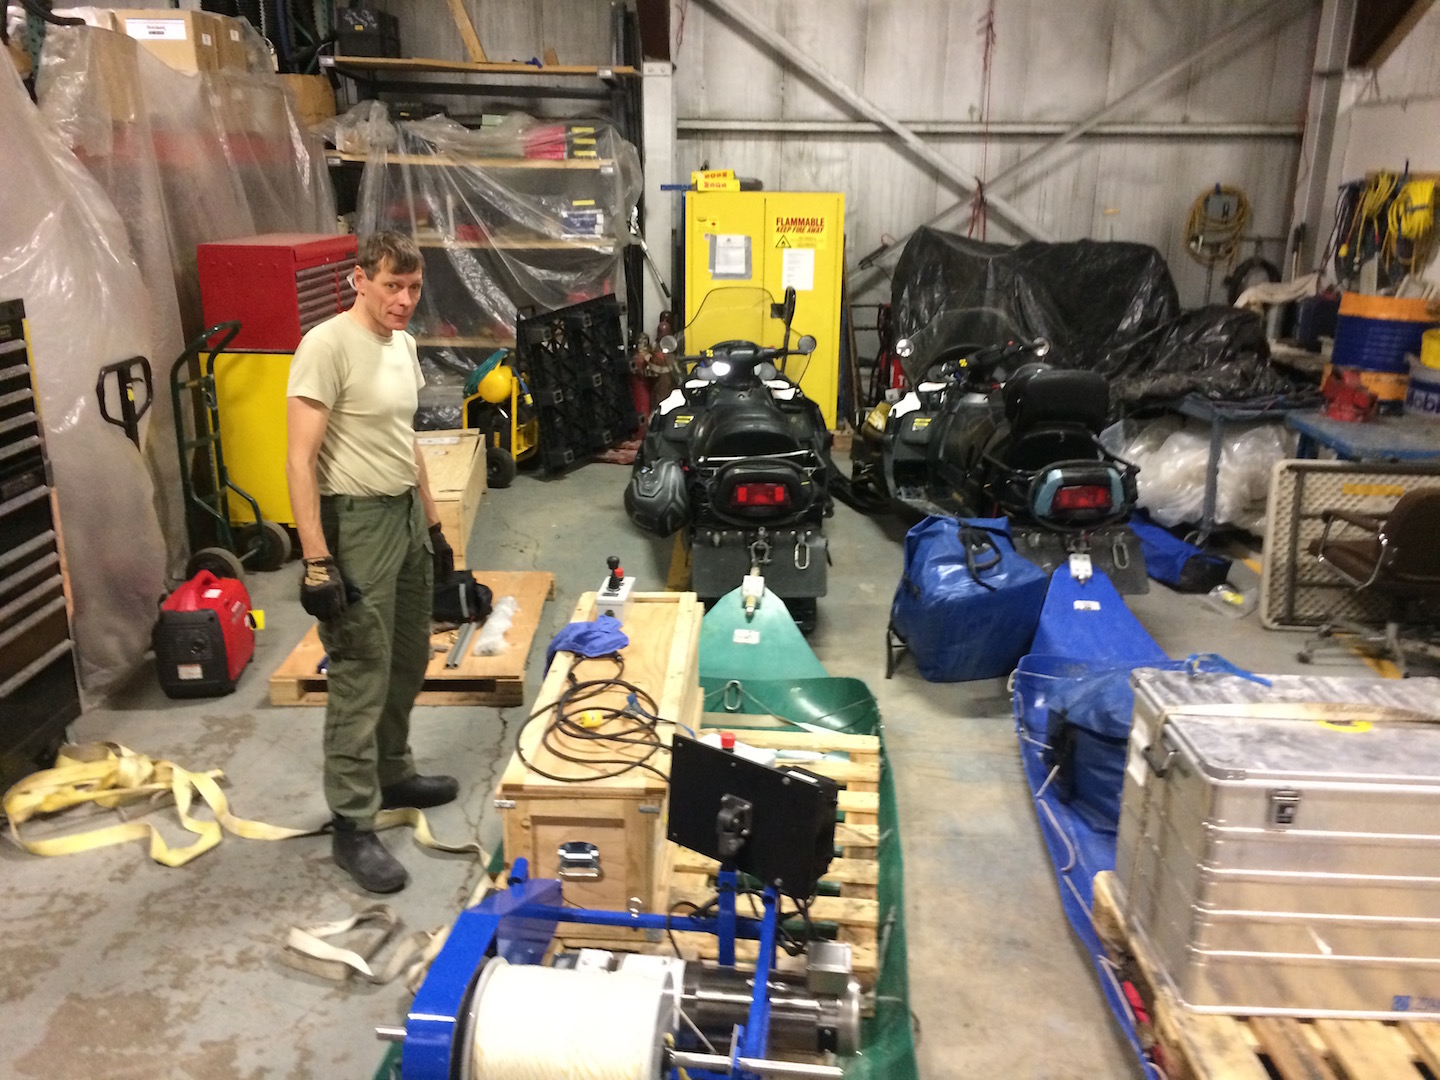
A local volunteer is designing, building, and rigging the Research Sled R/S Peter Freuchen for profiling the ocean below the sea ice in March 2017 on Thule Air Base.

A local volunteer is designing, building, and rigging the Research Sled R/S Peter Freuchen for profiling the ocean below the sea ice in March 2017 on Thule Air Base.

The first step in our project involved the design of the acoustic modems that Lee Freitag of Woods Hole Oceanographic Institution did many years back. It took us about 2 years to select this design that Lee then modified for this application in 2014-15). The second step involved the selection of a study site where our small group of 6 people could work and experiment and learn by some trial and error without incurring extra-ordinary costs (2015-16). It helped that I was in and out of Thule Air Base on unrelated projects in 2015 and 2016 when we settled for the final experiment to take place in March and April of 2017. Satellite remote sensing tools where then developed to quantify sea ice conditions for safe operation and navigation traveling on the  ice. We uncovered a barely visible area of thin ice to the south of Manson Island that recurs at the same location every year. We stayed clear of this area.

Thule2017_CTD

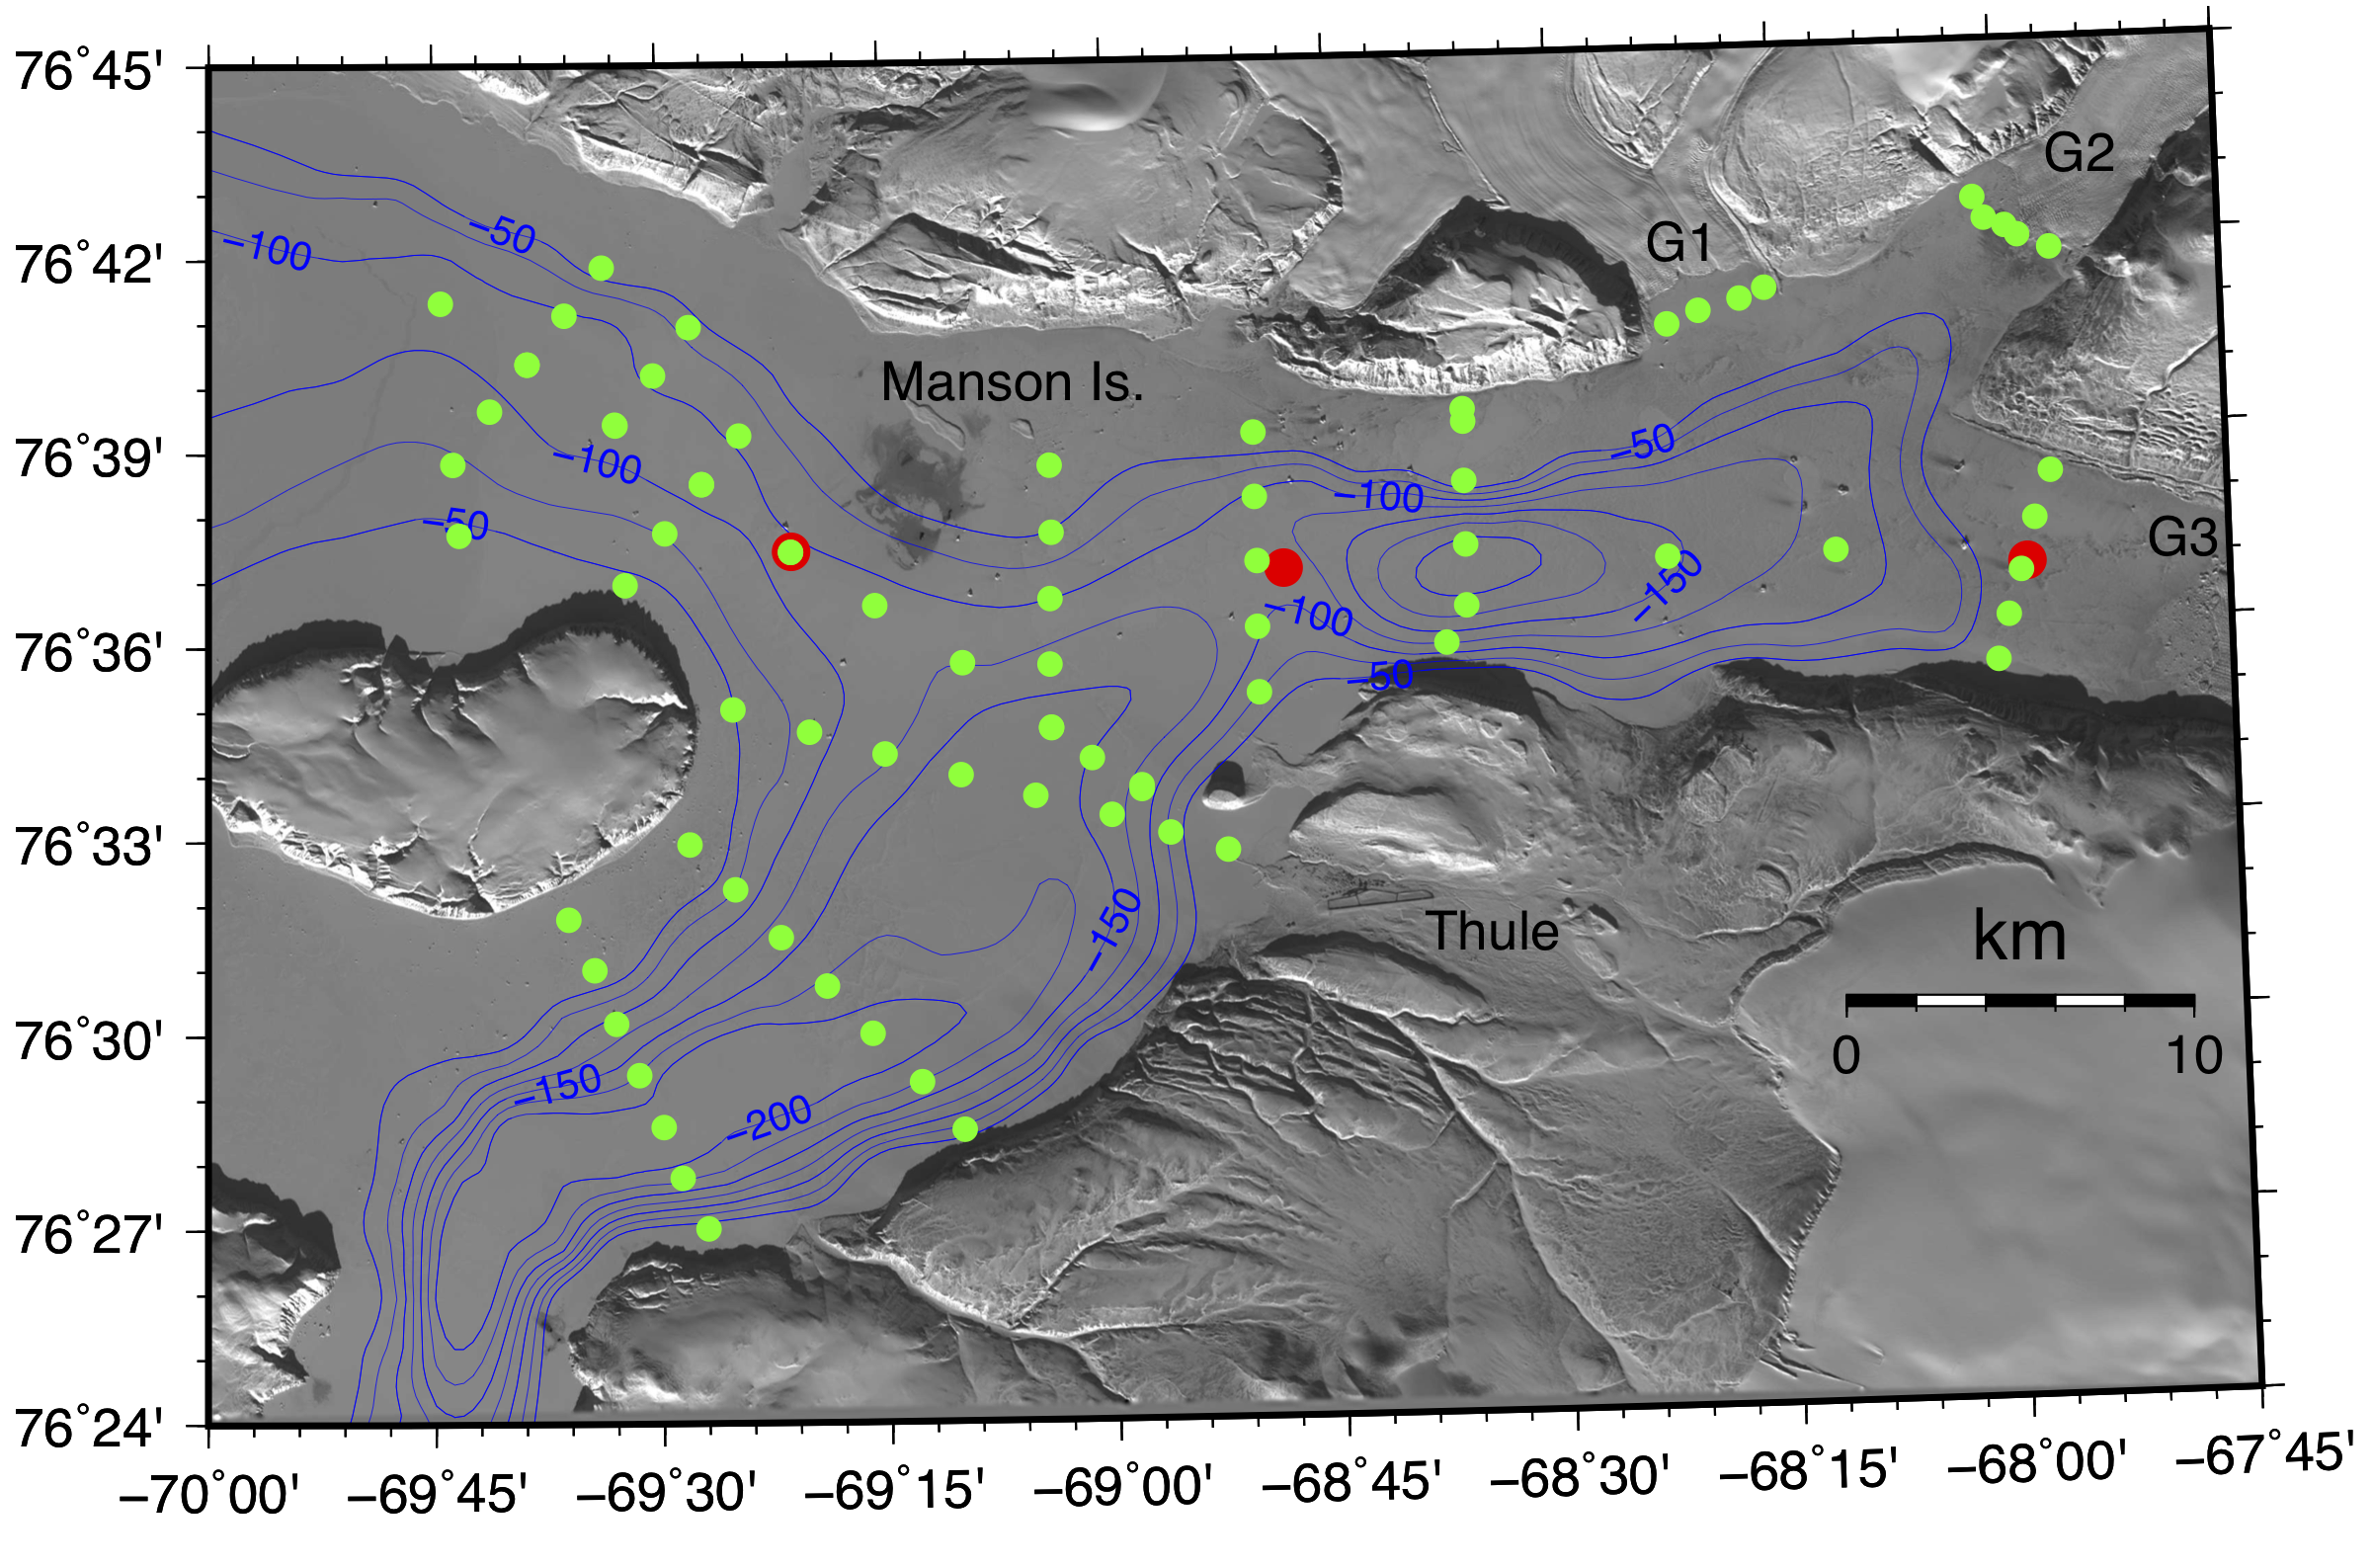
Satellite image of ice-covered Wolstenholme Fjord, Greenland with water column profiling station (green dots) and acoustic modems (red dots). Blue lines are water depths in meters. Labels G1, G2, and G3 indicate three tide-water glaciers while Thule refers to Thule Air Base. Saunders Island is near the center left while the weather station is the red dot halfway between Saunders and Manson Islands.

Field work started with a survey of sea ice thickness on Mar. 18/19, 2017 by drilling 2” holes through the sea ice that varied in measured thickness from 0.12 m (4 inches) near Manson Island to 1.25 m (4 feet) near Thule Air Base. On Mar.-23, 2017 we deployed the weather station along with a tent and survival gear at the center of our study area. An ocean temperature mooring was deployed to complement in time a spatial survey of ocean sound speed profiles estimated from conductivity, temperature, depth (CTD) measurements. We drilled 10” holes through the sea ice for our profiling CTD operated via an electrical winch. Our CTD survey spanned the entire fjord from three tidewater glaciers in the east to the edge of the sea ice in the west. Concurrently ocean testing of acoustic communication between modems commenced Apr.-8, 2017 and the final array was deployed Apr.-14/15 to be fully operational Apr.-16/18. All gear was recovered and stored at Thule Air Base Apr.-18/19, 2017 before our departure Apr.-20, 2017.

Research Sled

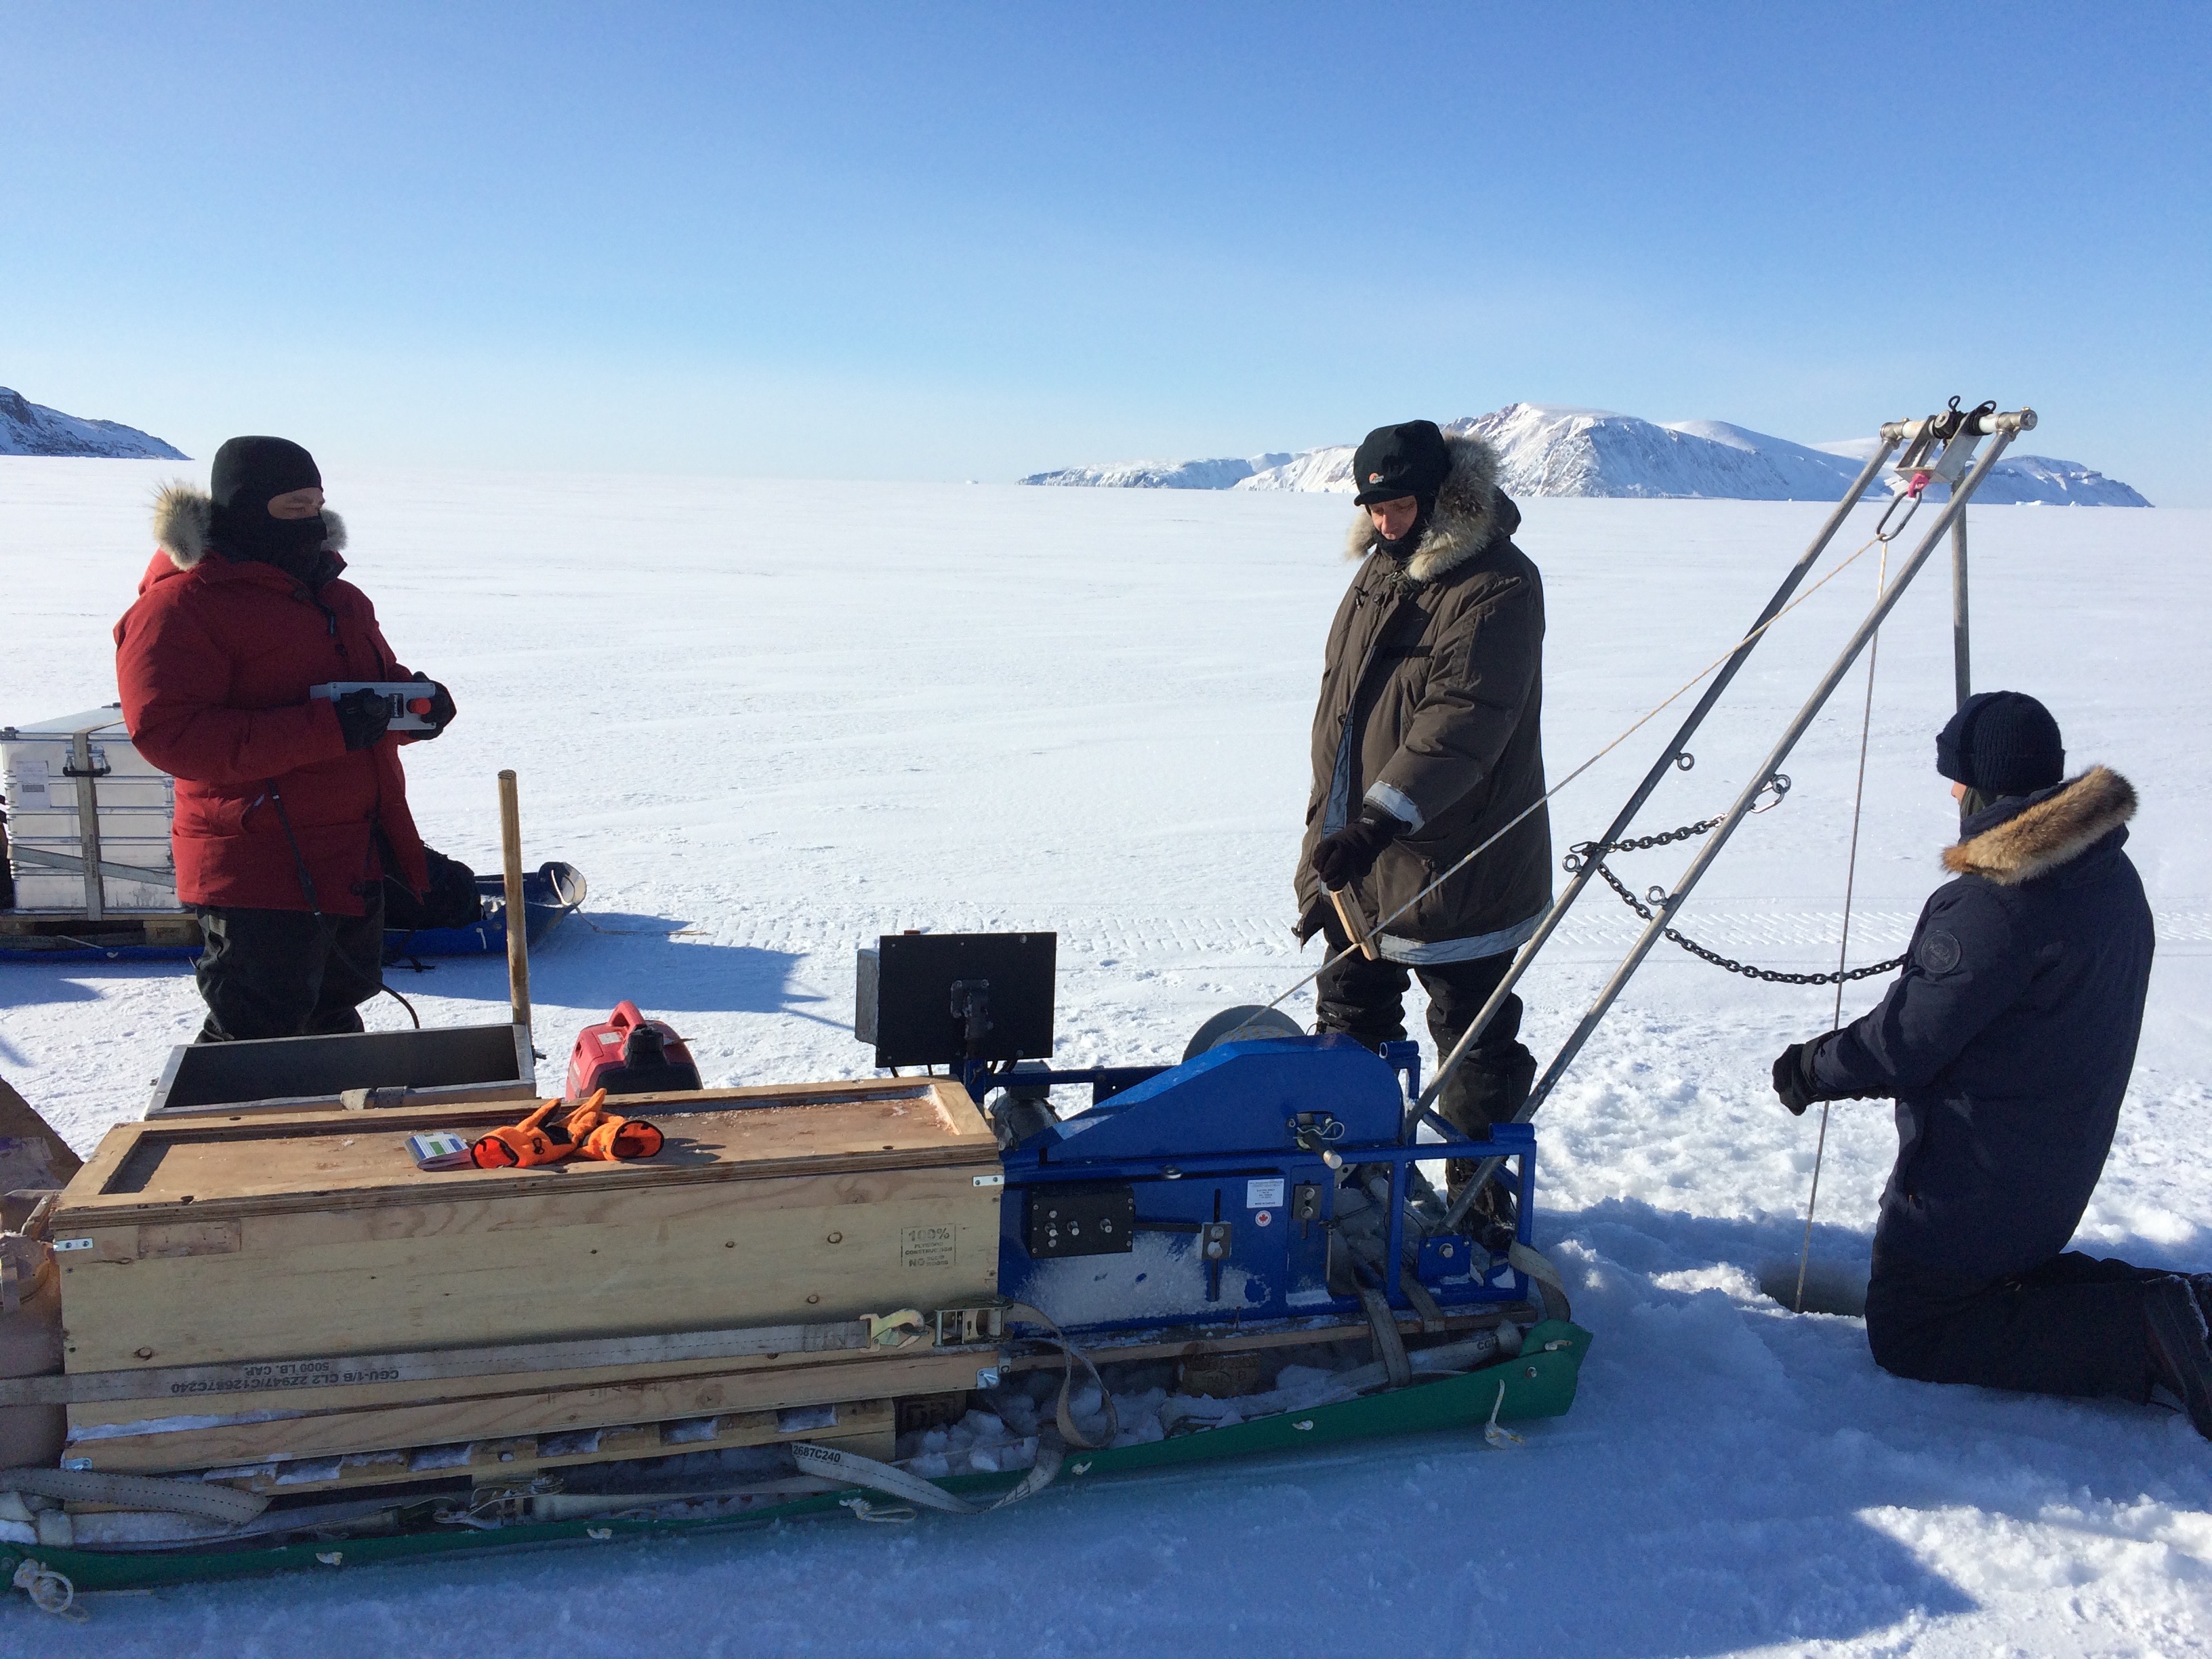
Research Sled “Peter Freuchen” with wooden CTD storage box, electrical winch, tripod, and electrical motor during deployment on Apr.-7, 2017. View is to the west with Cape Atholl on the left and Wolstenholme Island on the right background. University of Delaware technician operates the winch via joy stick while a student monitors the instrument’s descent through water column visually at the 10” hole and acoustically via a commercial Fish-Finding sonar.

Subsequent analysis in 2017/18 revealed a successful experiment as data from ocean sensors traveled along multiple paths to the weather station and on to the internet. All data were submitted to the NSF Arctic Data Center where after review they will become public at

https://arcticdata.io/catalog/view/urn:uuid:d2775281-3231-47d0-ab79-b2e506ea8d04

This graph is just one of many in desperate need of a proper peer-reviewed publication. There is always more work to do …

Time series of ocean temperature at the weather station from 10-m (top) to 100-m (bottom below the sea ice. The red line gives the -1.7 Celsius for reference. The temperature field dominates the speed of sound field. Note the presence and absence of tidal oscillations.

Time series of ocean temperature at the weather station from 10-m (top) to 100-m (bottom below the sea ice. The red line gives the -1.7 Celsius for reference. The temperature field dominates the speed of sound field. Note the presence and absence of tidal oscillations.