My President Donald J. Trump threatens to take Greenland and does not rule out force to do so. A conflict emerges between the current United States’ administration and the people of Greenland and Denmark. My loyalities as an American citizen lie with the U.S. Constitution and the people of Denmark and Greenland. I worry about my government’s malicious incompetence when it interacts with friends and allies of more than 100 years such as Denmark. This tiny NATO country (half the size of South Carolina) of 6 million people (like Wisconsin or Minnesota) supported us during our 20-year long war in Afghanistan. Their price in blood (people killed) was as high as ours relative to their population [Source]. Hence I consider the statement of my current Secretary of Defence Pete Hegseth malicious, incompetent, and shameful when he responds to my Vice-President J.D. Vance that “… I fully share your loathing of the European free-loading. It’s PATHETIC …” [his caps, not mine].
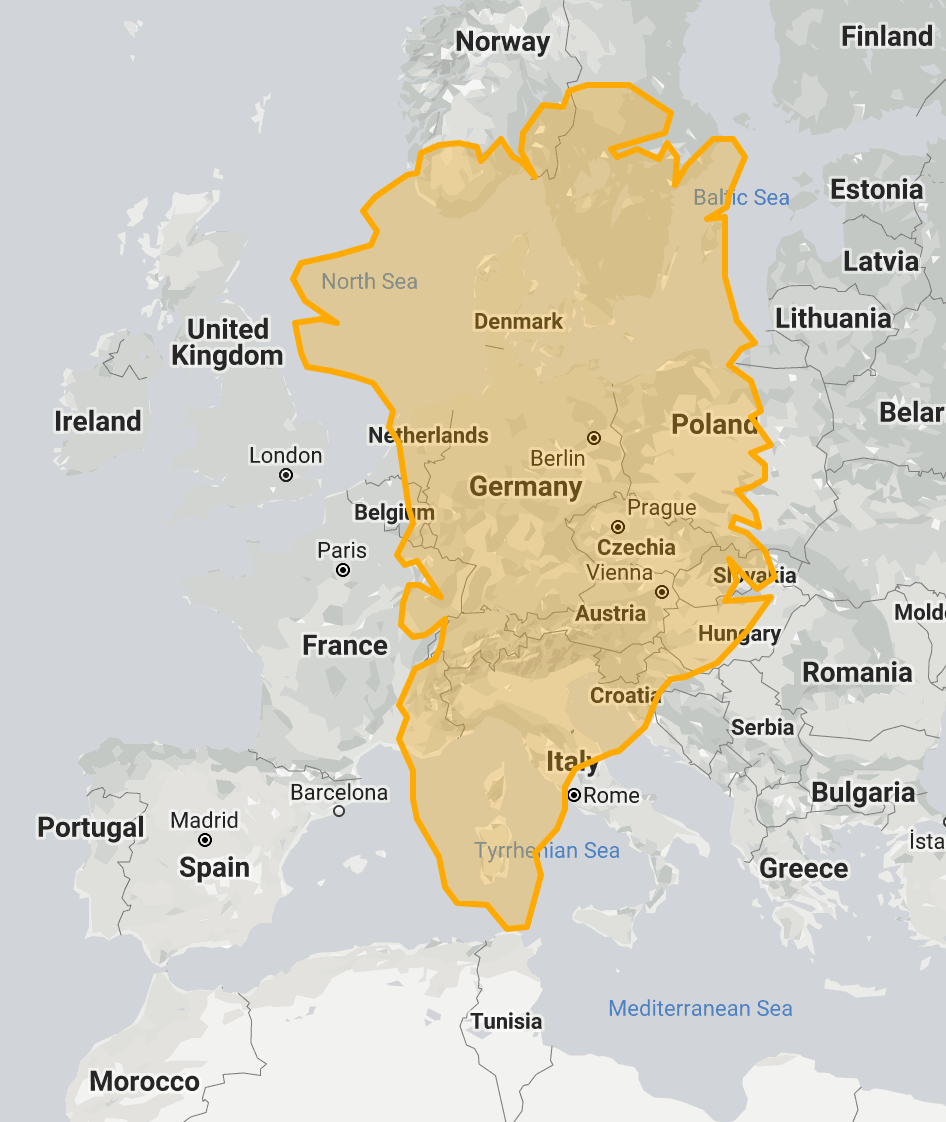
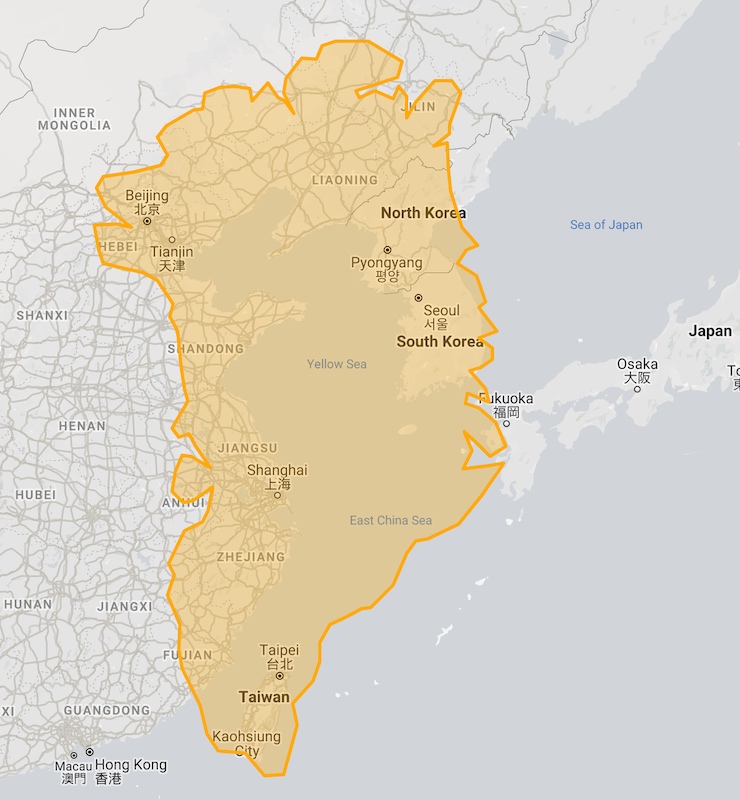
Greenland to scale over USA (left), Europe (center), and Asia (right).
Greenland is large, but only 55,000 people live there. Its northern reaches have been mapped only about 100 years ago by small groups of Danish explorers, scientists, and Inuit hunters moving by dog-sleds. Some died, but most survived. Even today, the Danish military patrols the northern reaches by dog sleds and satellite phones. These Sirius patrols consist of six teams of 2 Special Forces soldiers each who cover an area about the size of New England without encountering another person during months of steady traveling.
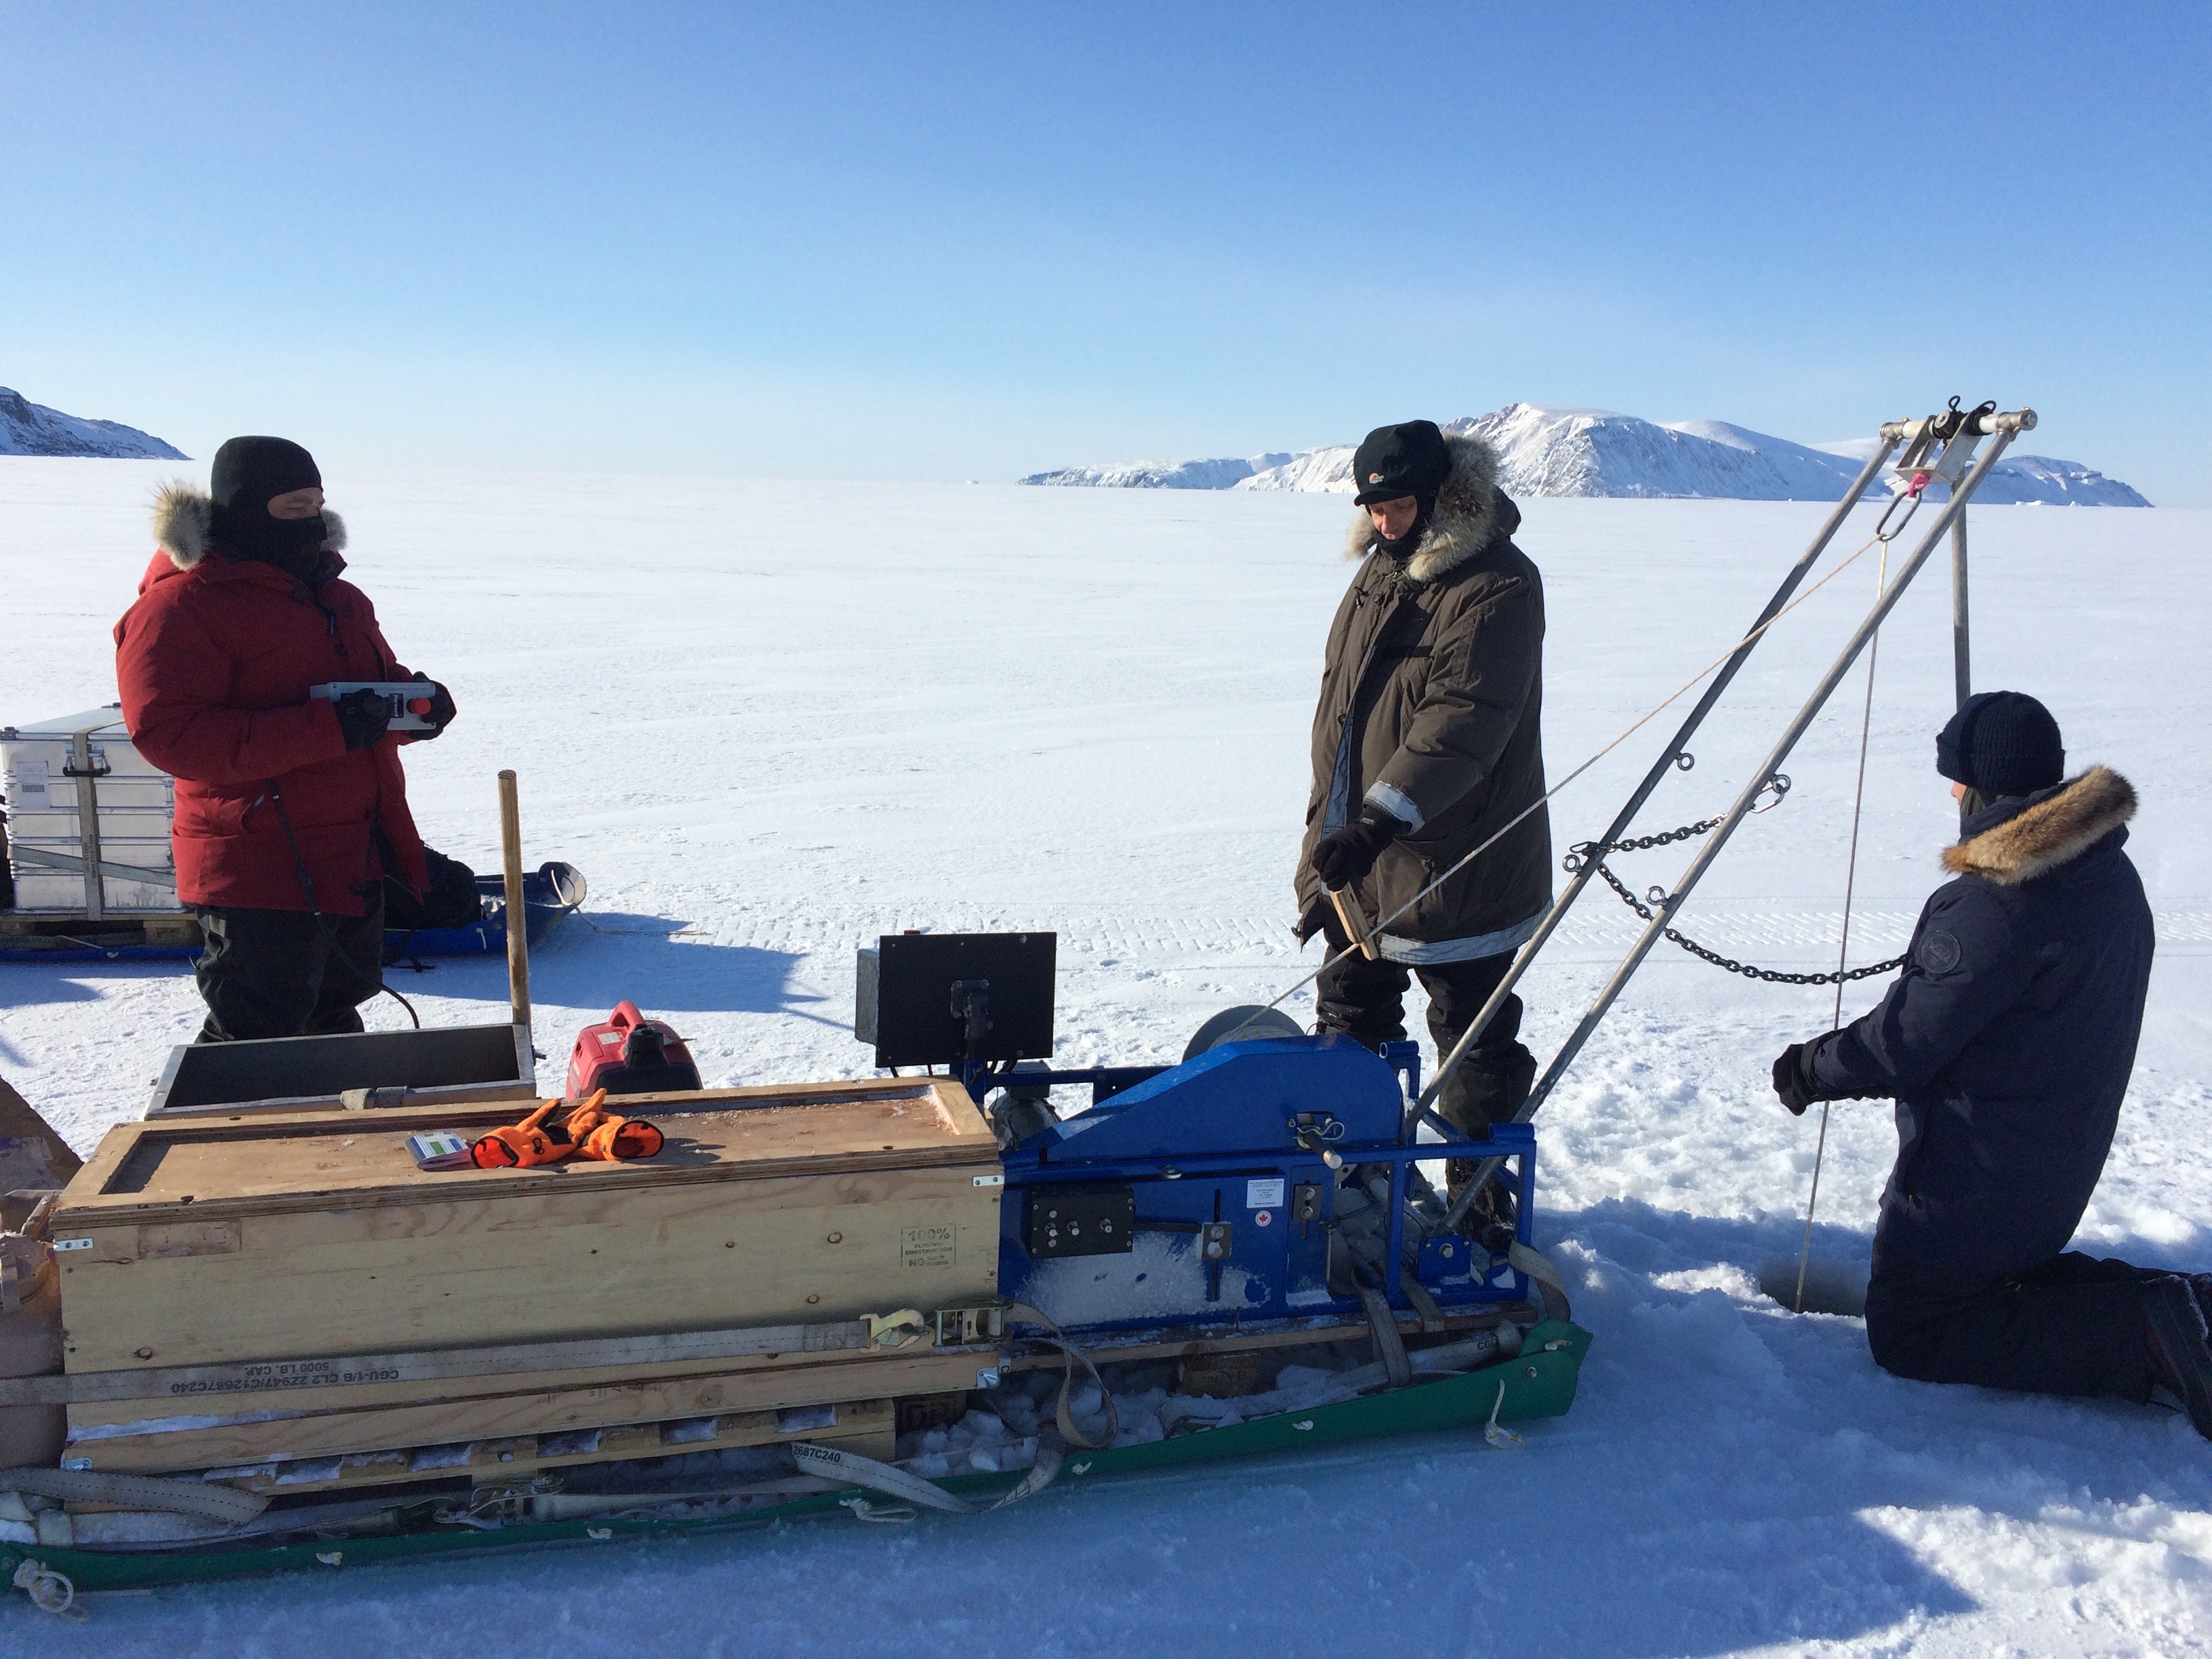
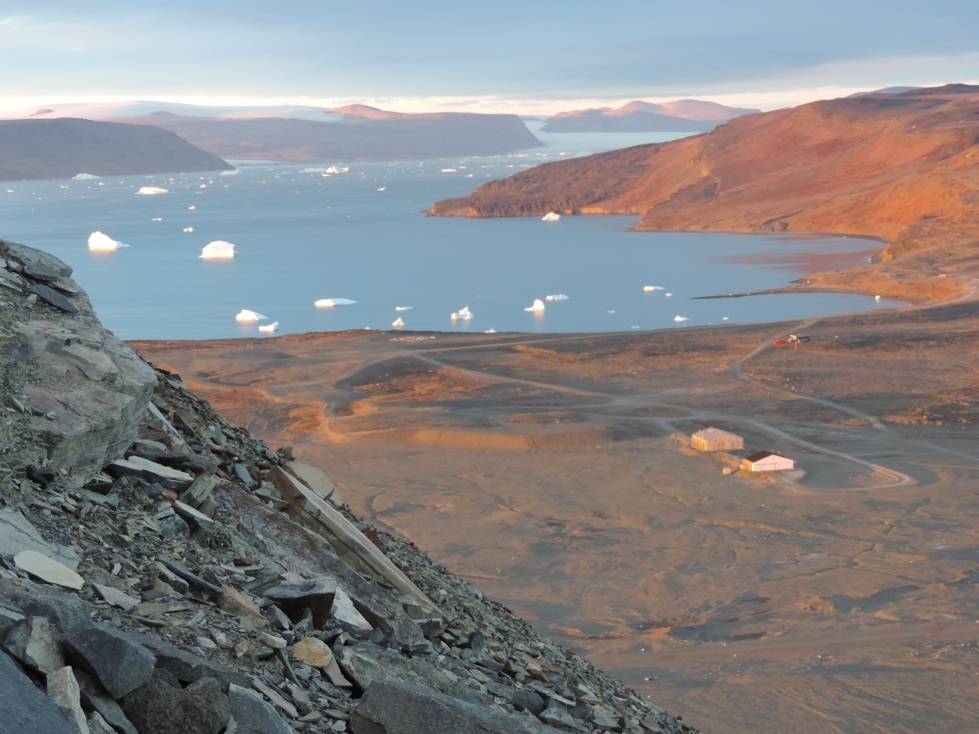
I traveled to Greenland 1997, 2003, 2005, 2006, 2007, 2012, 2014, 2015, 2016, 2017, 2018, 2021 and, hopefully, again in 2025. As a polar scientist my work relates to the physics of oceans and glaciers. All this work involves ships and people from the United States of America as well as Canada, Germany, Sweden, and Denmark. So I spent about 12 months of my life on ships in the coastal waters of Greenland, but in 2017 I also lived for 6 weeks at Thule Air Base which is now called Pituffik Space Base. We then surveyed the coastal waters and glaciers via daily snowmobile trips on the 1-3 feet thick sea ice. I met Inuit hunters both on the sea ice working and on base visiting. I met Danish Soldiers in Thule/Pituffik who in prior lives climbed out of the torpedo tubes of U.S. submarines and stormed beaches in Somalia and/or Yemen in joint military missions. I met Danish dentists, grocers, barristas, carpenters, policemen, cooks, electricians, and plumbers. They all support shared values of democracy, freedom, and respect for each other. They are our friends, not our enemies. They are good people, they are European, and they are not “PATHETIC” as current U.S. government officials call them.
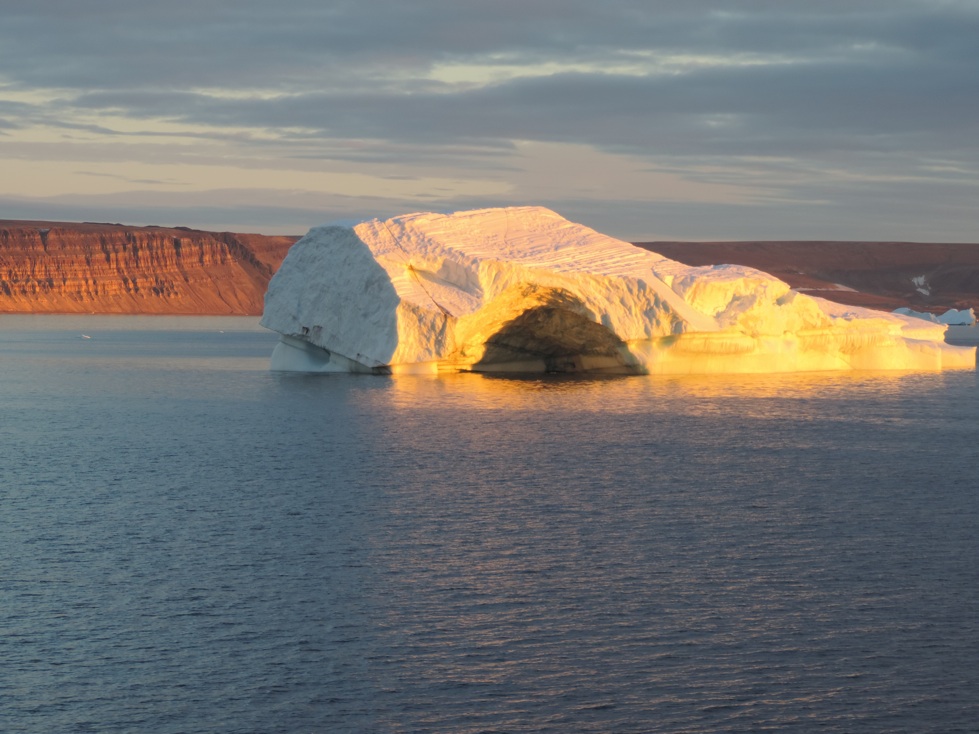
Greenland near Thule Air Base or Pituffik Space Base in the fall of 2015 and spring of 2017.
More than 400 Danes and Greenlanders operate the base such as providing heat, water, food, plumbing, snow removal, civil administration, medical services, and general repair of all things non-military. They also form the experienced backbone of the base, because most of them have worked here for 5, 10, 20, or more years. In contrast, the U.S. soldiers rotate in and out every year as did my former father-in-law when Thule housed up to 11,000 US soldiers during the Cold War.
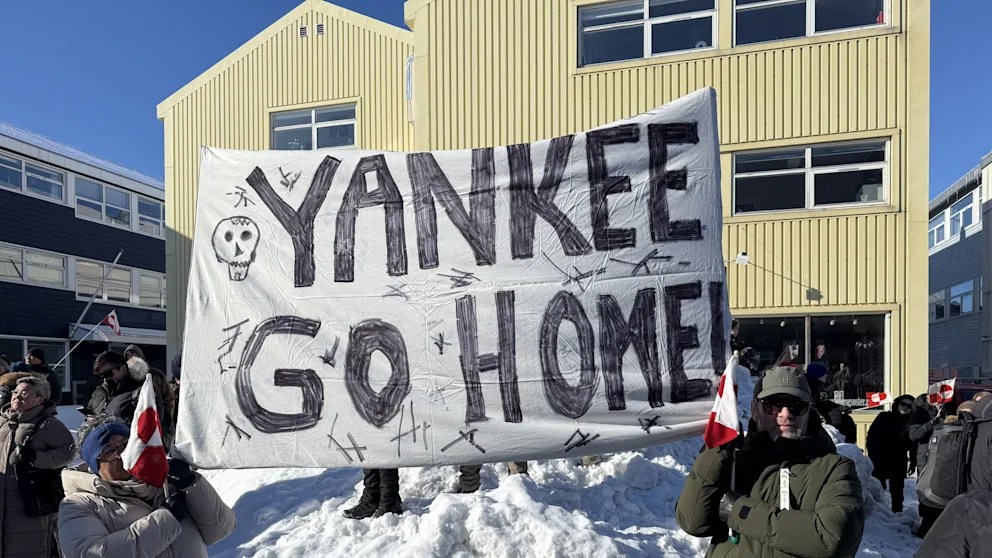
Today my Vice-President visits this Pituffik in North-West Greenland for a few hours. I do not know, but I doubt he will even spent the night where about 150 Americans operate large radar installations as well as an large airport and deep water seaport. I also doubt he, his wife, or National Security Advisors will gain understanding of people, place, or culture during their brief fly-by. They did get the firm message from the leaders of both Danish and Greenlandic governments, however, that they are not wanted. The uninvited U.S. officials changed plans and visited a remote military base at Pituffik rather than to expose themselves to Greenlanders and Danes in public at the central population center of Sisimut during a national sport’s event.
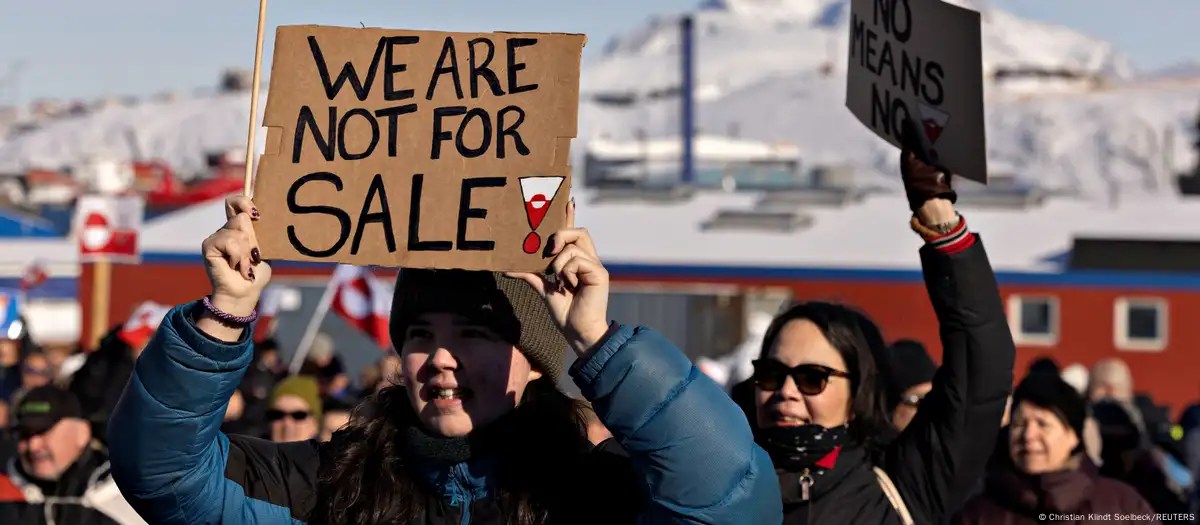
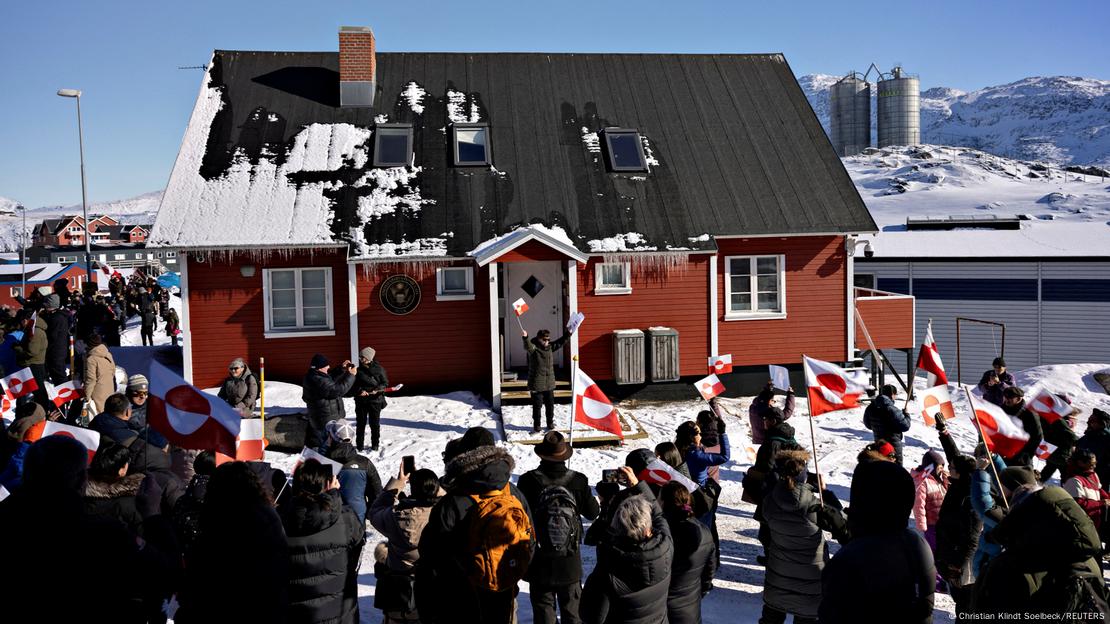
Two weeks ago almost 2% of Greenland’s population took to the streets in their capital Nuuk to expressed their views regarding their country [Source]. Relative to population, this would be the same, as if 6 million Americans would march in Washington, DC. Perhaps we need such a march to prevent the ongoing “Russification of the USA” where the malicious incompetence of my current government shreds the Law and undermines the Constitution of our United States of America.
Sleeping and camping in California’s Wilderness requires a permit. The most desired permit starts in Yosemite National Park to hike the 220 mile John Muir Trail (JMT) through Yosemite, Kings Canyon and Sequoia National Parks as well as Ansel Adams, John Muir, and Golden Trout Wilderness. This spectacular and scenic hike along the spine of the Sierra Nevada takes 3-4 weeks to complete without ever crossing a road or seeing a car. Chances to score a permit are slim (less than 1:10), so about 9 out of 10 applicants fail to win this “Golden Ticket” via a lottery. Last year I was one of the 9 and thus had to be creative, because I wanted to hike the JMT. Here is my “solution” from 2024:
My 2024 loop through Yosemite National Park. I acclimated at Mammouth Lakes (blue bus) for 2 days and took a city bus to my trailhead at Devils Postpile (blue flag). From there I hiked north to Yosemite Village via Donahue Pass along 8 campsites (red tents). This was my first permit. The second permit carried me from Yosemite Village via Red Peak Pass and Isberg Pass along another 8 campsites (blue tents) back to Mammouth Lakes. Subsequently, I continued walking on the same second permit south loosely following the John Muir Trail (JMT) and past it to Horseshoe Meadow near Lone Pine, CA.
My solution included two different, easy-to-get permits to loop counter-clockwise through Yosemite. Starting at Mammouth Lakes (Devils Postpile trailhead), I first headed north loosely following the JMT by crossing Donahue Pass (11,067′ or 3370m high) to reach Tuolumne Meadows (8,619′ or 2630 m low), Clouds Rest, and finally Yosemite Village. Resupplying there, I picked up my second permit, and hiked south back to Mammouth Lakes via Red Peak Pass in the Clarke Range. Back on the JMT at Devils Postpile 8 days later I slept at Reds Meadow (camp #18) to walk south for the next 18 days to complete my own JMT Plus.
The return loop through Yosemite added 82 miles, but these 82 miles required a different set of physical and mental skills, because away from the JMT both people and trails disappear intermittently for days which does not happen on the JMT. The gallery below shows my camp #9 above Half Dome (top left), myself on Clouds Rest (top center), and Cathedral Mountain seen from Lower Cathedral Lake (top right) either on or near the JMT. The larger bottom photo shows the Clarke Range in the distance that I crossed 5 days later. I took the photo above Clouds Rest before descending to Yosemite Village the next day.
The JMT is a shoulder-wide super-highway through the wilderness. The trails are always well maintained and one meets about 10 to 30 people every day from all over the world of all ages. Only on the last 5 miles past iconic Half Dome into Yosemite Village 100s or 1000s of people moved up and down the trails for the day. Sleeping at the backpacker’s campground in Yosemite Village (camp #10) for $8, I splurged on an awesome $40 breakfast at the majestic Ahwahnee Hotel. These are my priorities and I was back on serene trails turning right (west) near Nevada Falls to head up towards the Illilouette Valley. The last day hikers were a lovely couple from Lithuania with their two lively and happy children. Two hours later I reached the Illilouette watershed where I slept solidly on a thick and soft bed of pine needles (camp #11).
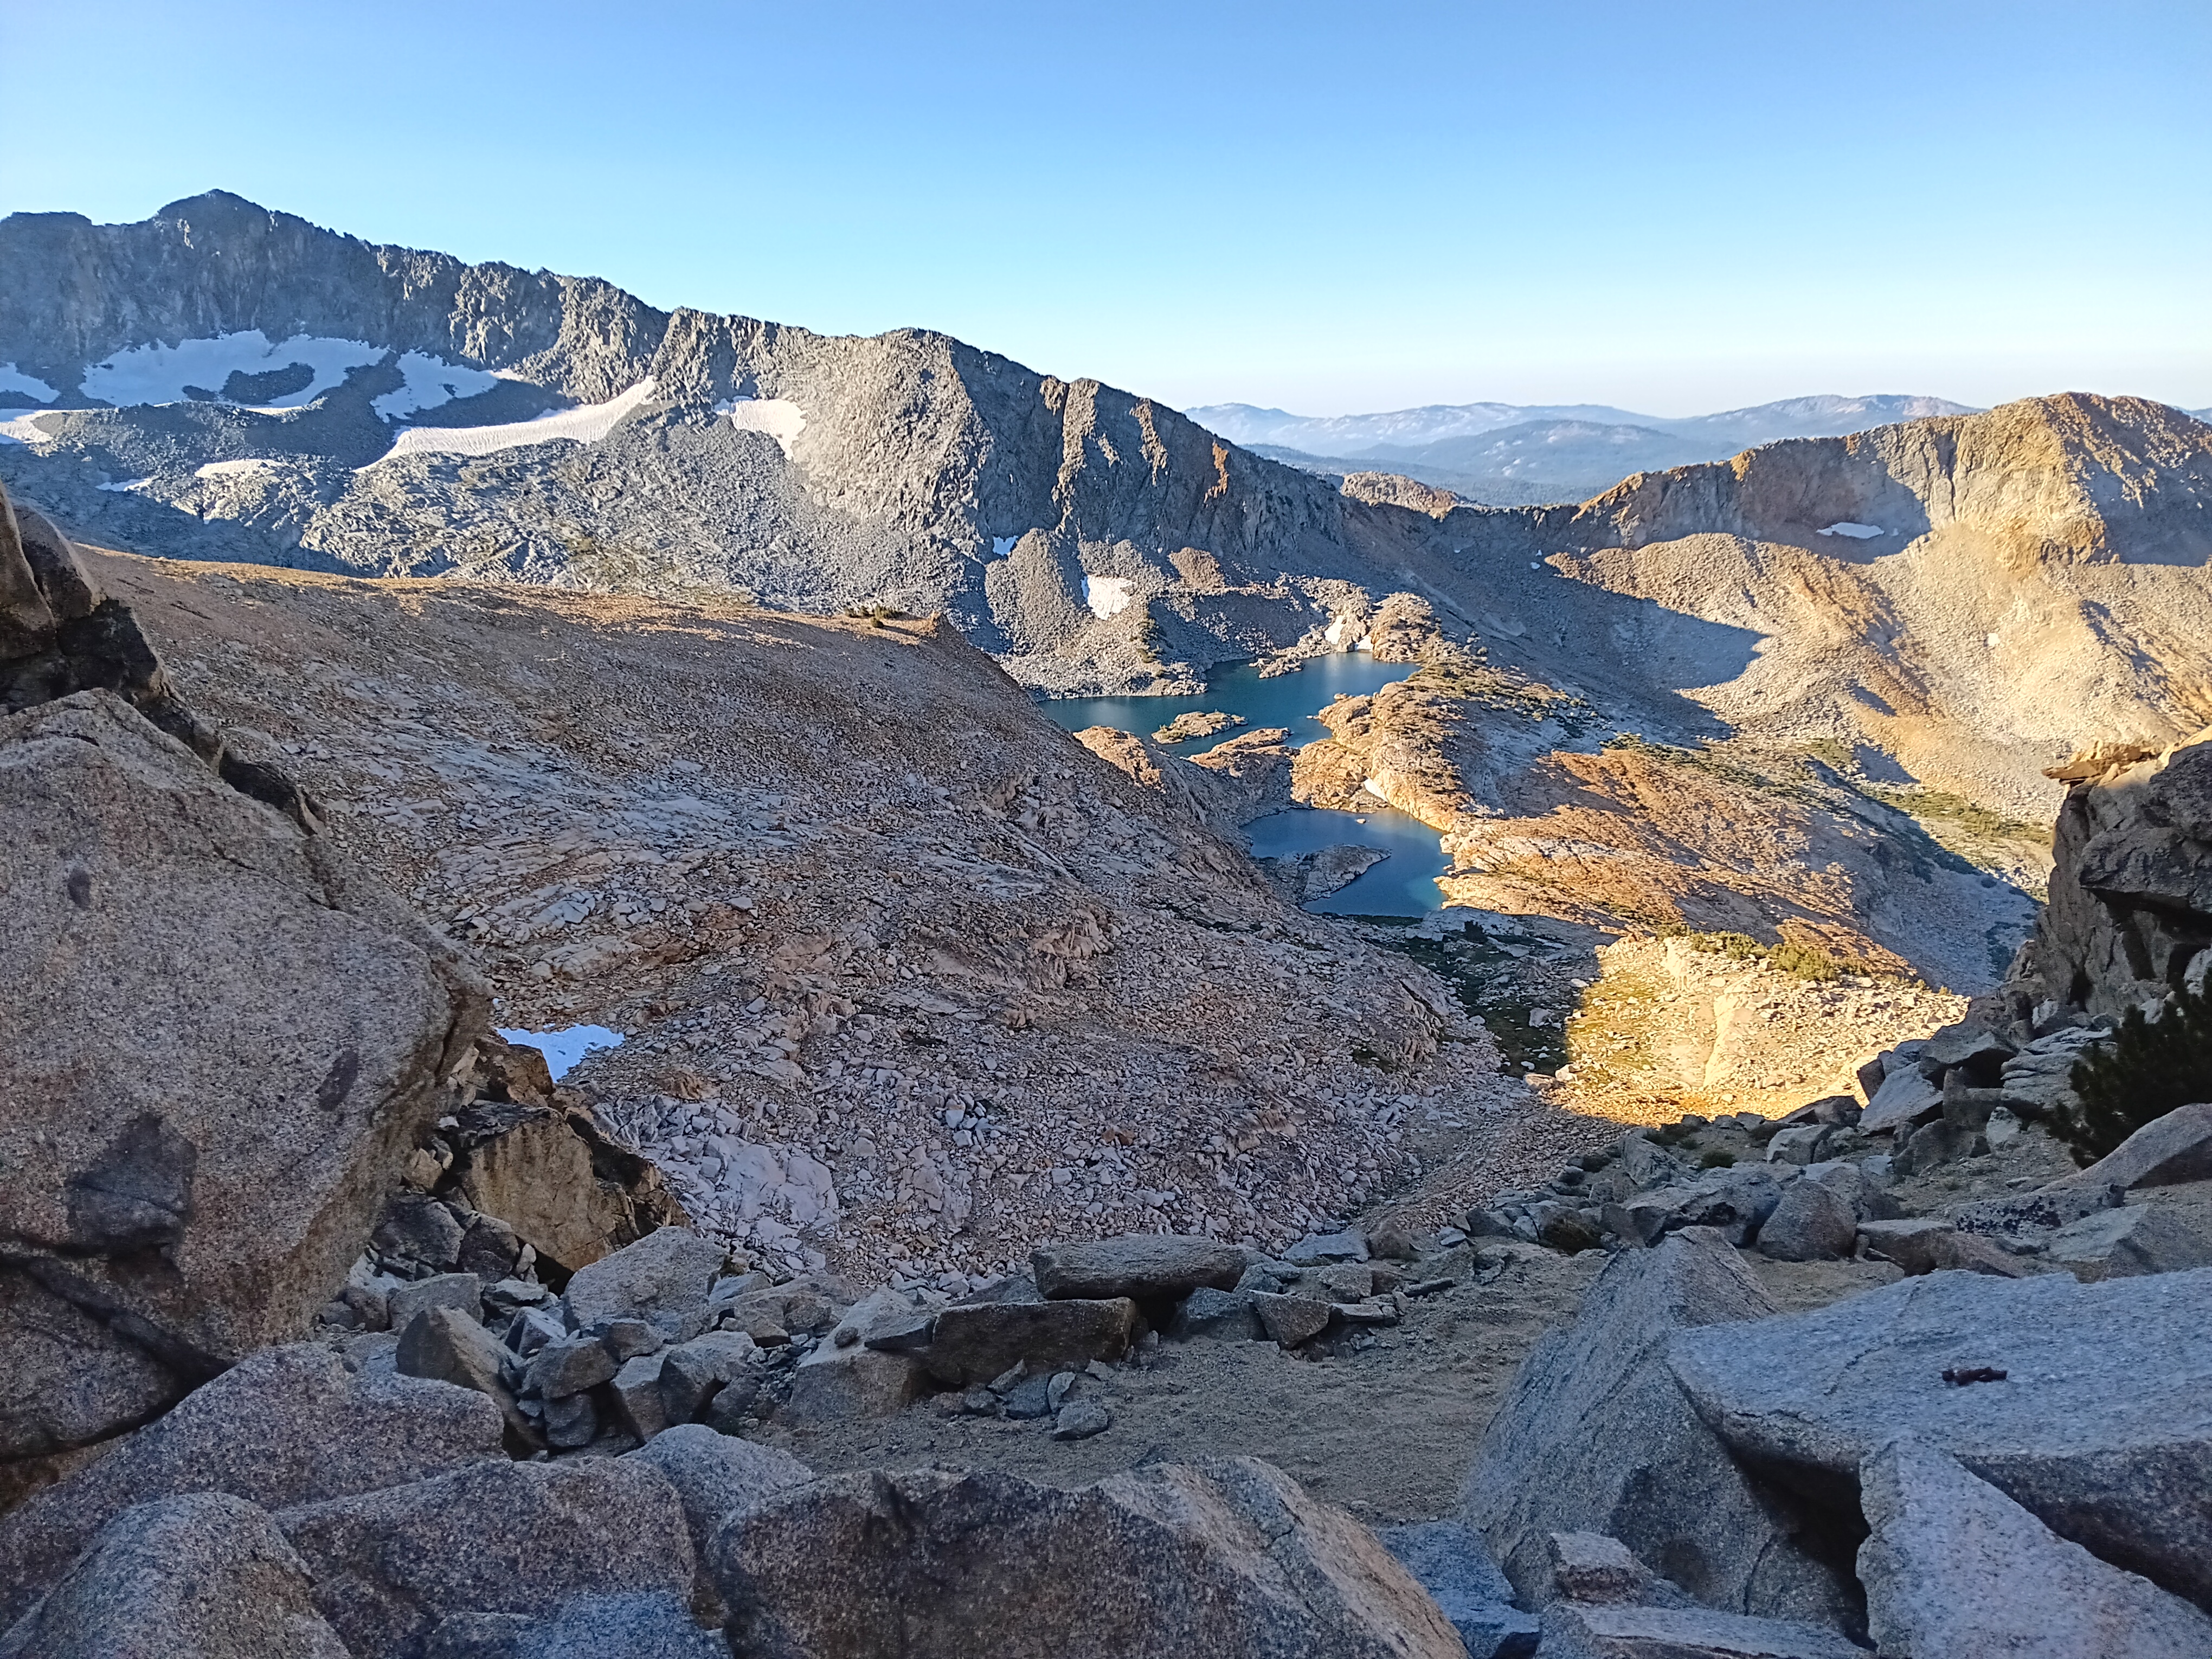
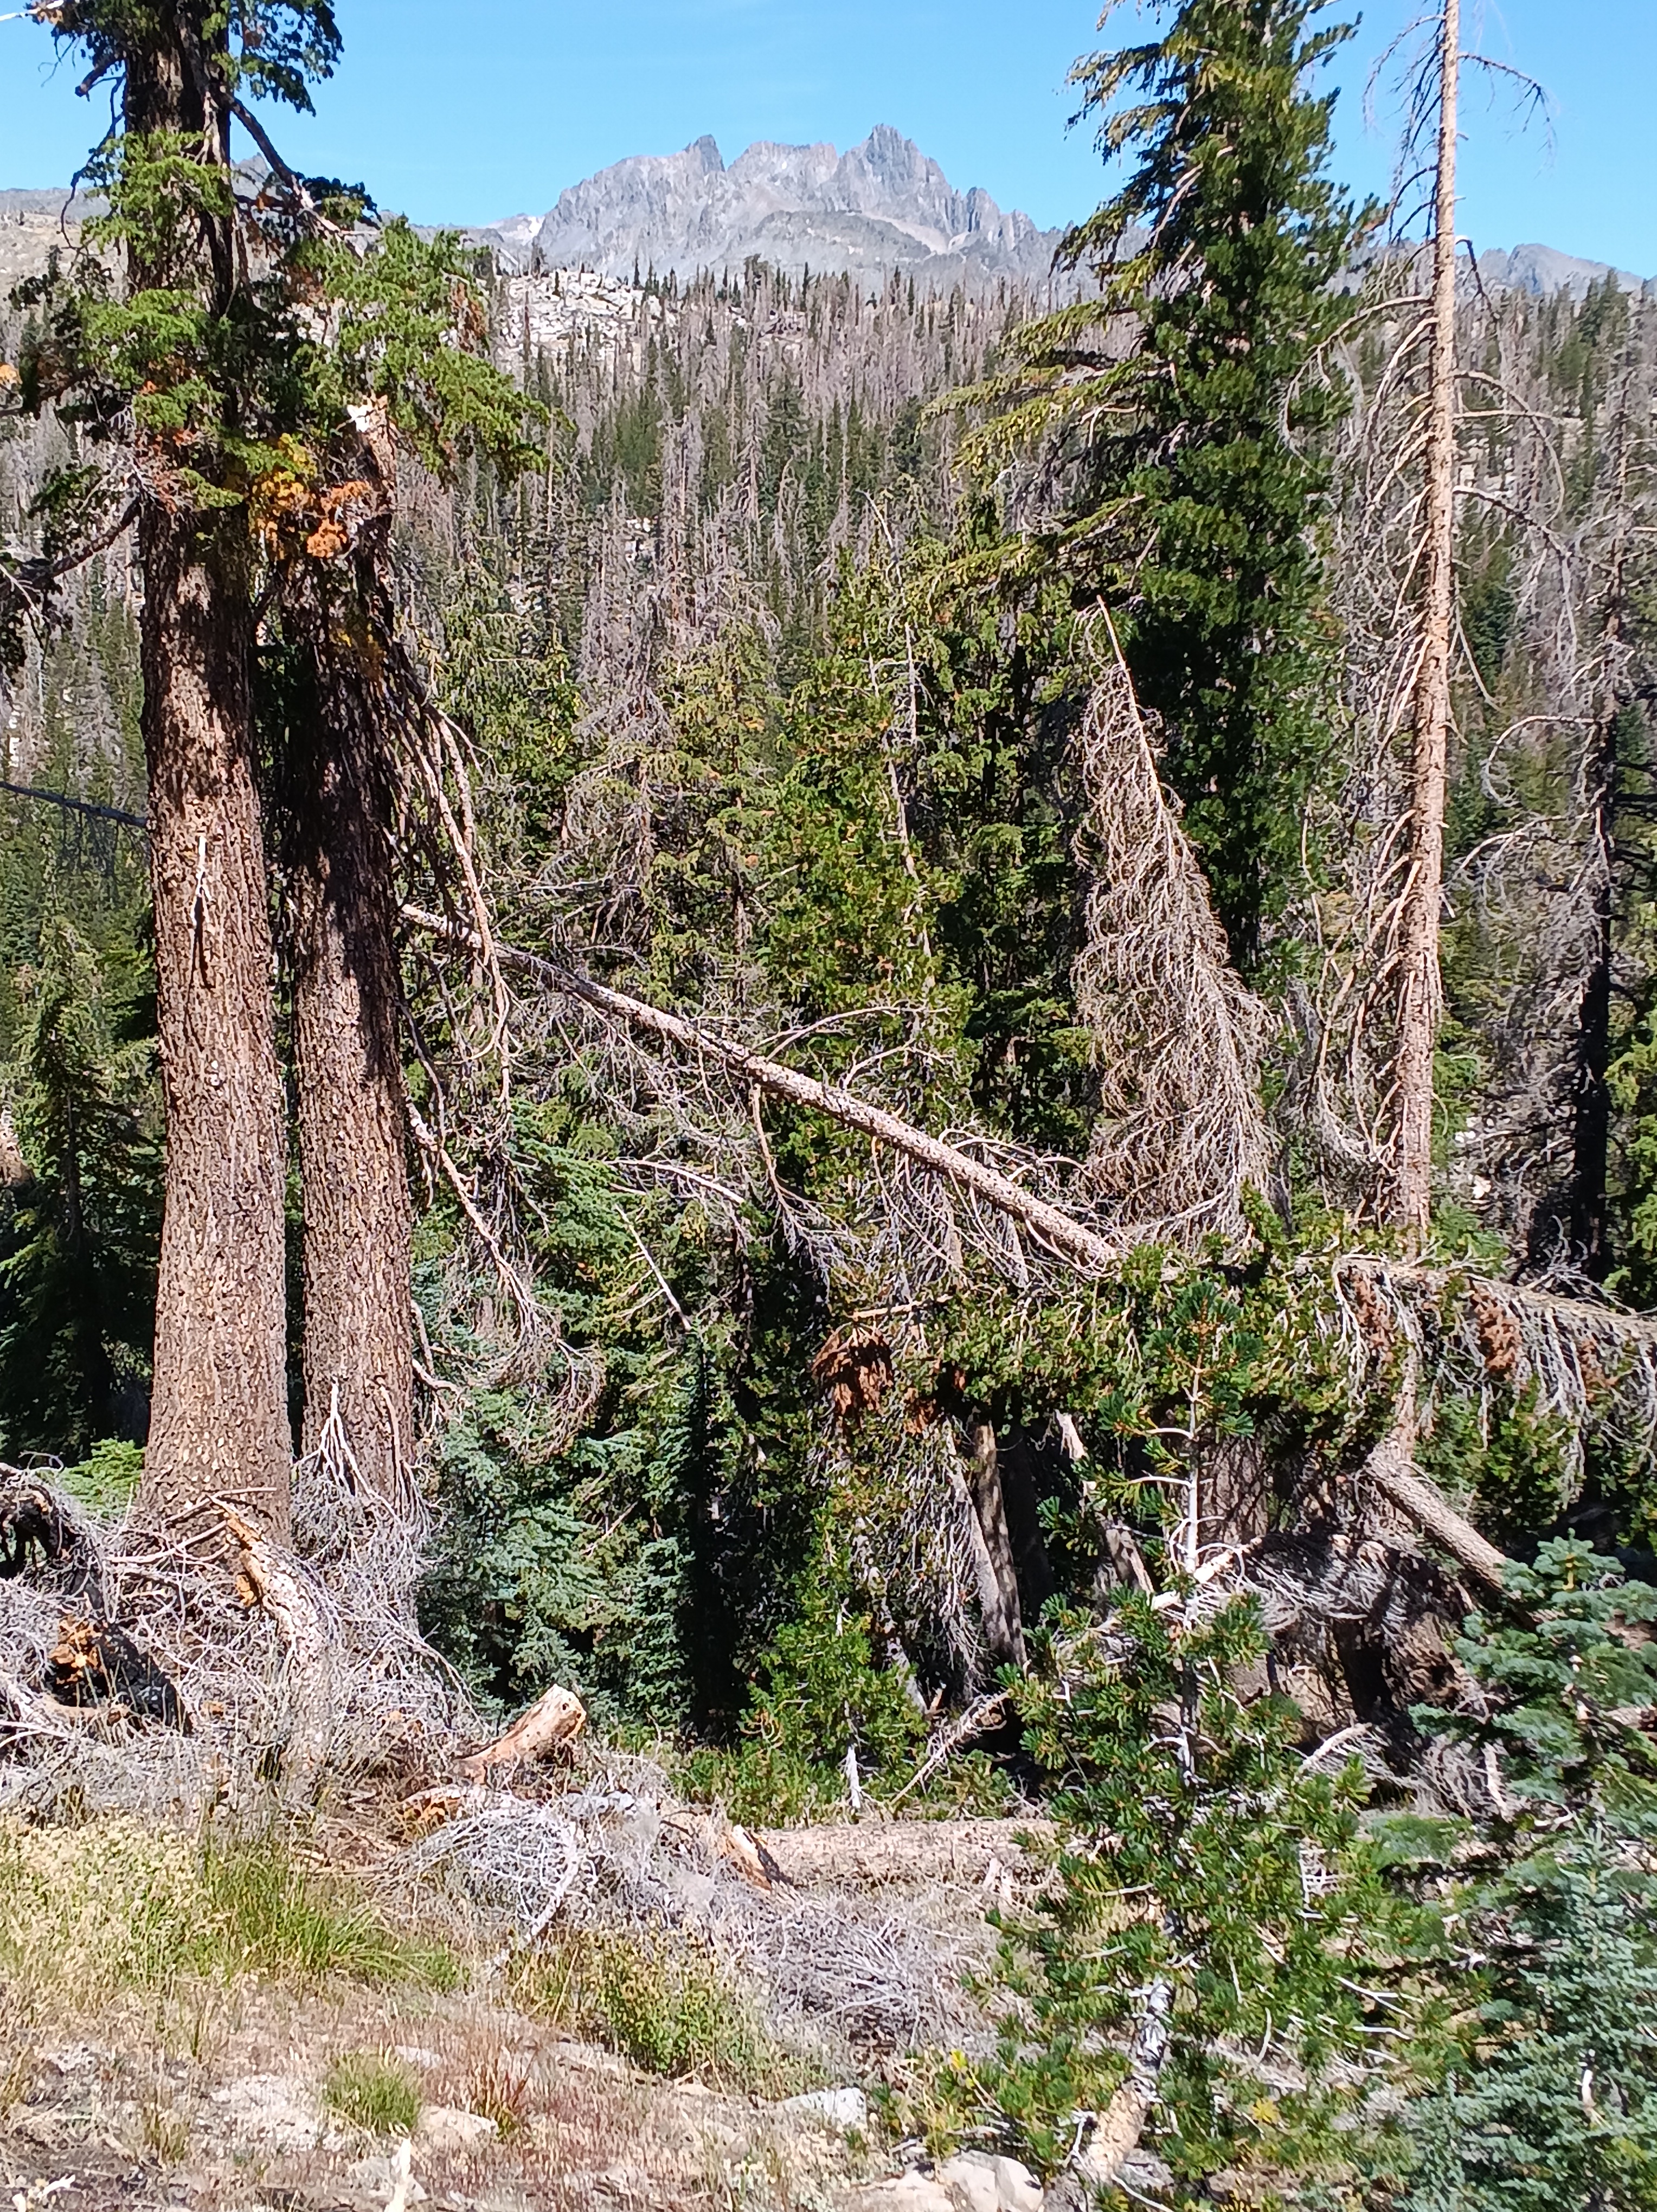
The next two days I only met one group of 2 hikers on my way to Merced Pass Lakes (camp #12) and nobody to Ottoway Lakes just below Red Peak Pass in the Clarke Range. My campsite #13 in the top-left photo below is the small flat area in the shade next to a 20 feet high block of granite. My view towards the west included Merced Peak at 11,726 feet (3574 m) and nearby patches of snow.
The photo above shows Merced Peak the tallest mountain of Yosemite’s Clarke Range. I crossed this range the next morning via 11,150′ (3400 m) high Red Peak Pass from where the photo above was taken at 8 am in the morning. The many switchbacks made this an easy hike both up and down into Merced Valley. Here I met, surprisingly, a group of 2 women from my home state of Delaware: we are a small and flat (<480′ or 140 m) state. Crossing the Merced River at 9,150′ (2790 m) elevation, I climbed up again towards Isberg Pass at 10,510′ (3200 m). The Delaware women told me that a snow storm was predicted the next day and stormy it was, indeed, at my campsite #14. Clouds and wind bursts rolled in and out over Isberg Pass all night and the next day. Without breakfast I left this unpleasantly cold and windy camp at 6:30 am to stay ahead of the snow storm trying to reach lower elevations. Easier said than done …
My old Tom Harrison paper map of Ansel Adams Wilderness showed a “maintained trail” for the next 16.6 miles to Hemlock Crossing (7555′ or 2300 m), a bridge across the North Fork of the San Joaquin River, and another 16.9 miles to Devils Postpile via Granite Stairway (9014′ or 2750 m). Such mileage usually takes me 2-3 days of comfortable walking, but this specific hike took me 4 long and exhausting days of navigation through dense brush and forest often without a trail. I gained a new respect for those who initially explored this wilderness 150 years ago without the contour maps, satellite navigation, text messaging, and SOS buttons that I had with me.
Almost immediately after crossing Isberg Pass, the trail disappeared. No problem here, because at ~11,000′ one is well above the tree line and thus sees clearly where one has to go. It is not hard to boulder over large rocks or walk on flat benches of granite or stroll down gently sloping dry stream beds. Furthermore, as soon as the trees reappeared near 9,500′ the trail reappears also. About half way between Isberg Pass and its trailhead near Clover Meadow Ranger Station I met the last group of people for the next 3 days. They were led by a “preacher” my age (63 years) without a backpack and four disciples ~20 years younger who carried heavy loads for their 4-5 day “revival” at Turner Lake in Yosemite. They were friendly, tried to convert me with good humor, and we talked for about 20-30 minutes about nature, god, and life as we know it, but then they headed up towards Isberg Pass and Yosemite while I headed down towards Bugg Meadow and Devils Postpile. All good.
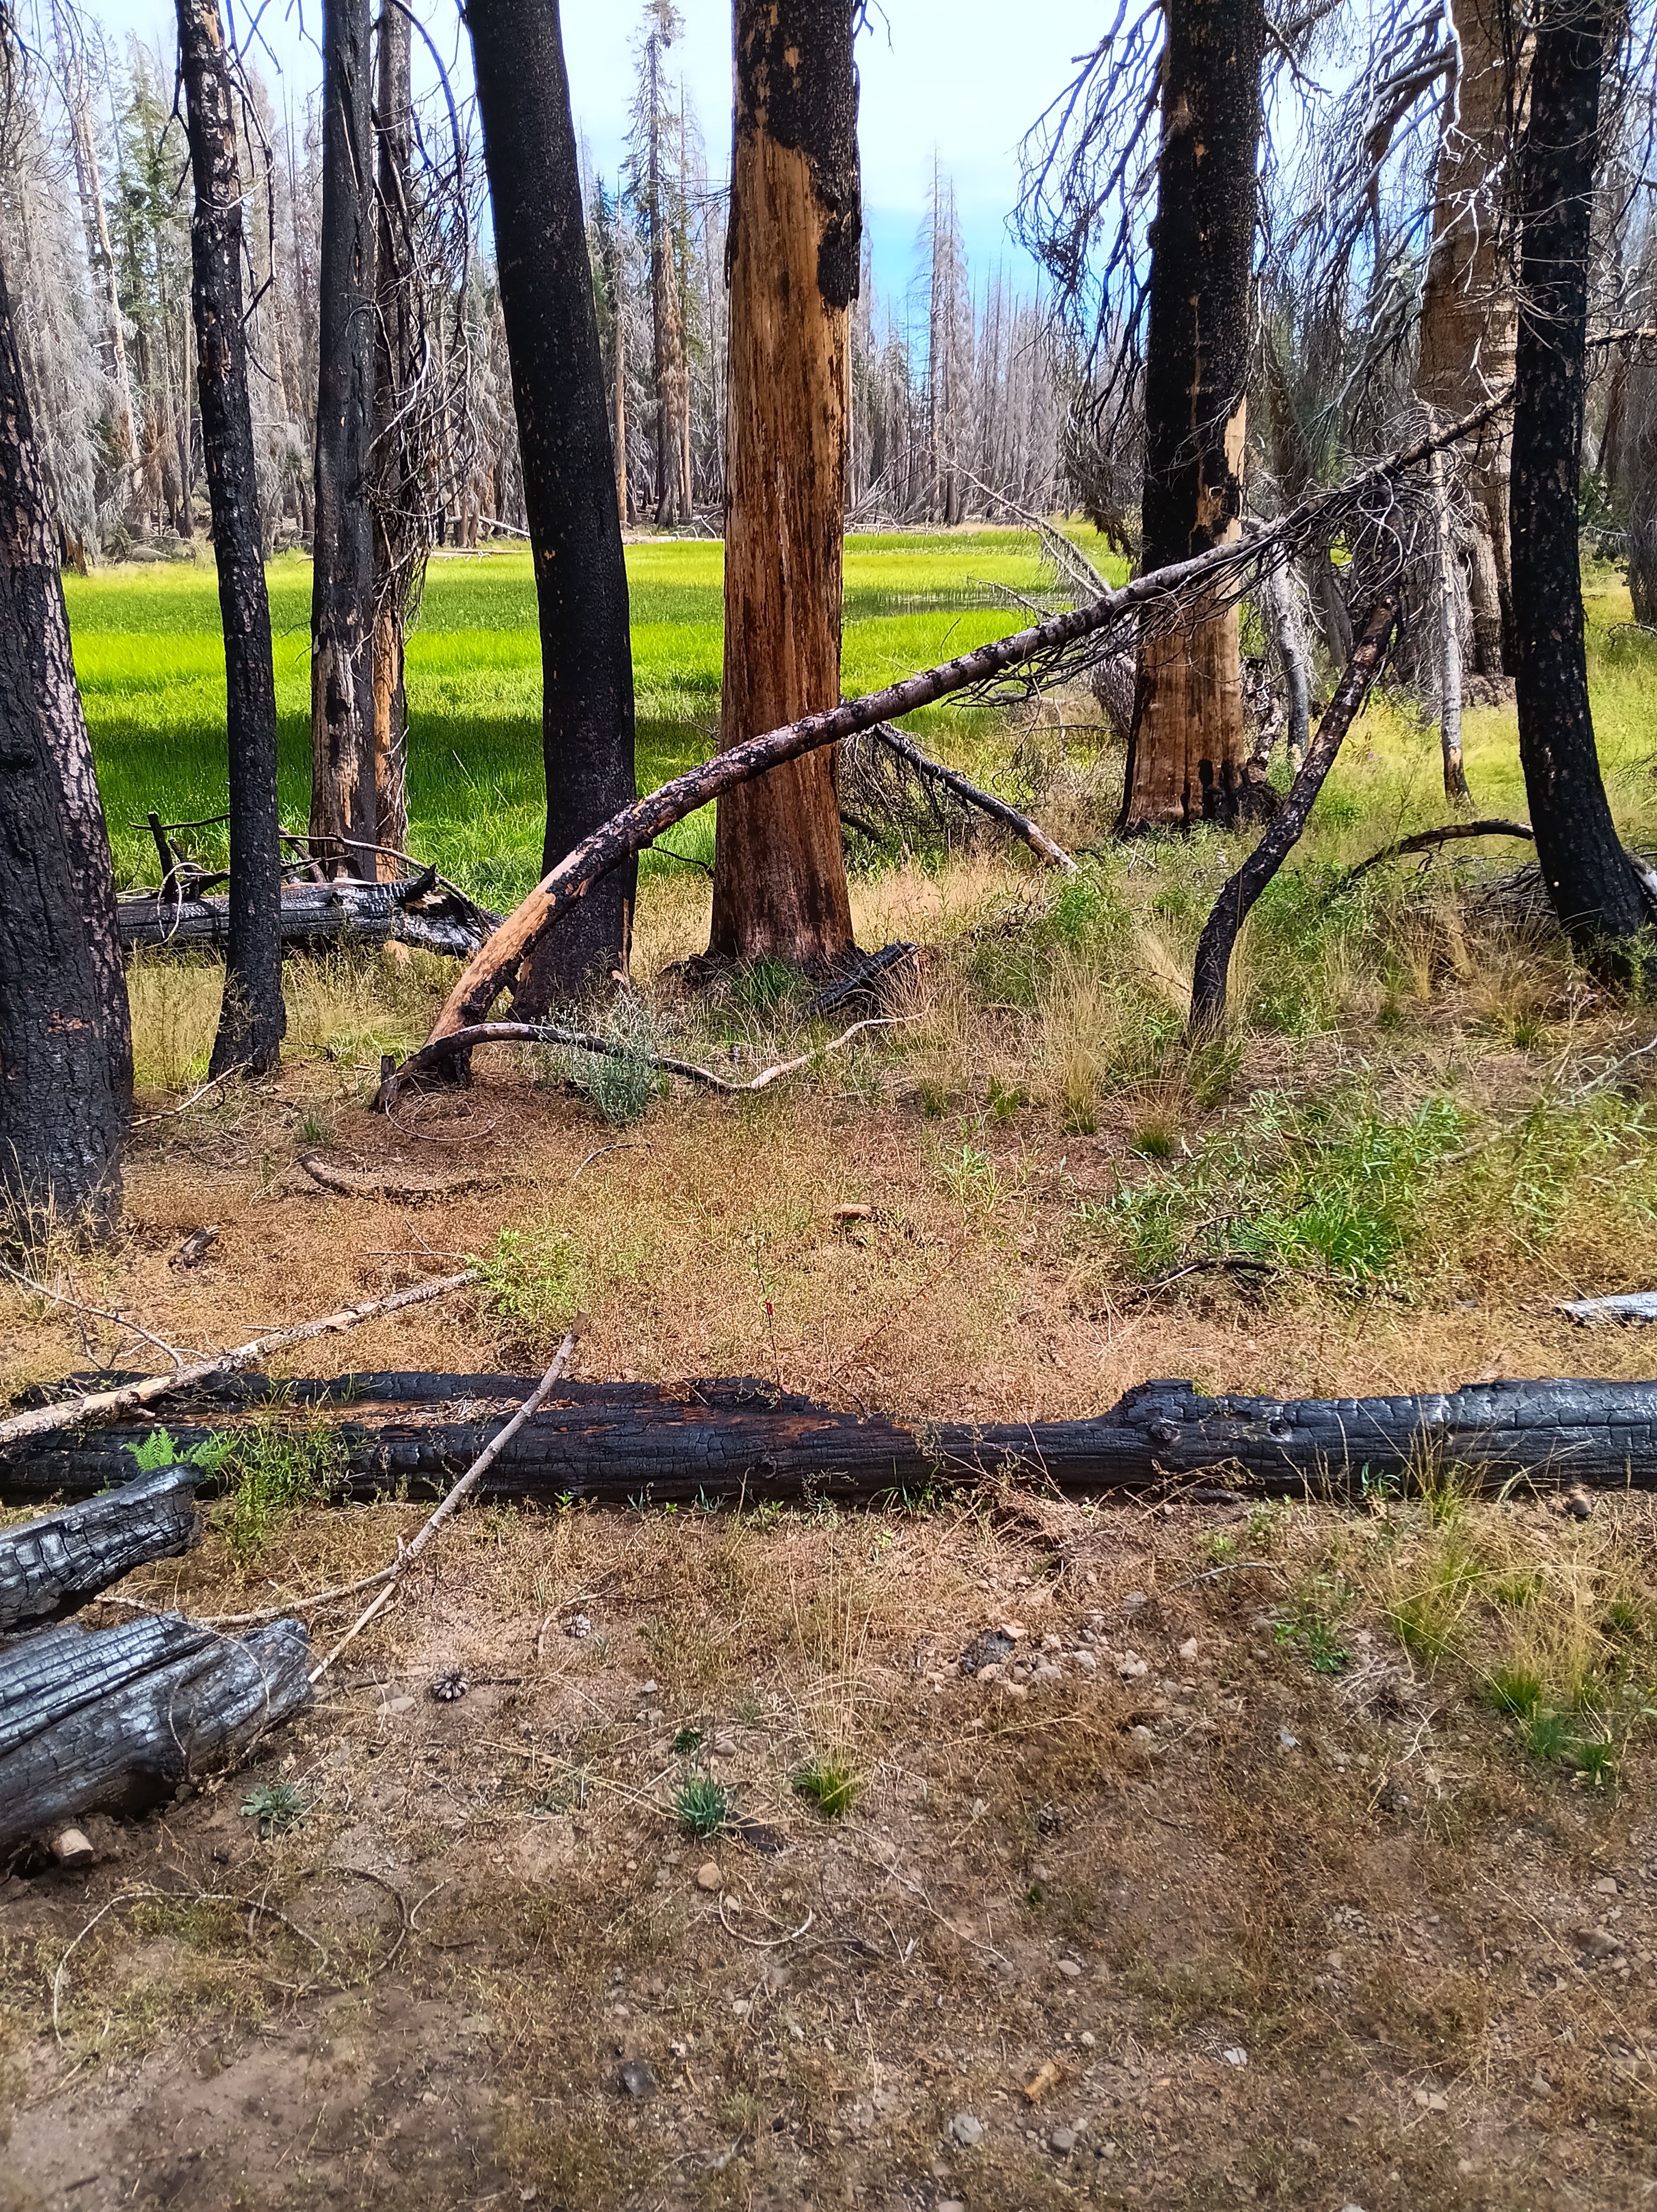
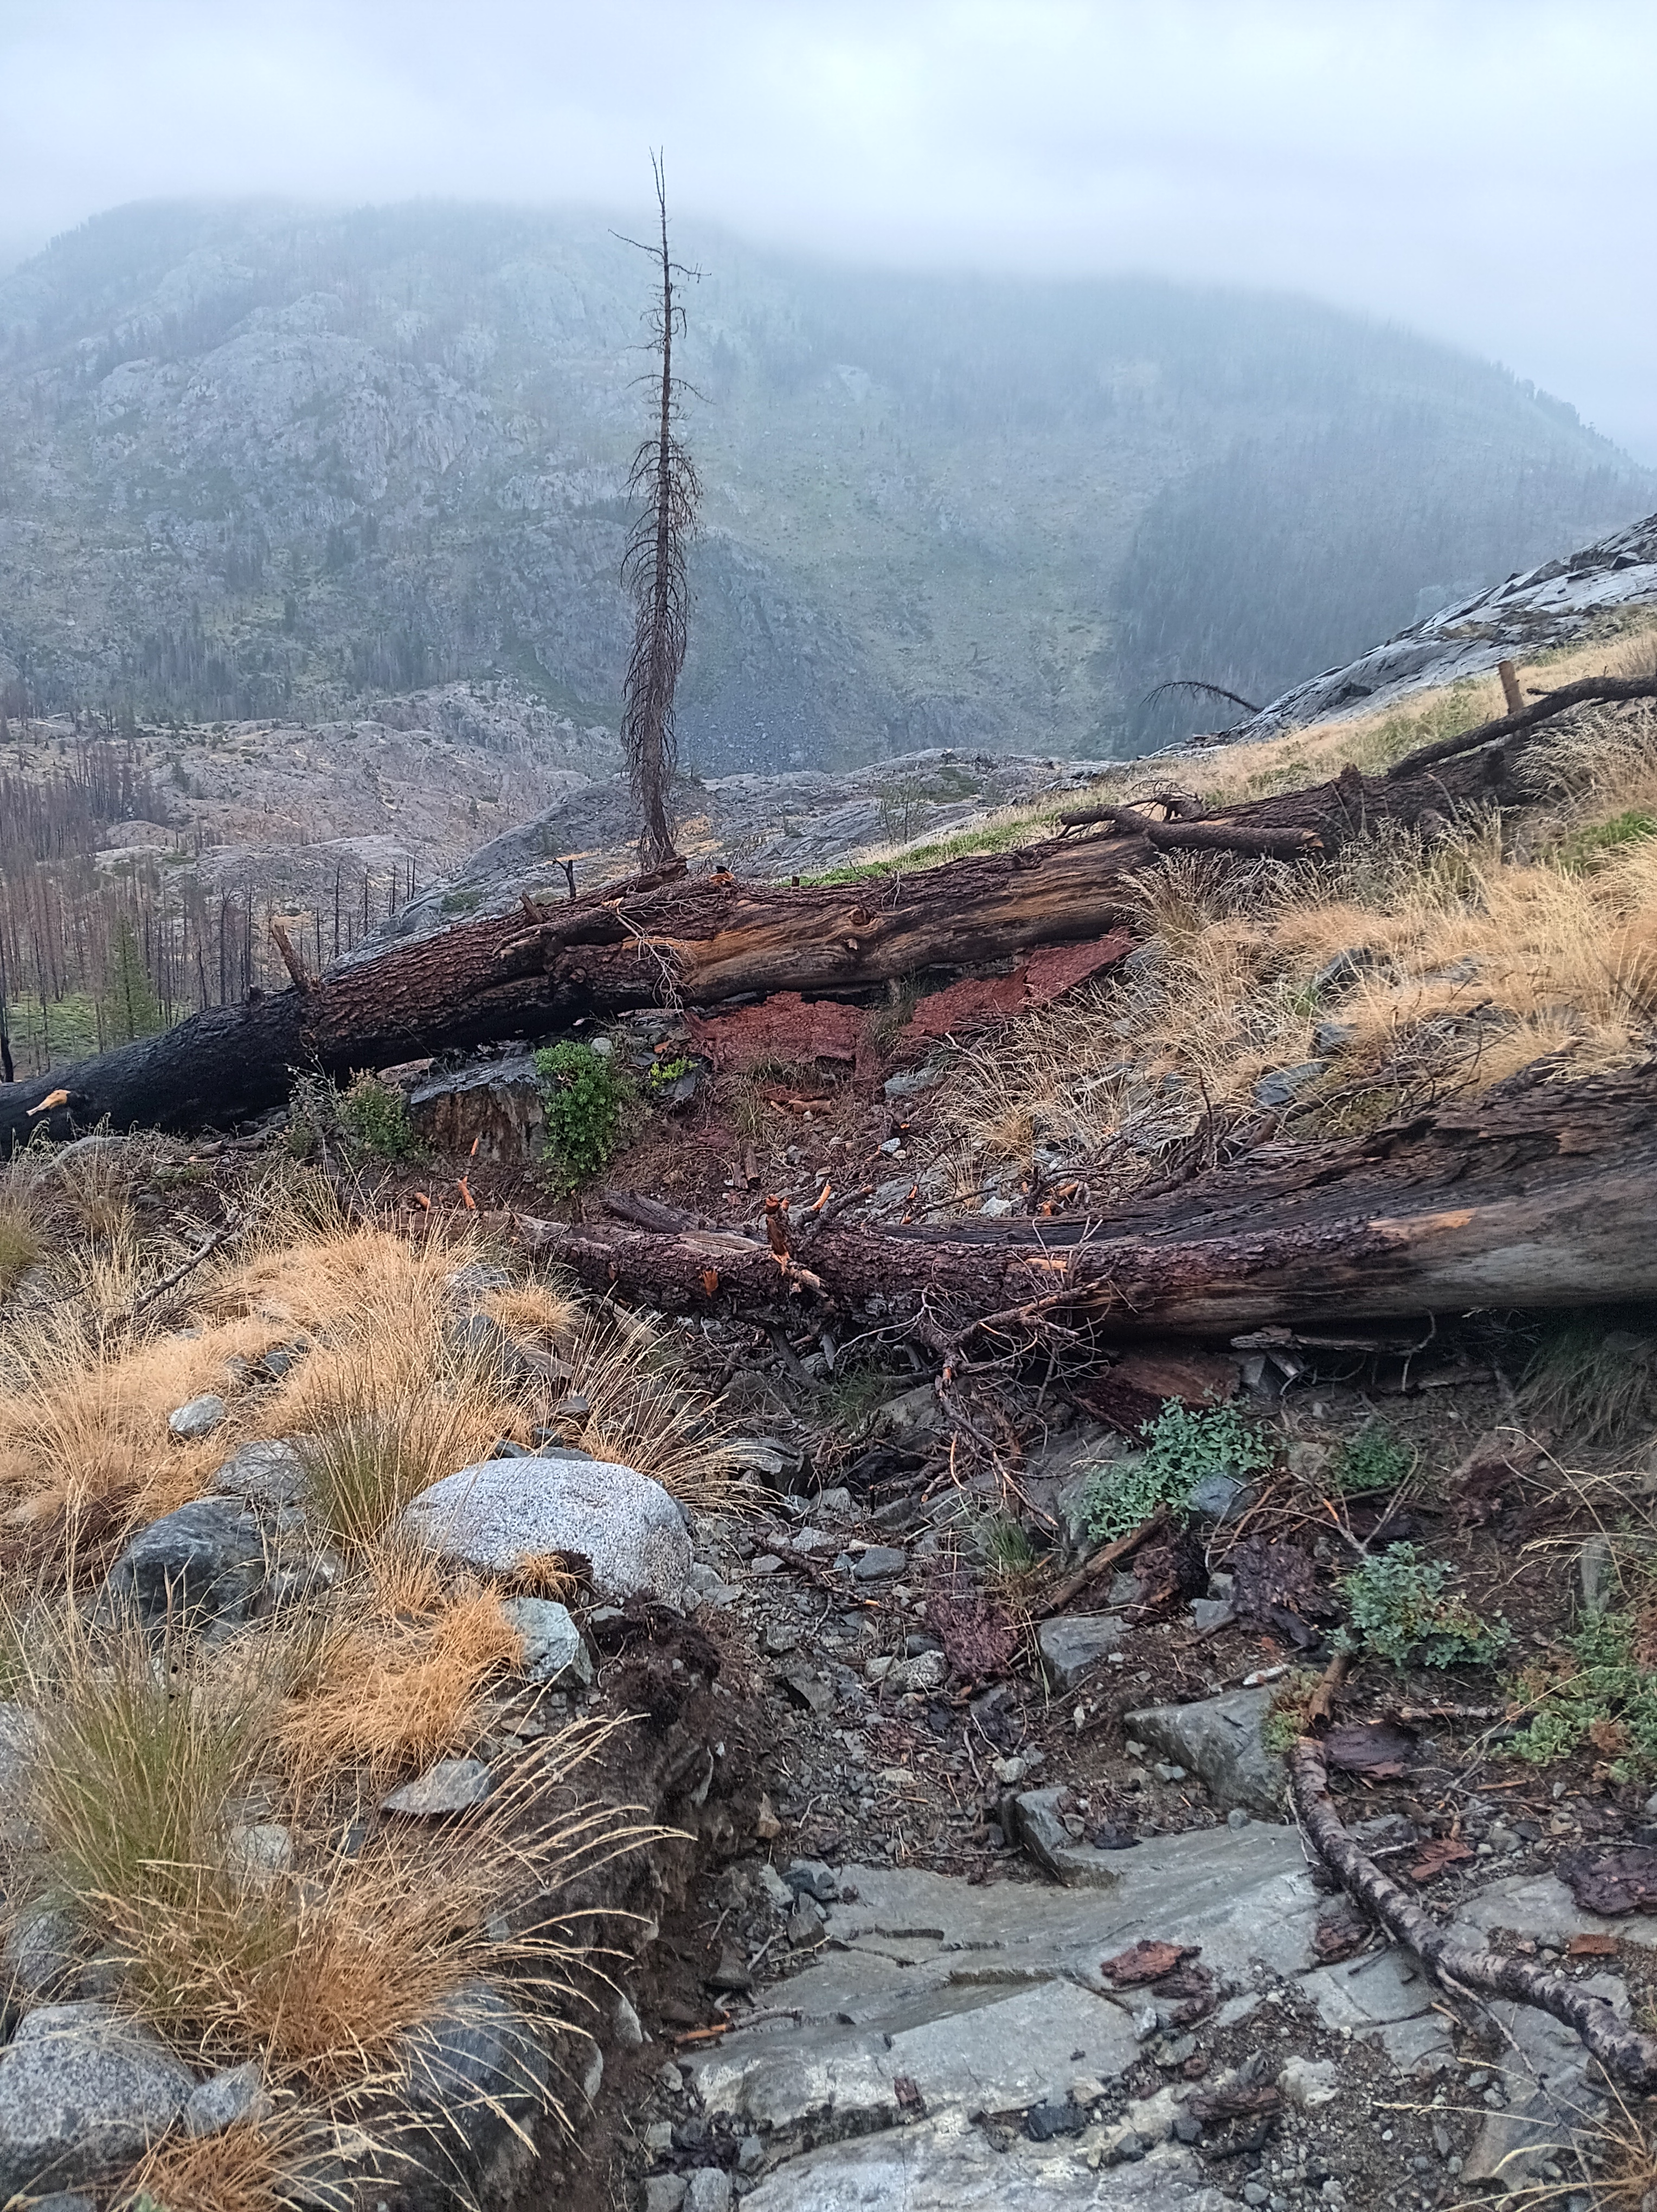
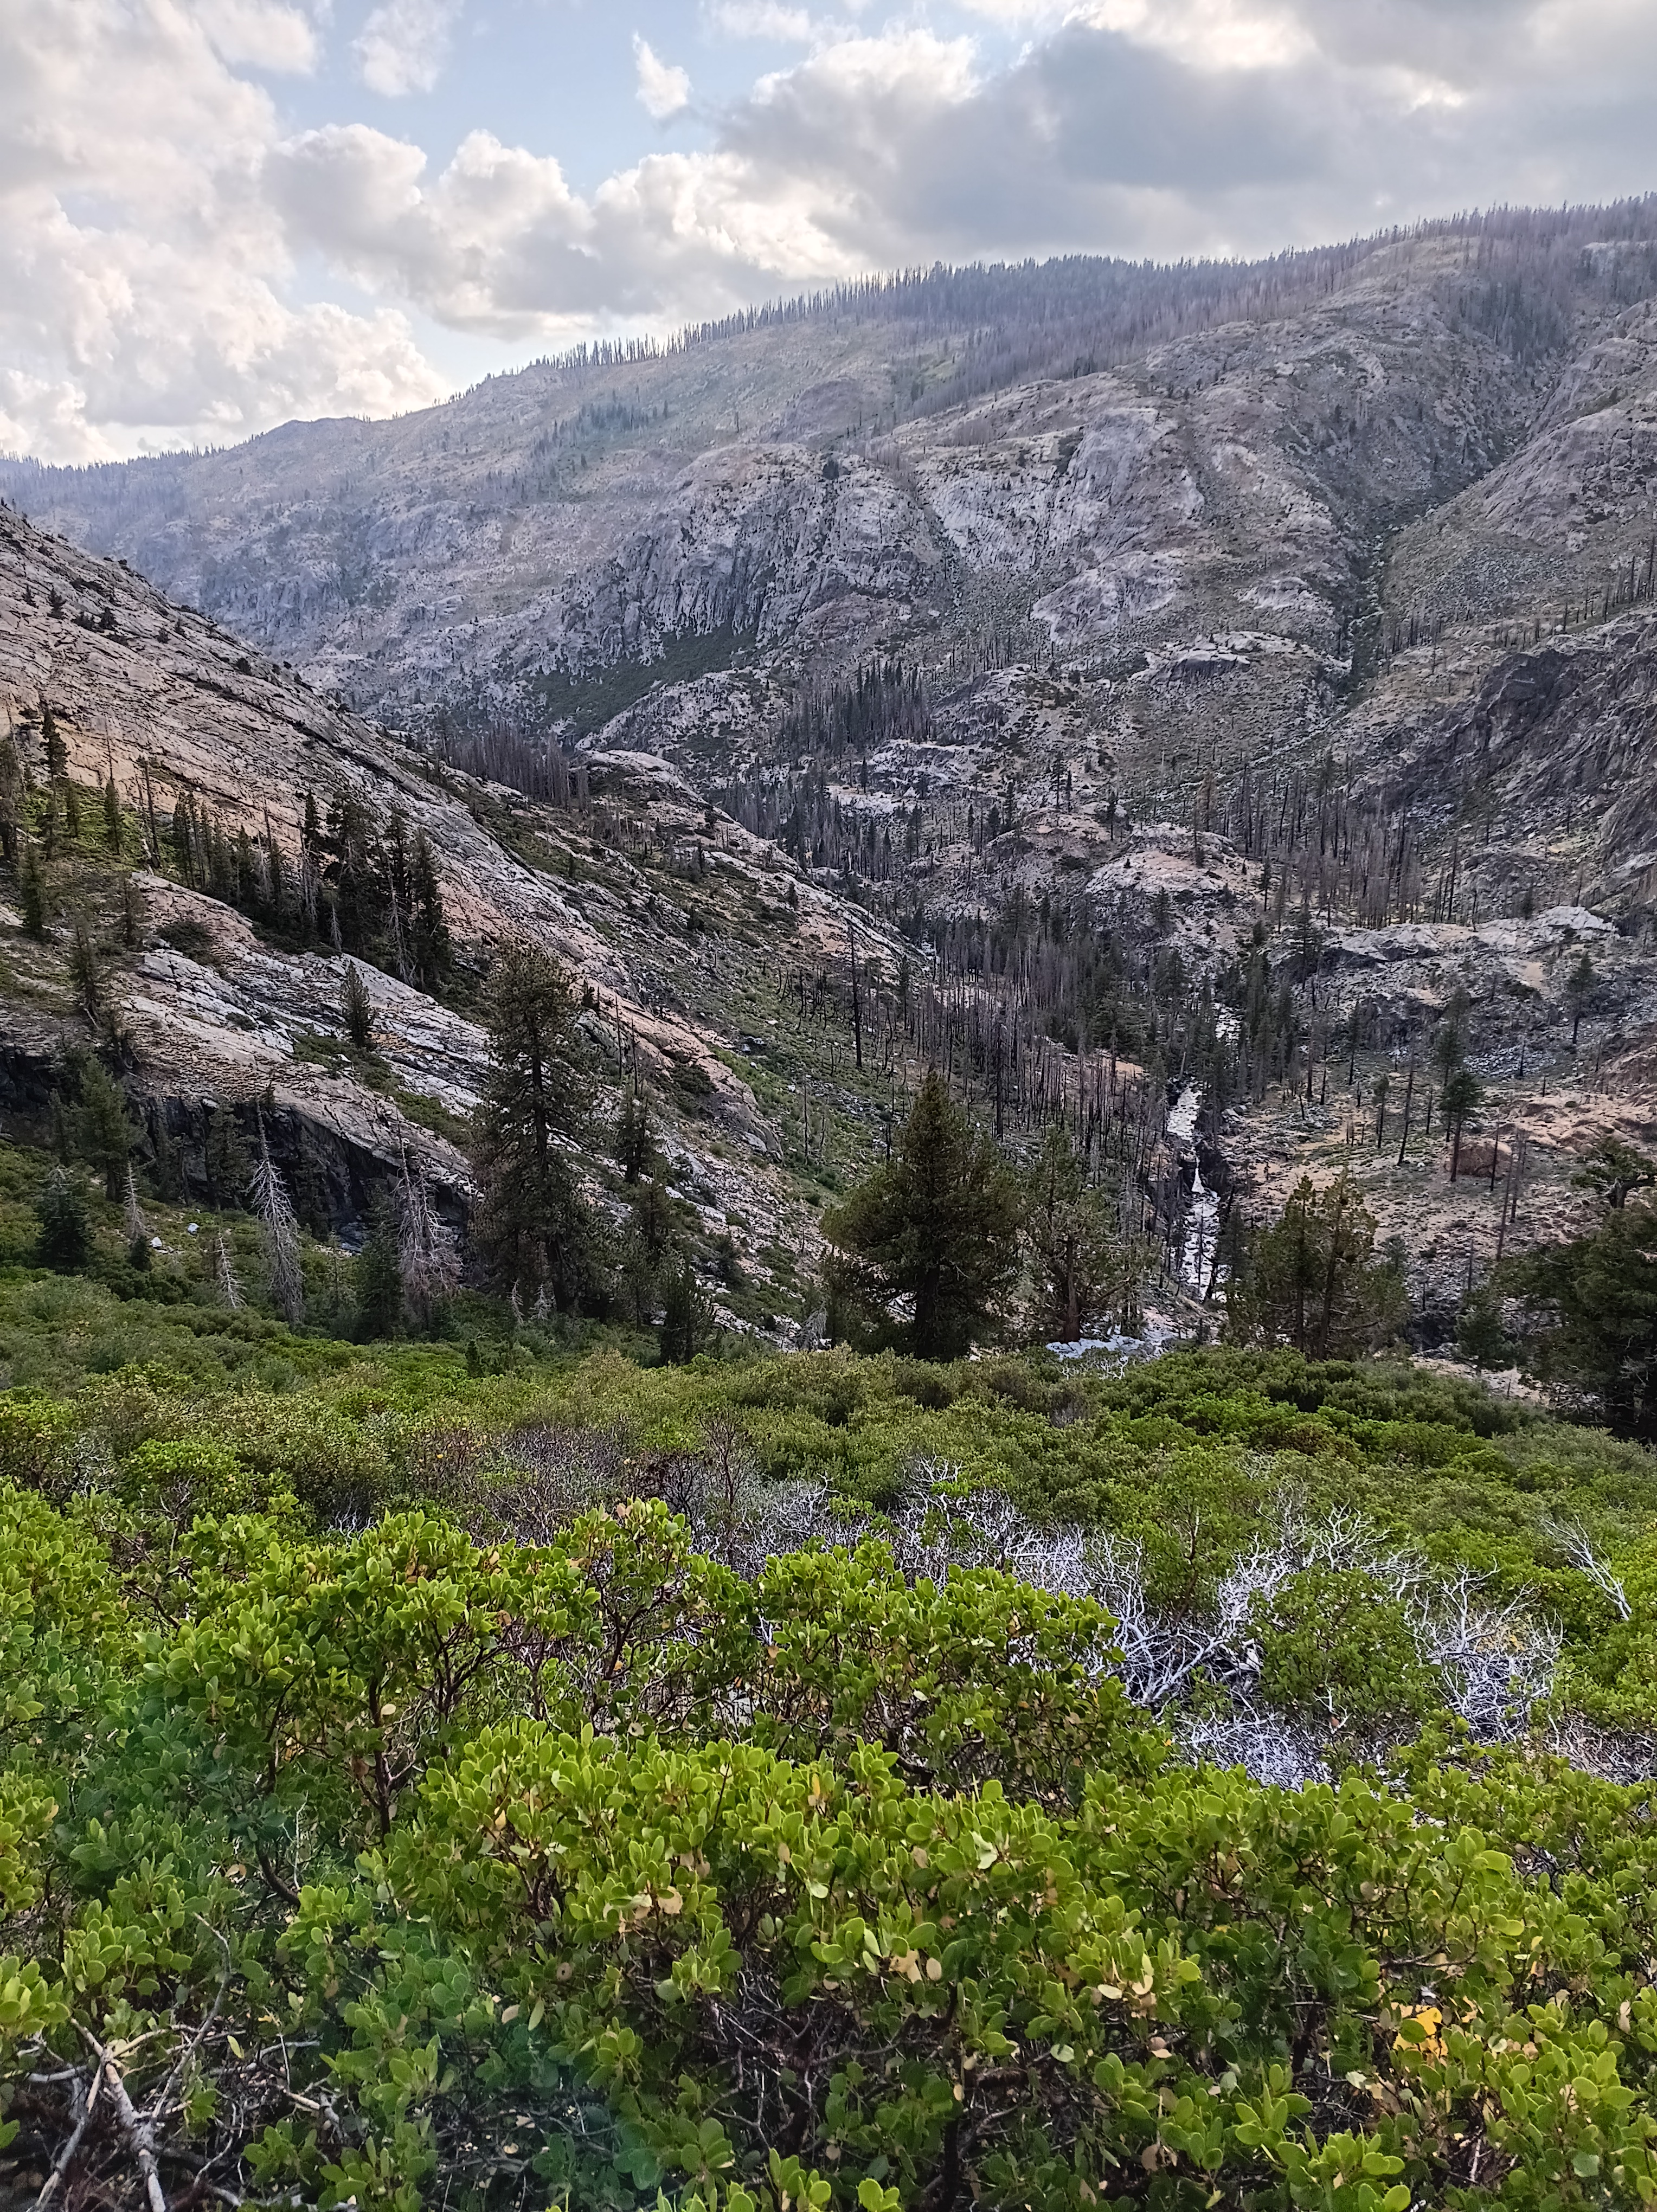
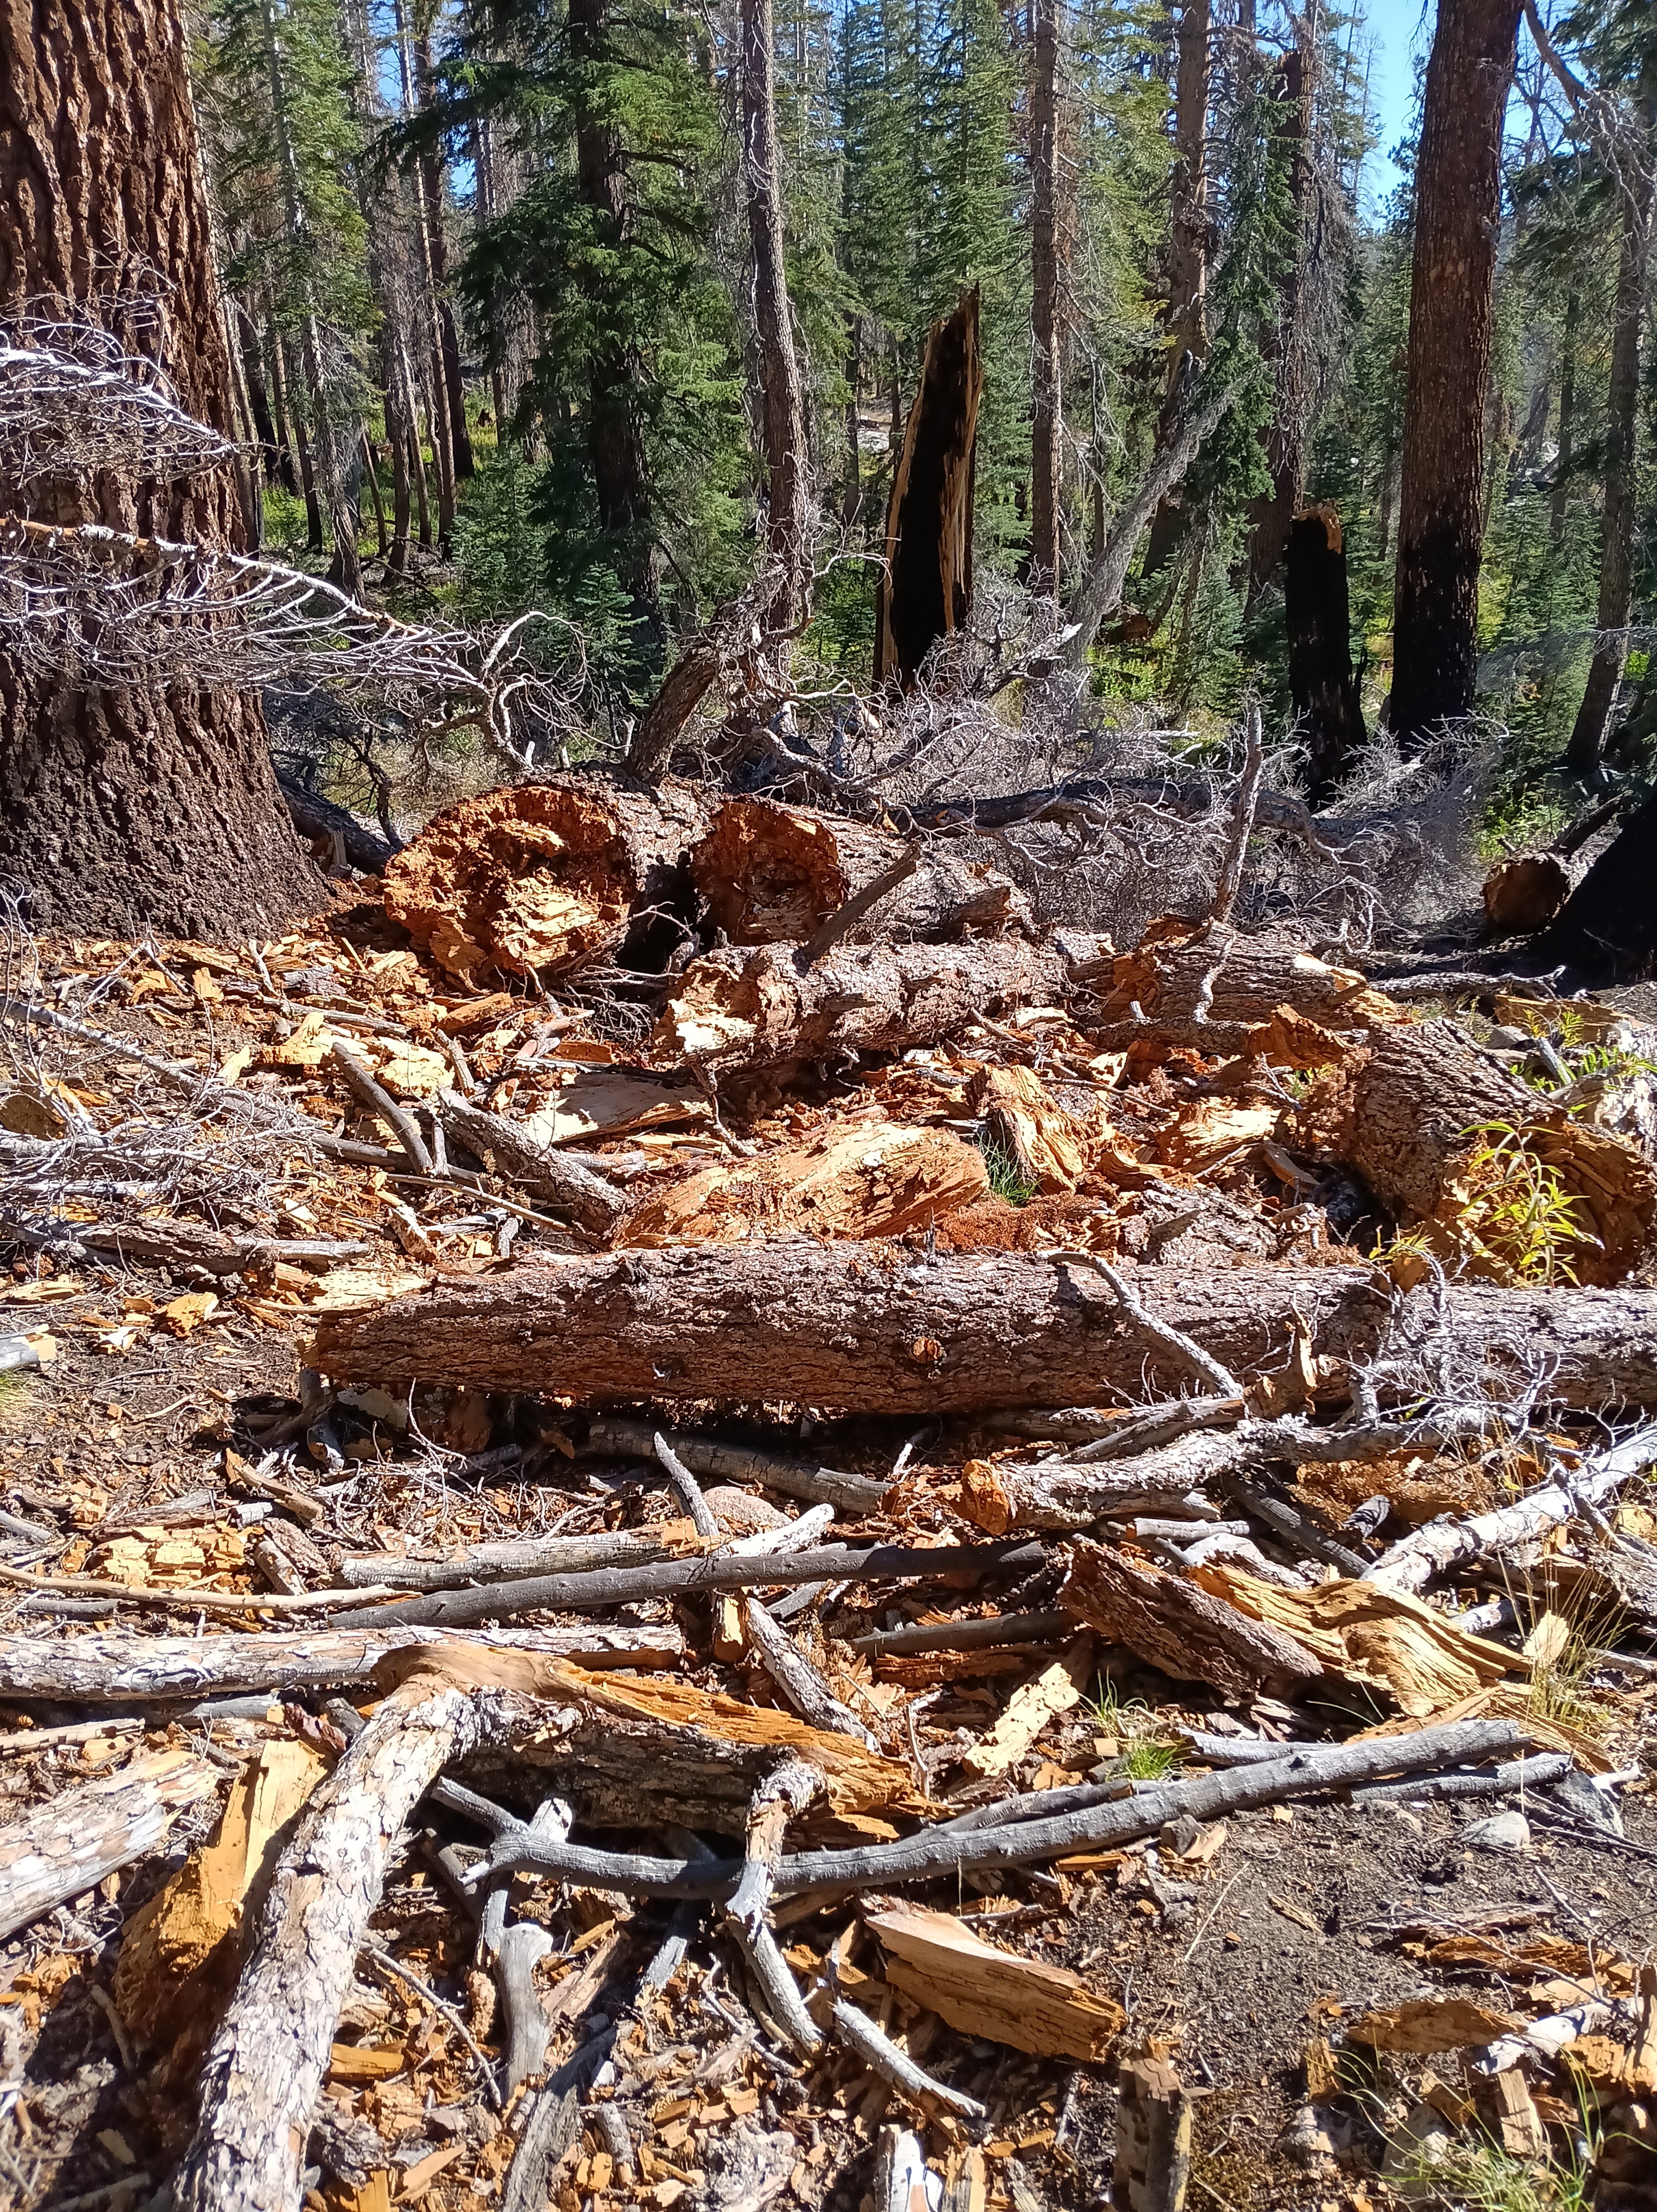
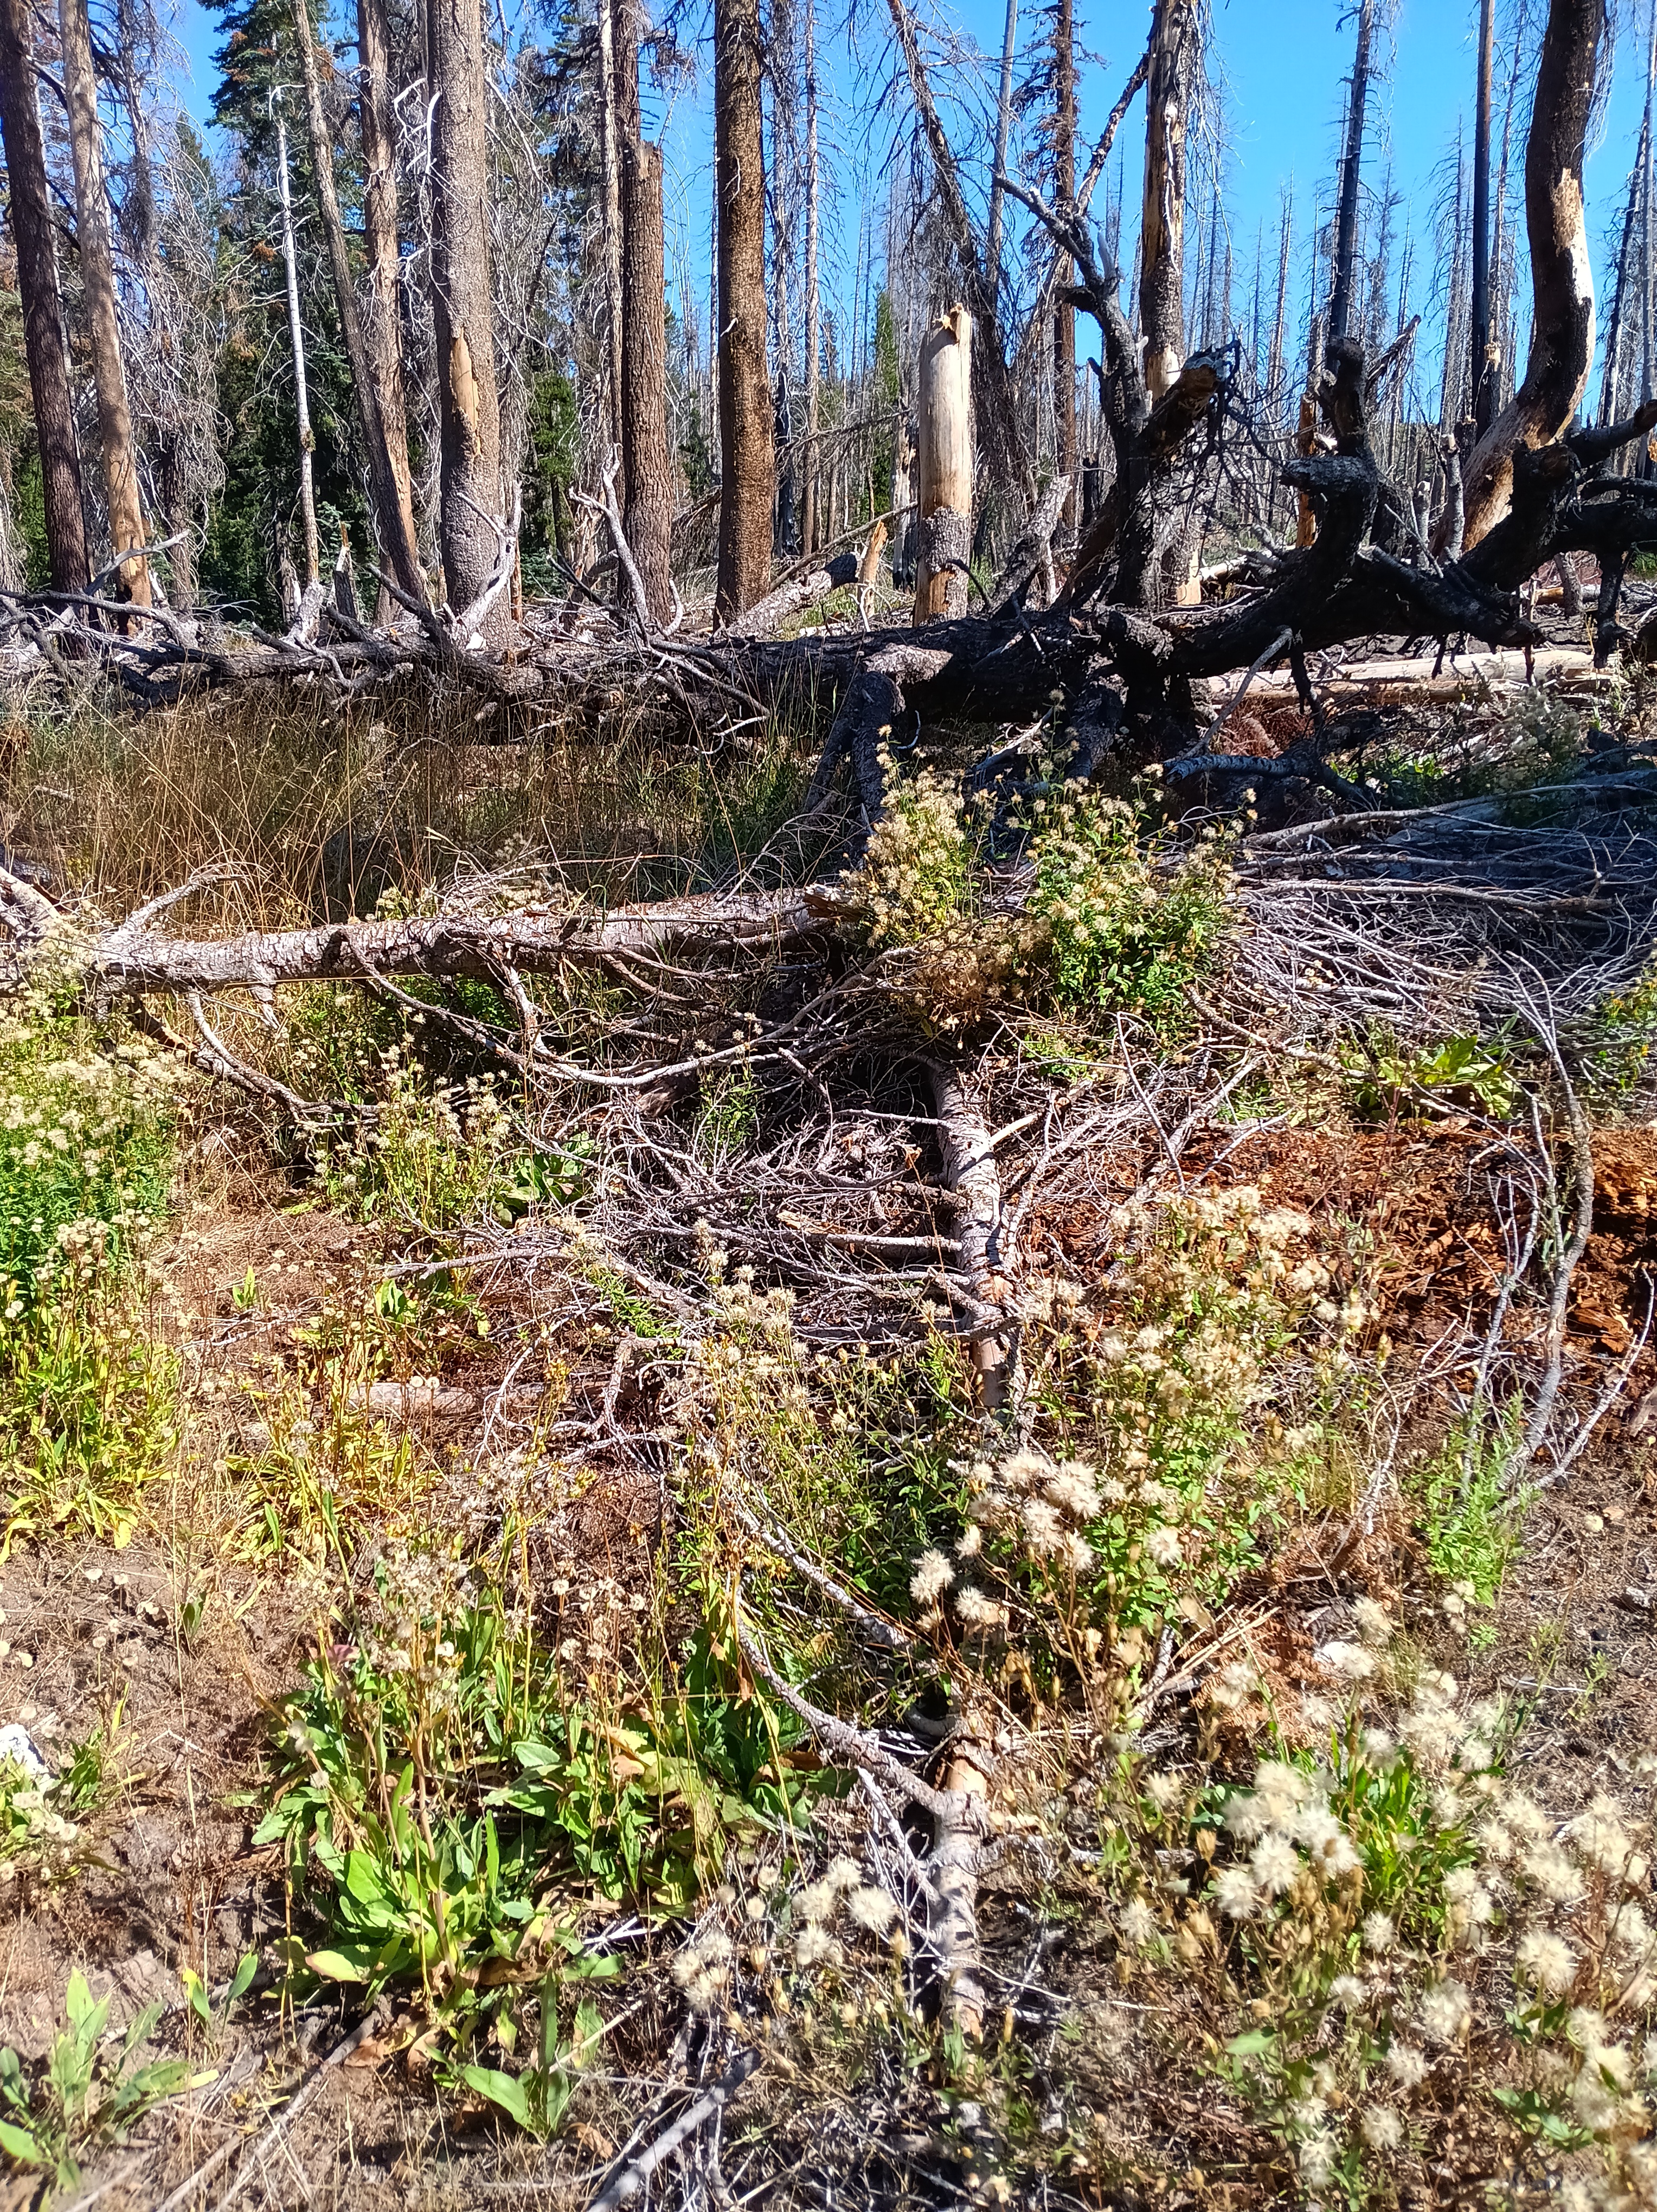
Three hours later the trail almost disappears as I turn east at Detachment Meadow away from all trailheads. The trail becomes fainter with every mile, yet suddenly a posted junction sign points me towards Bugg Meadow and Hemlock Crossing. Good, this is my destination, but the trail immediately disappears. I pitched my tent (camp #15) near a fire-scarred rocky out-crop 2000 feet above the mighty valley the North Fork of the San Joaquin River just before it started to sleet. The next 3 days were the most difficult of my 35 days in the mountains:
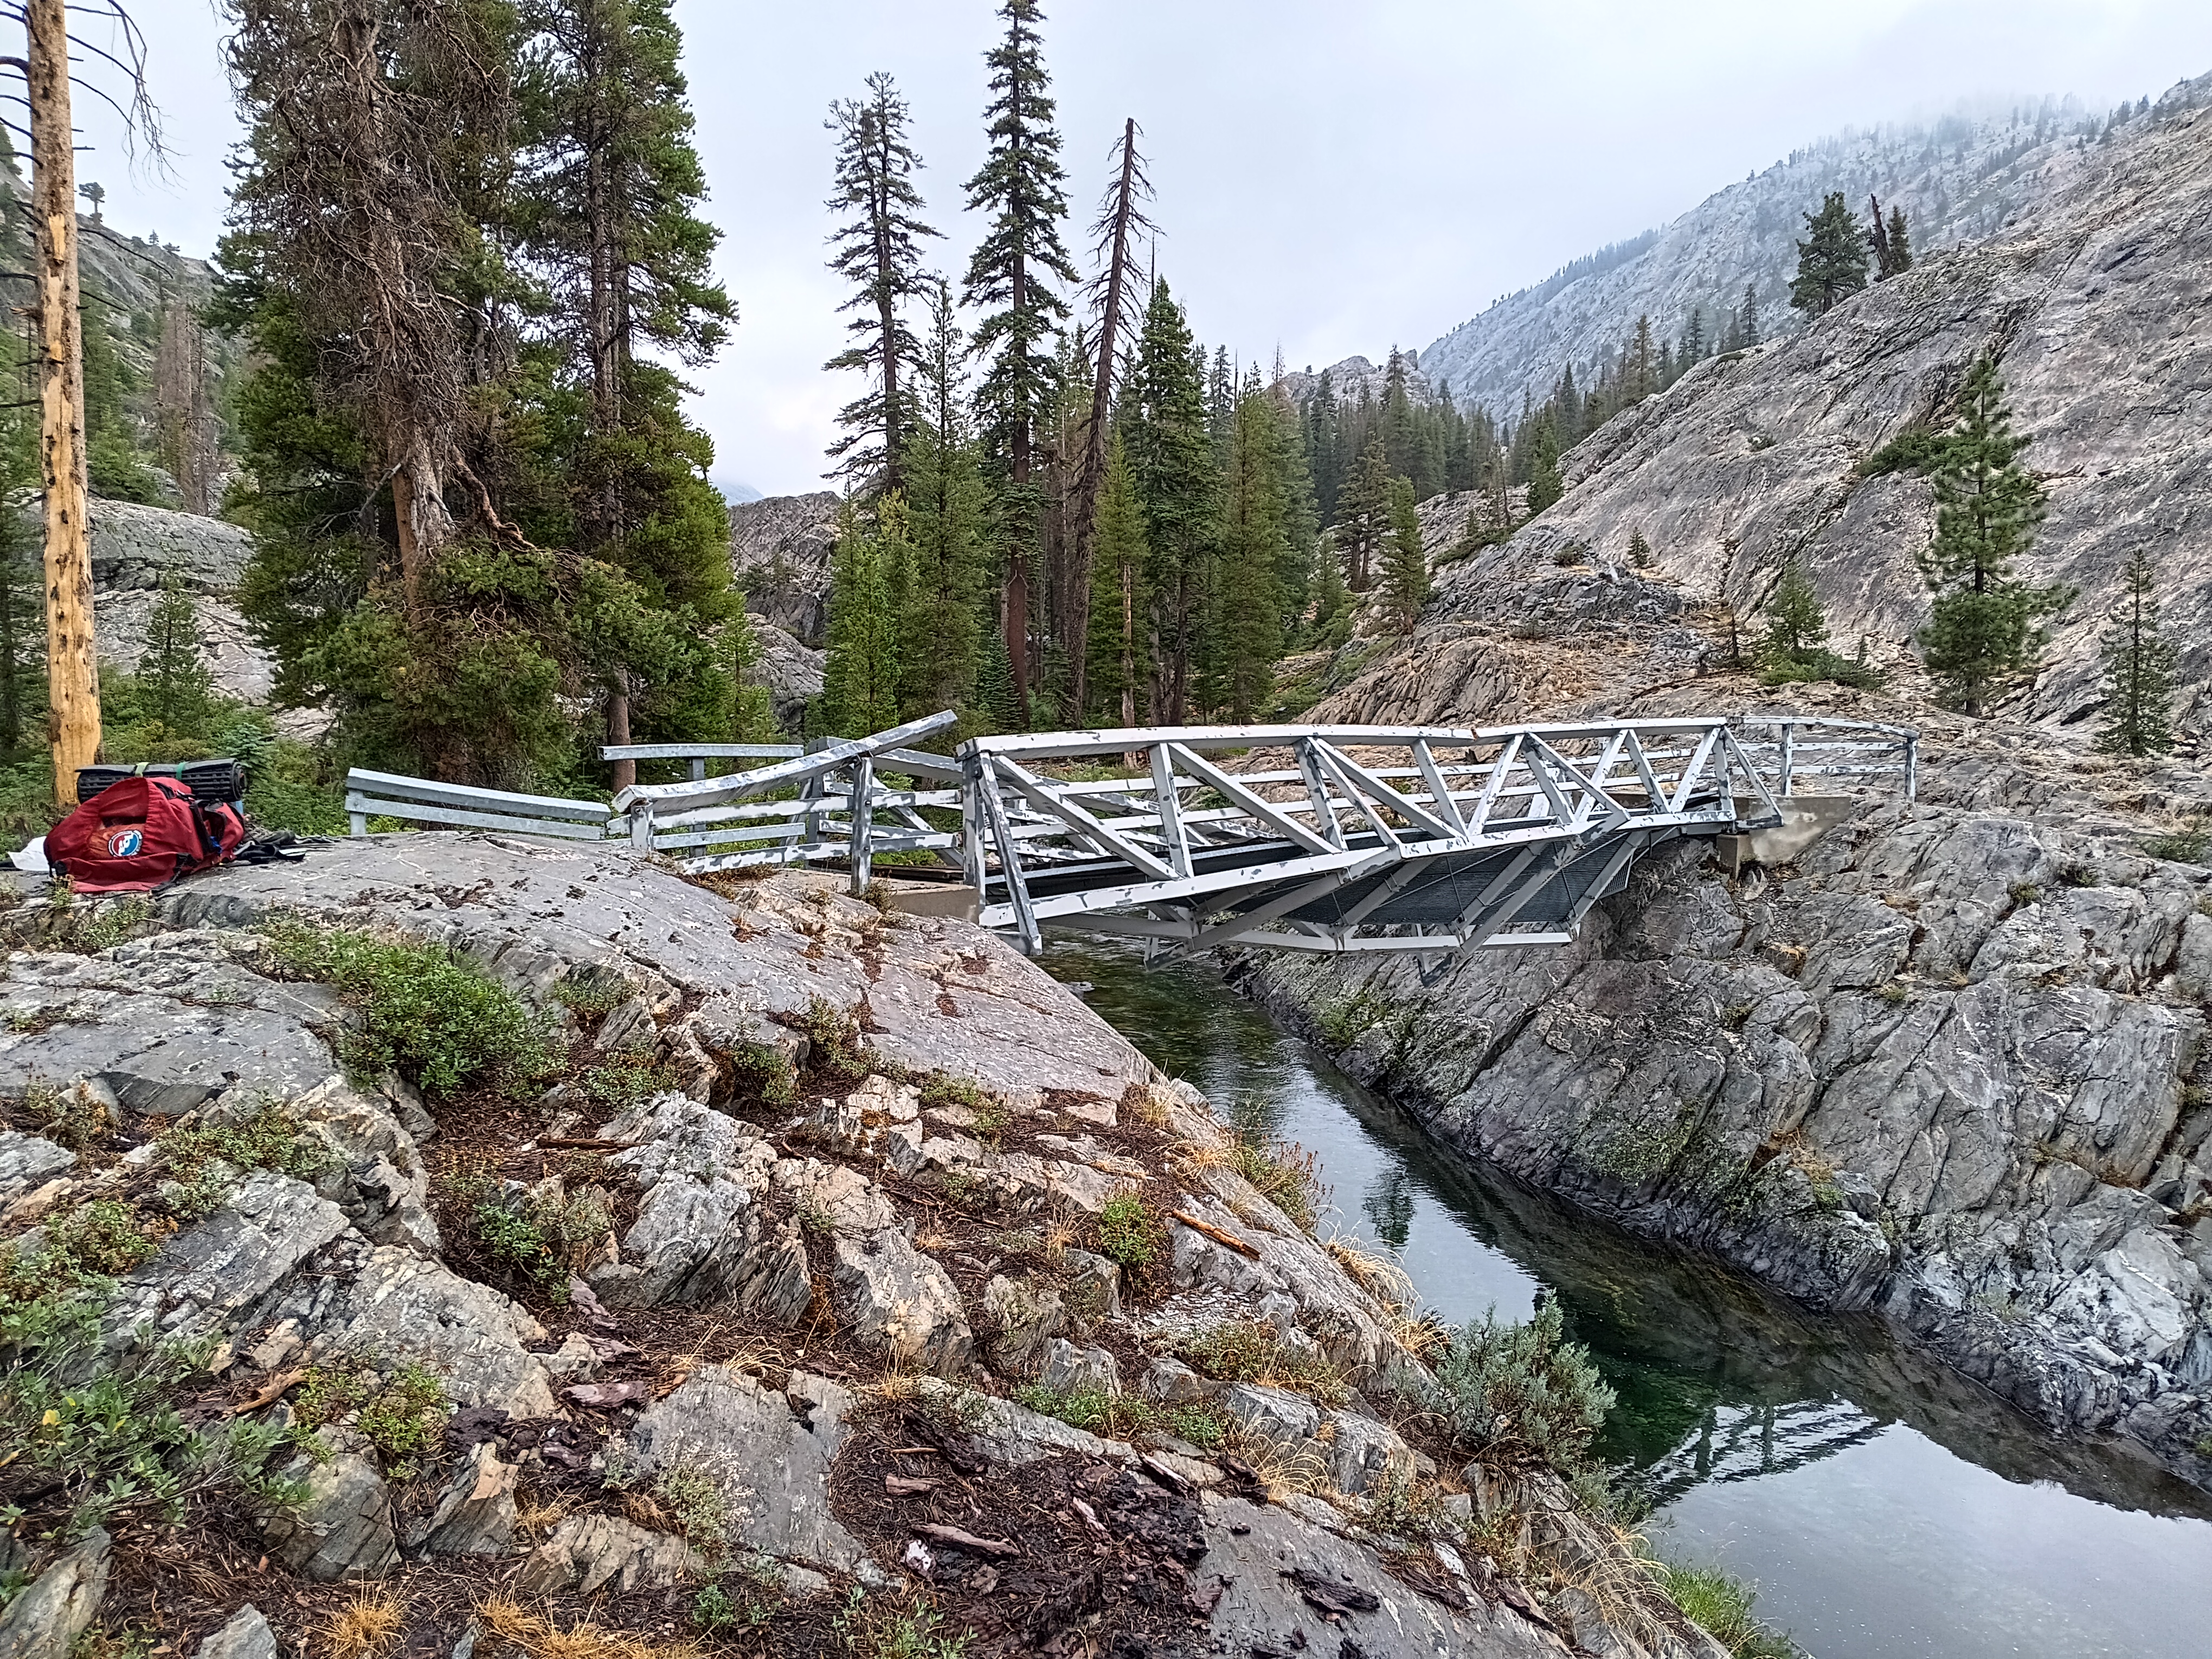
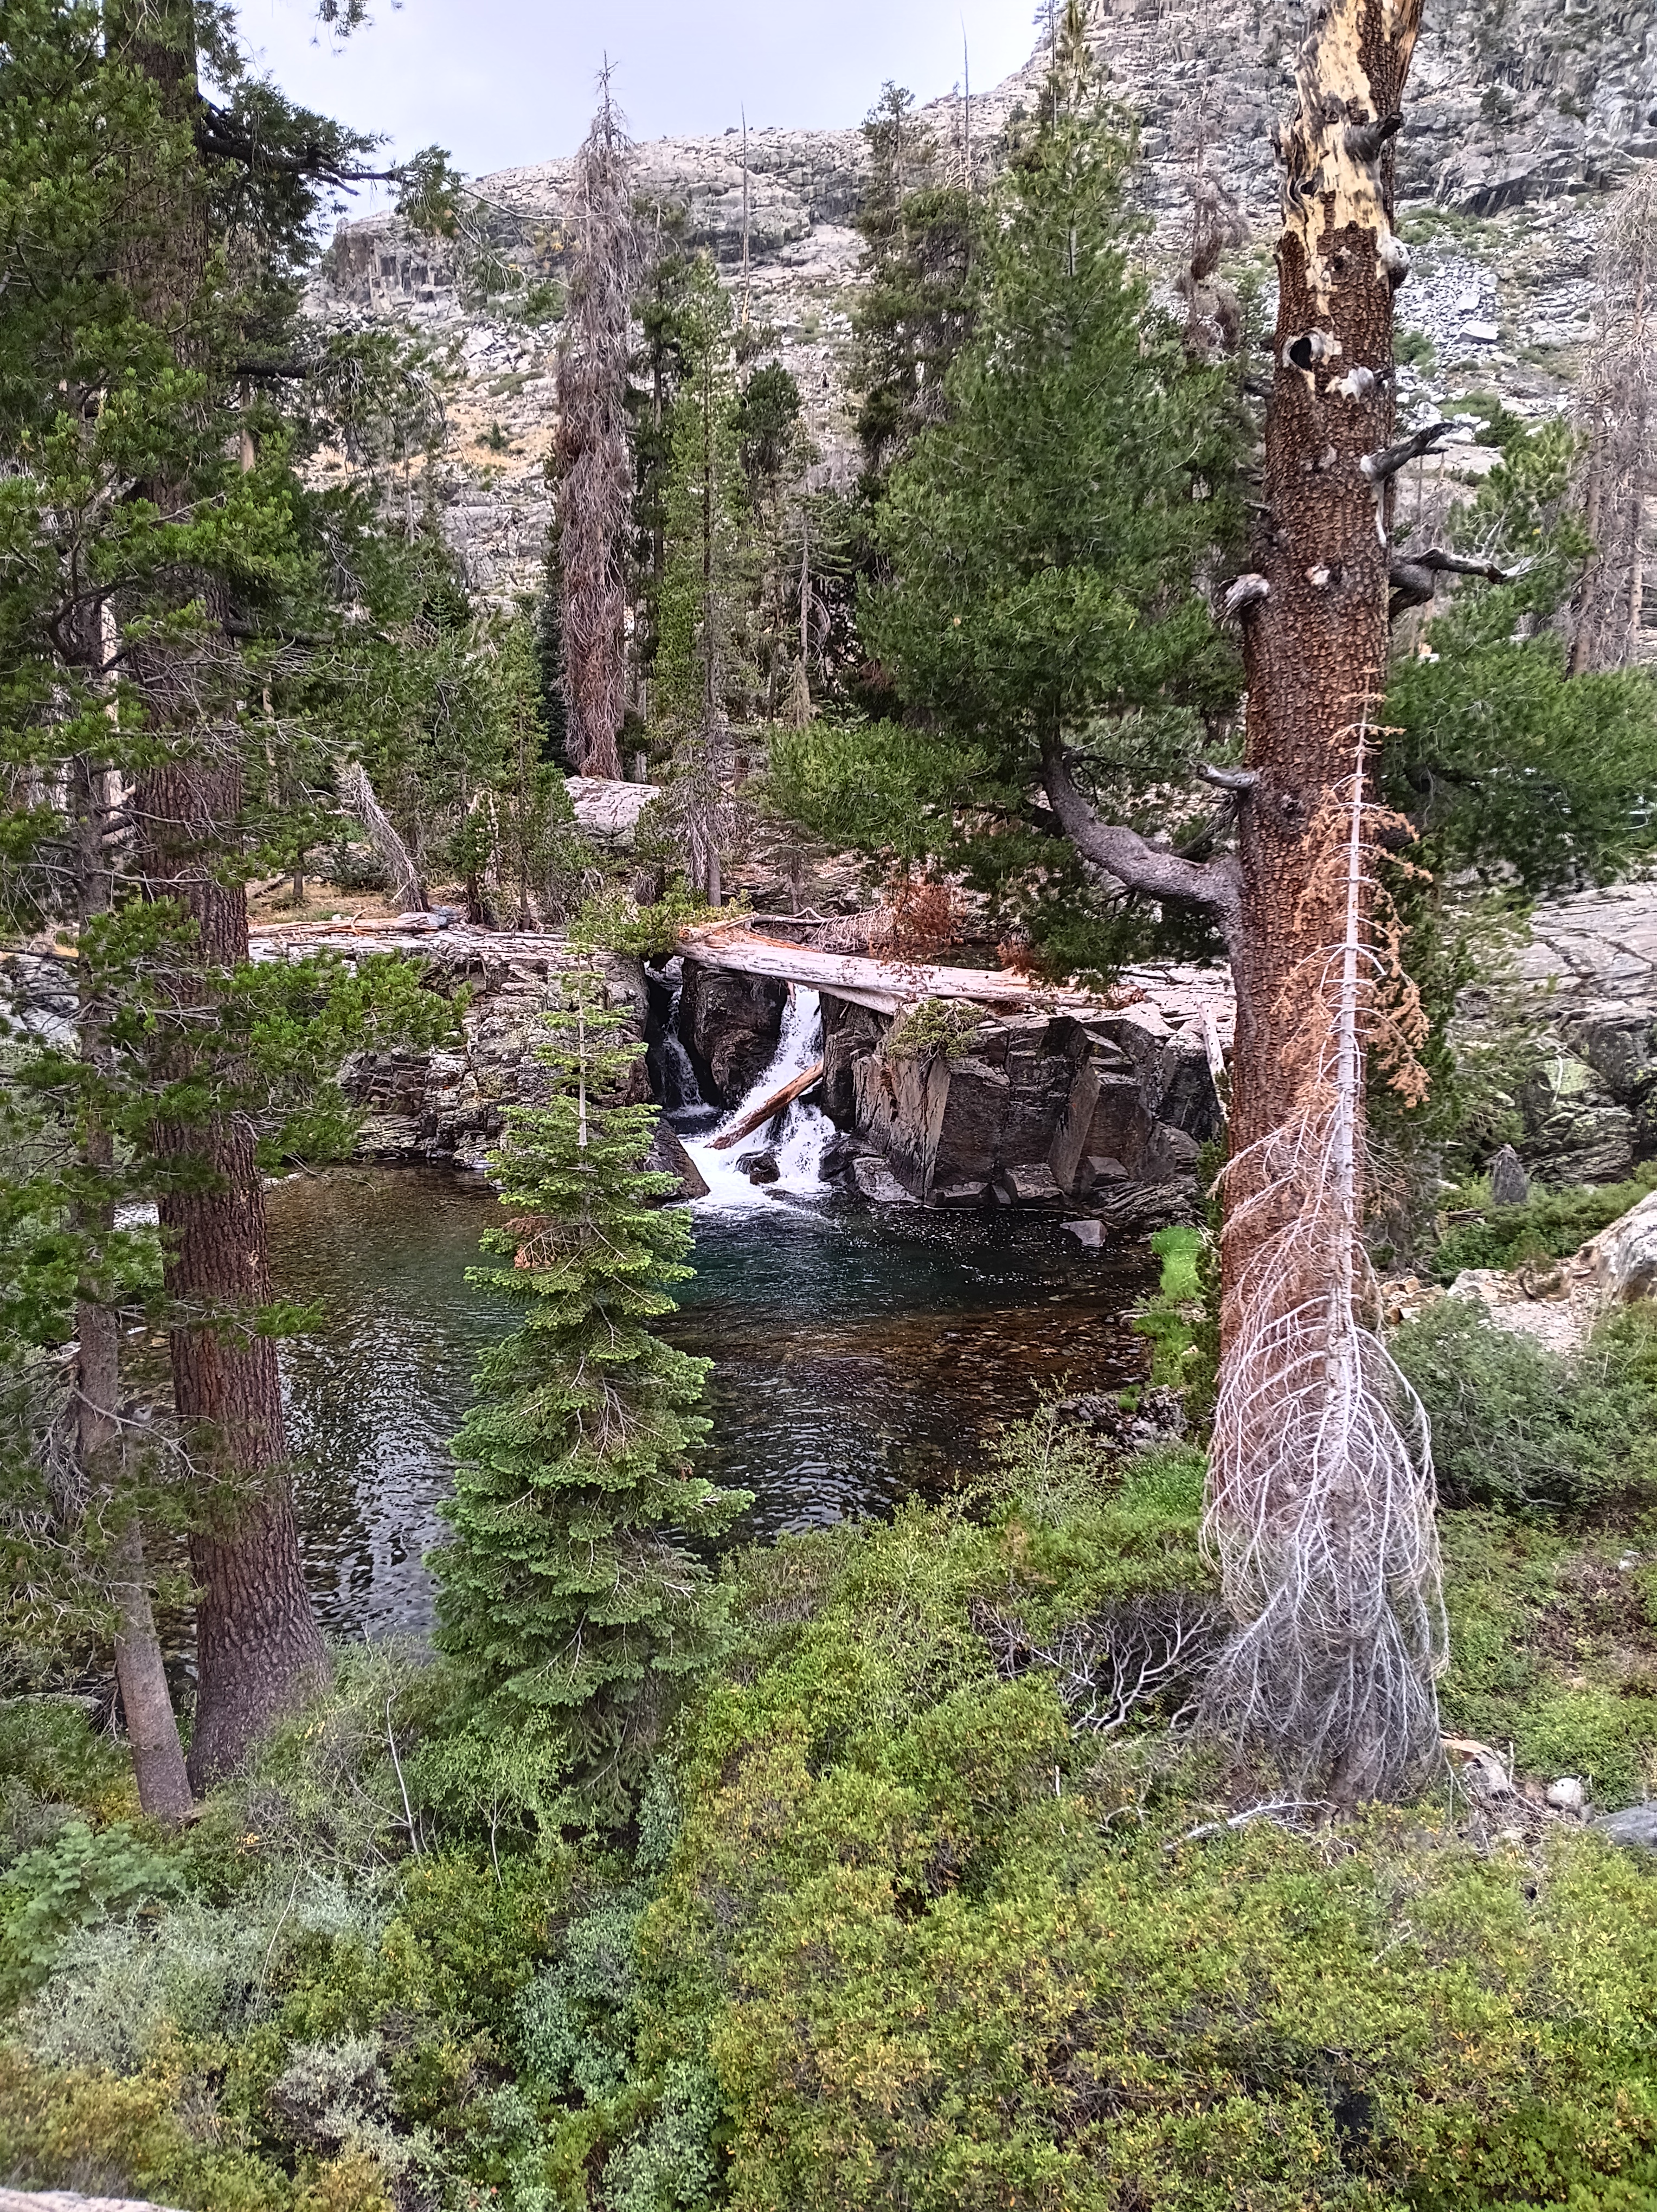
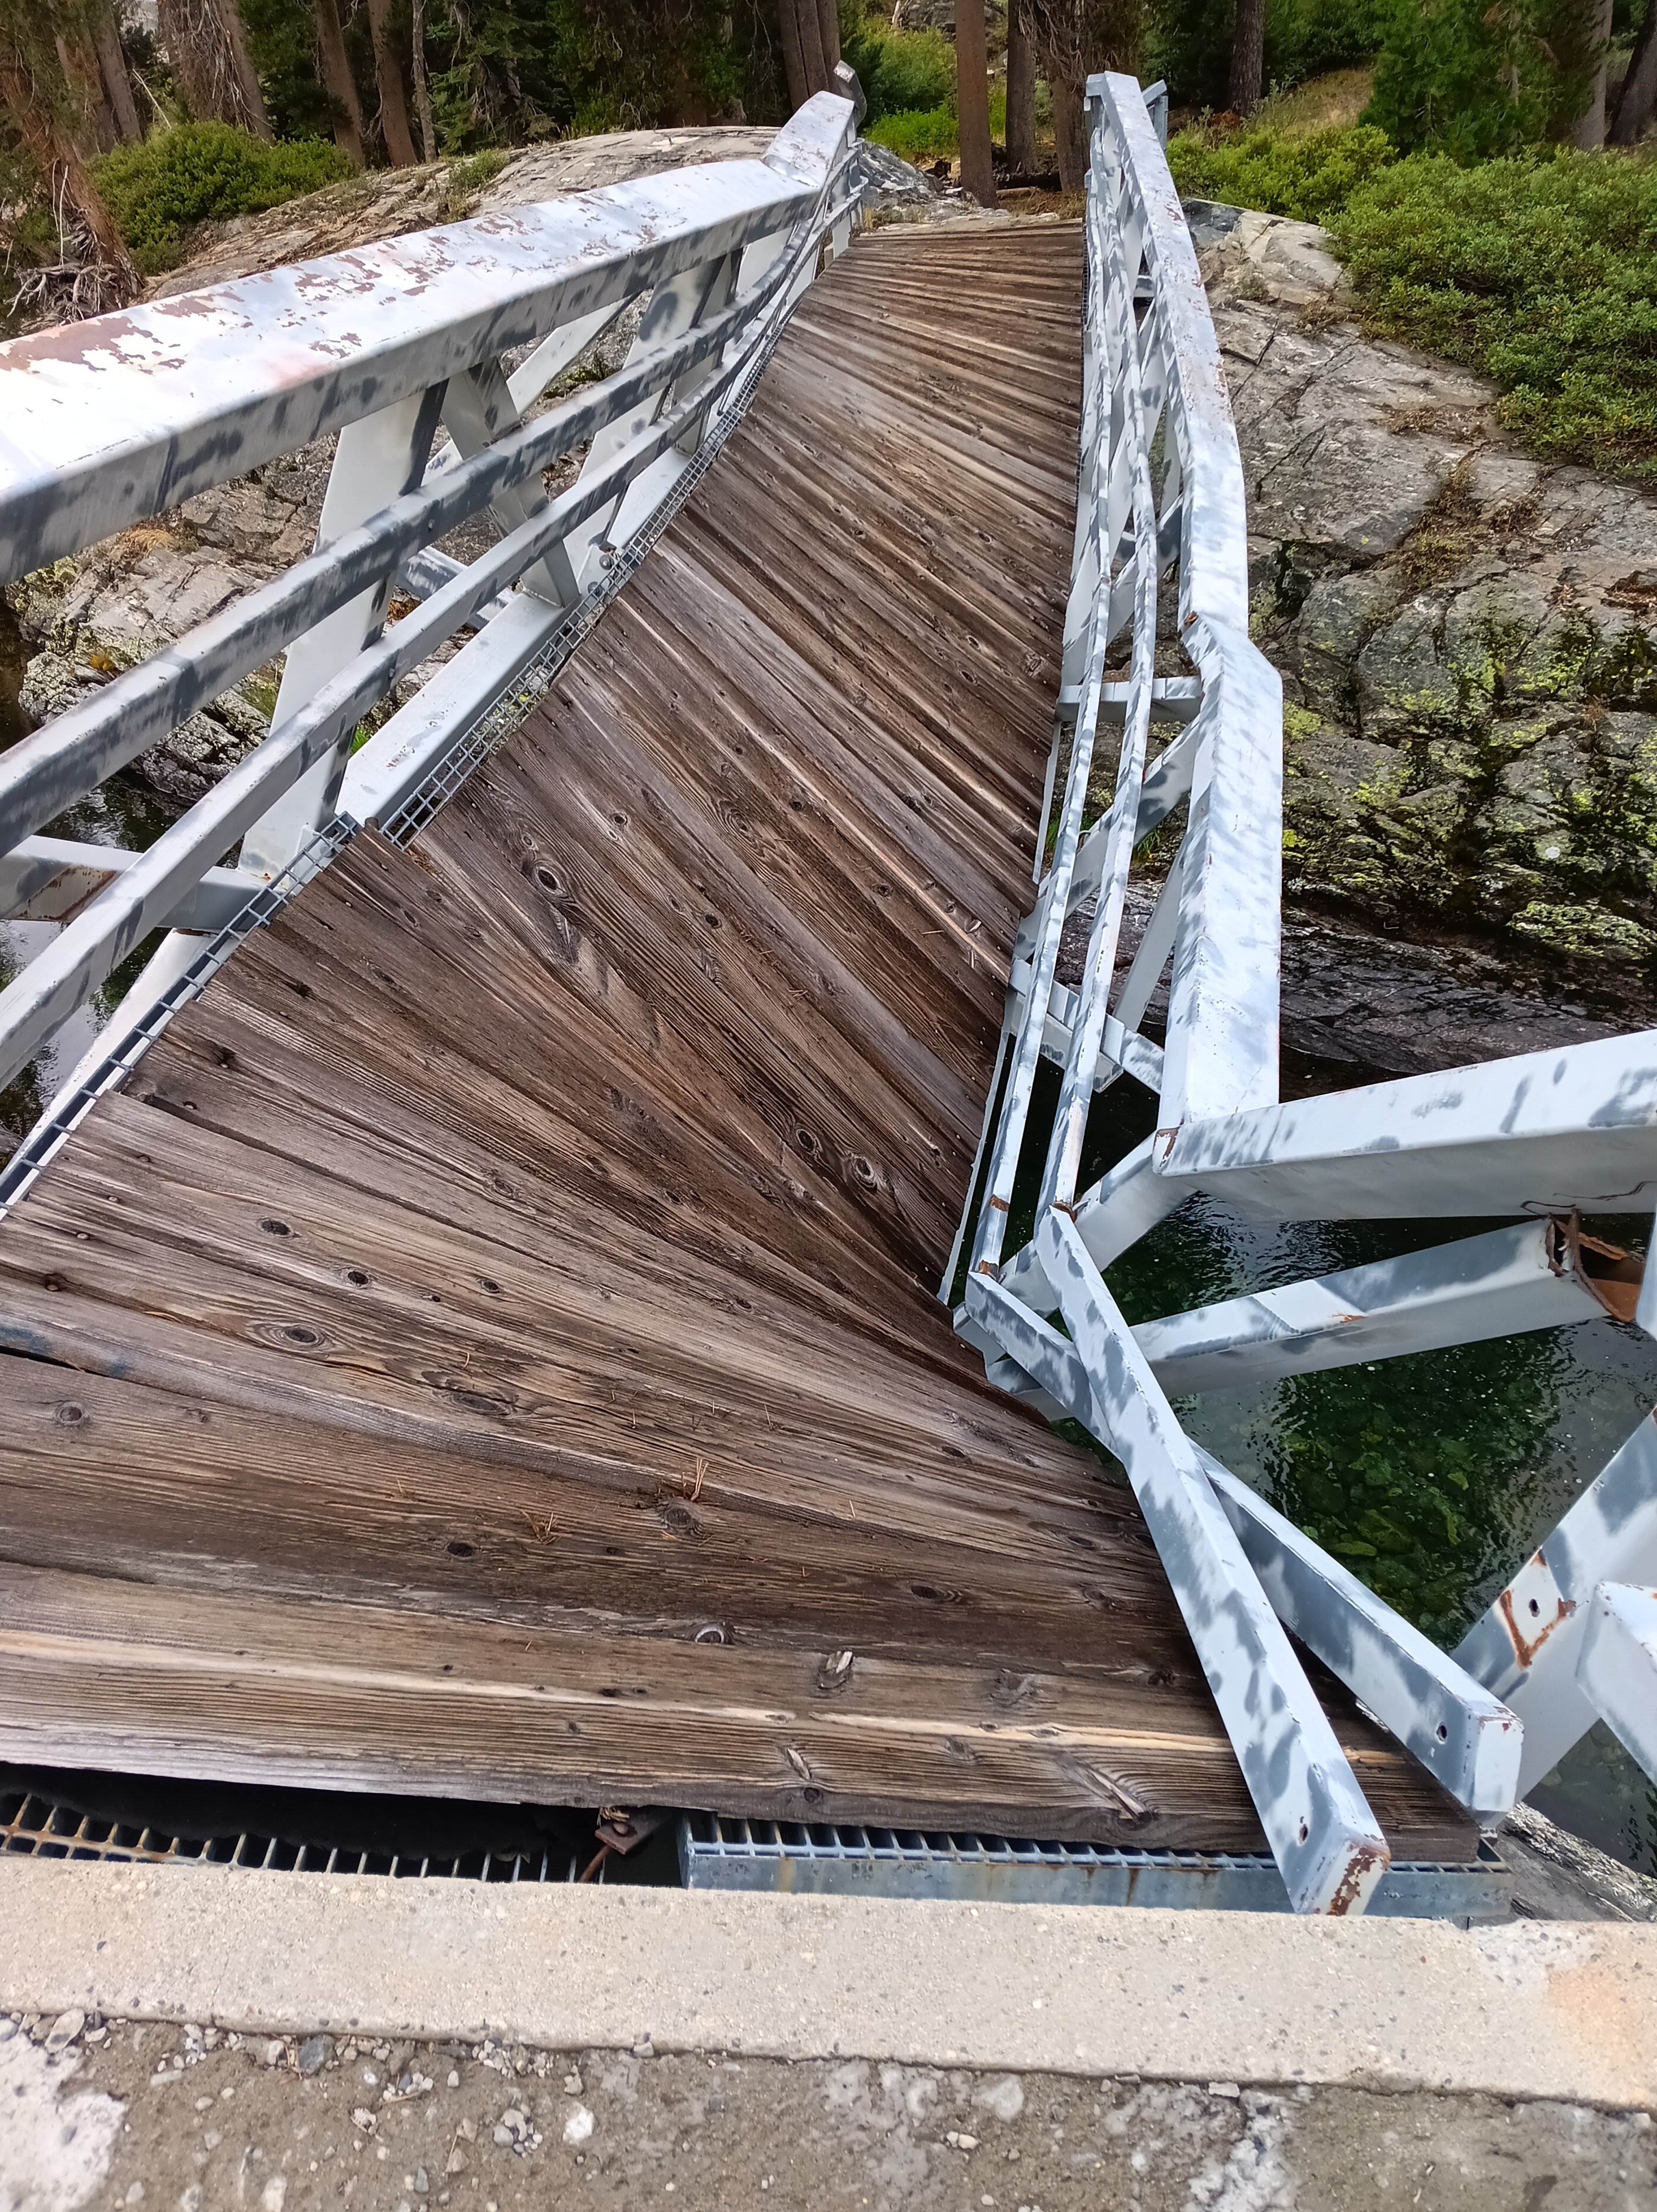
All the above photos are on and along this disappeared “maintained” trail where most trees had burnt in many prior forest fires, the steel bridge over the San Joaquin River at Hemlock Crossing had washed out 2022, and snow, rain, and sleet drenched me. Not the best conditions to navigate by map, compass, and GPS altitude through chest-high, wet brush. Wilderness.
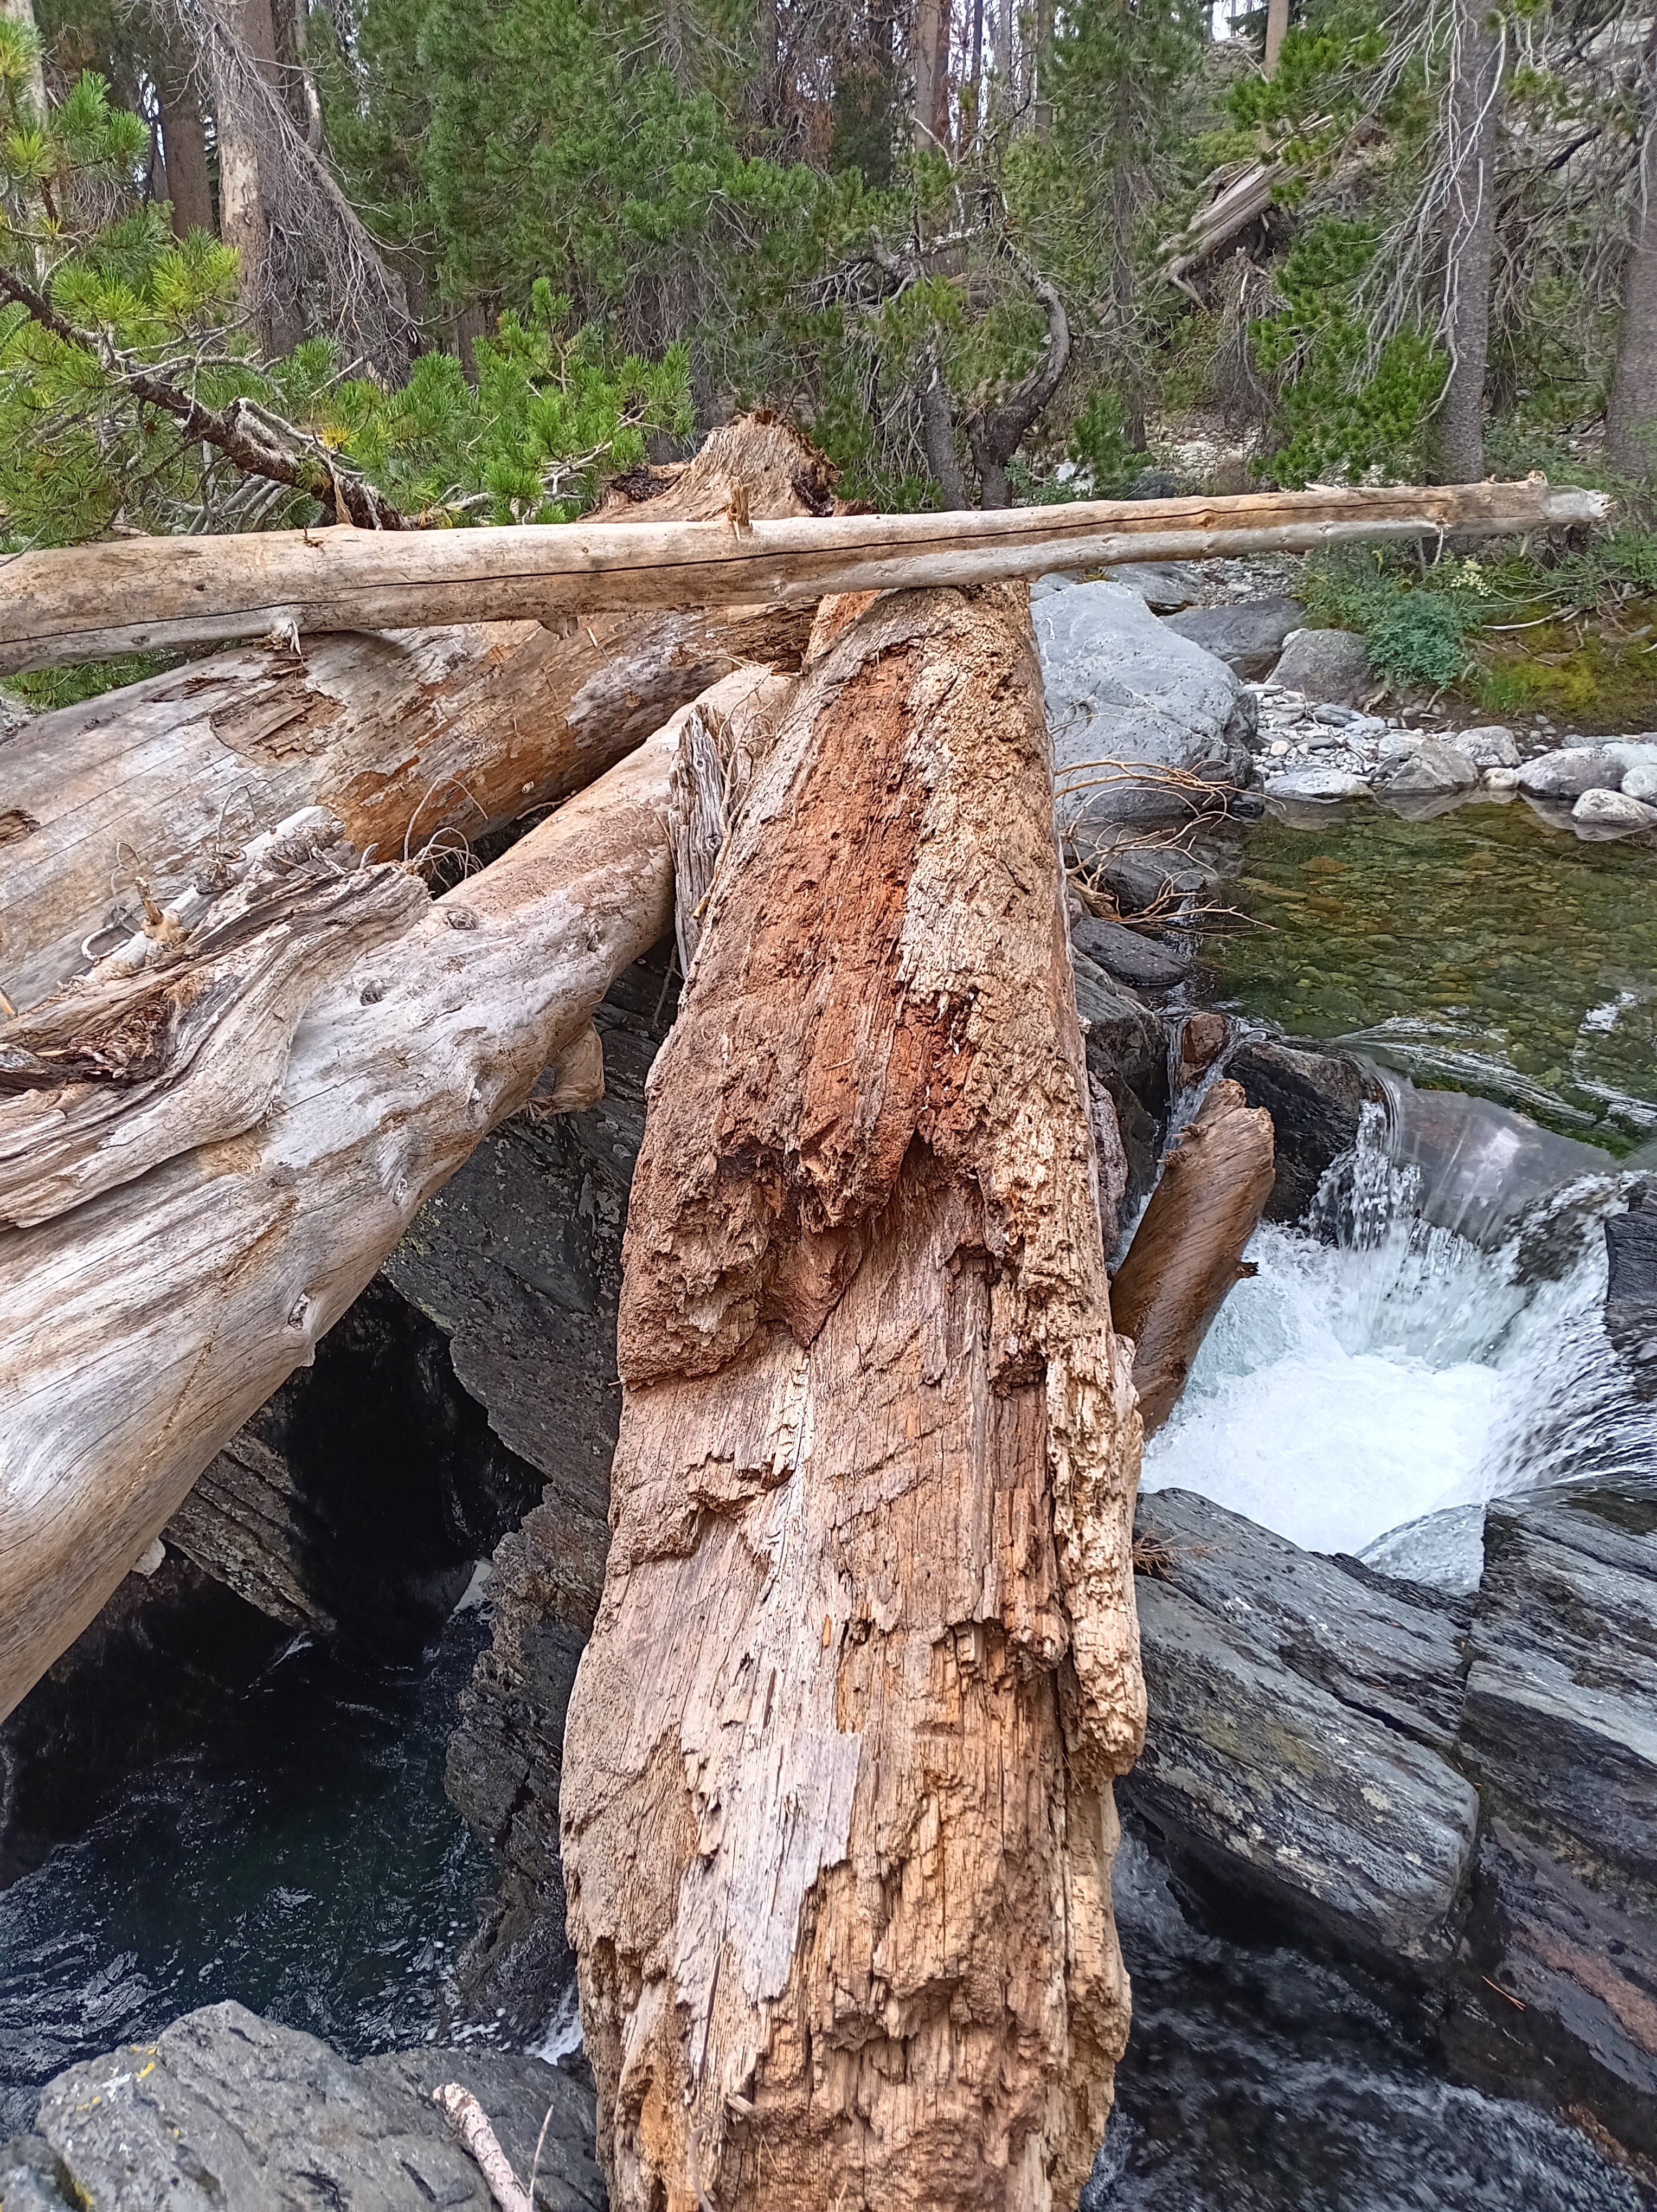
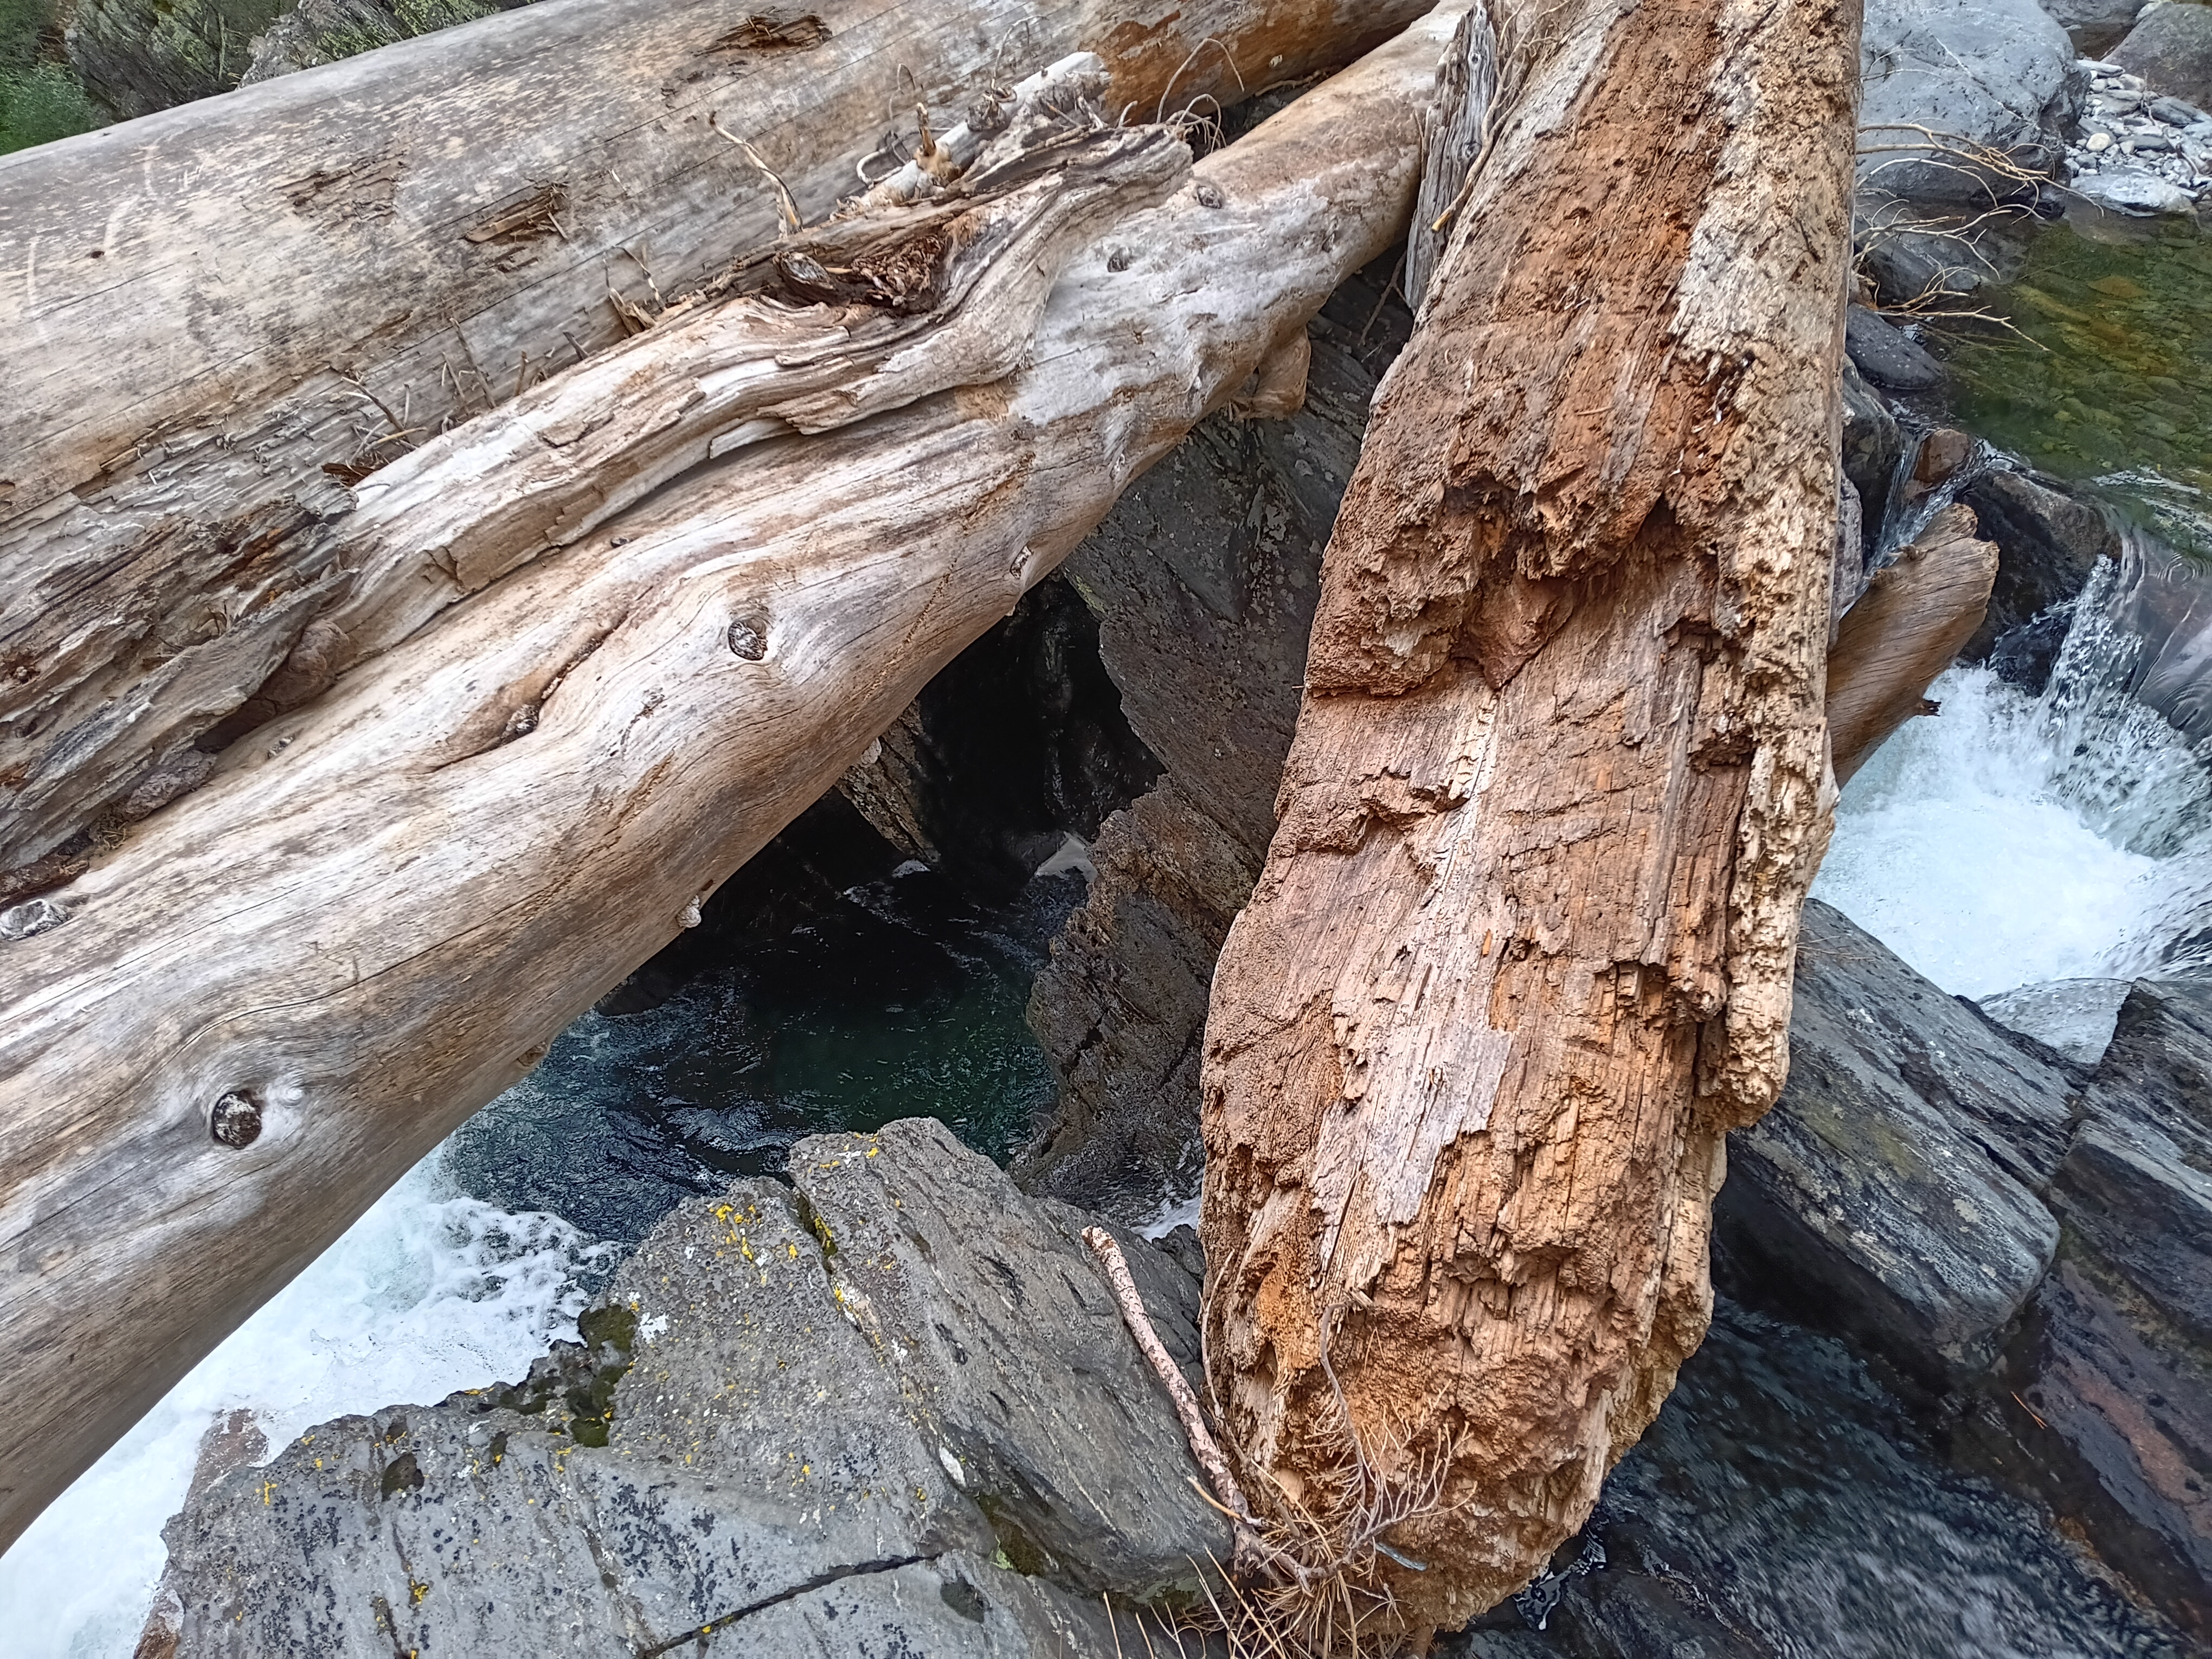
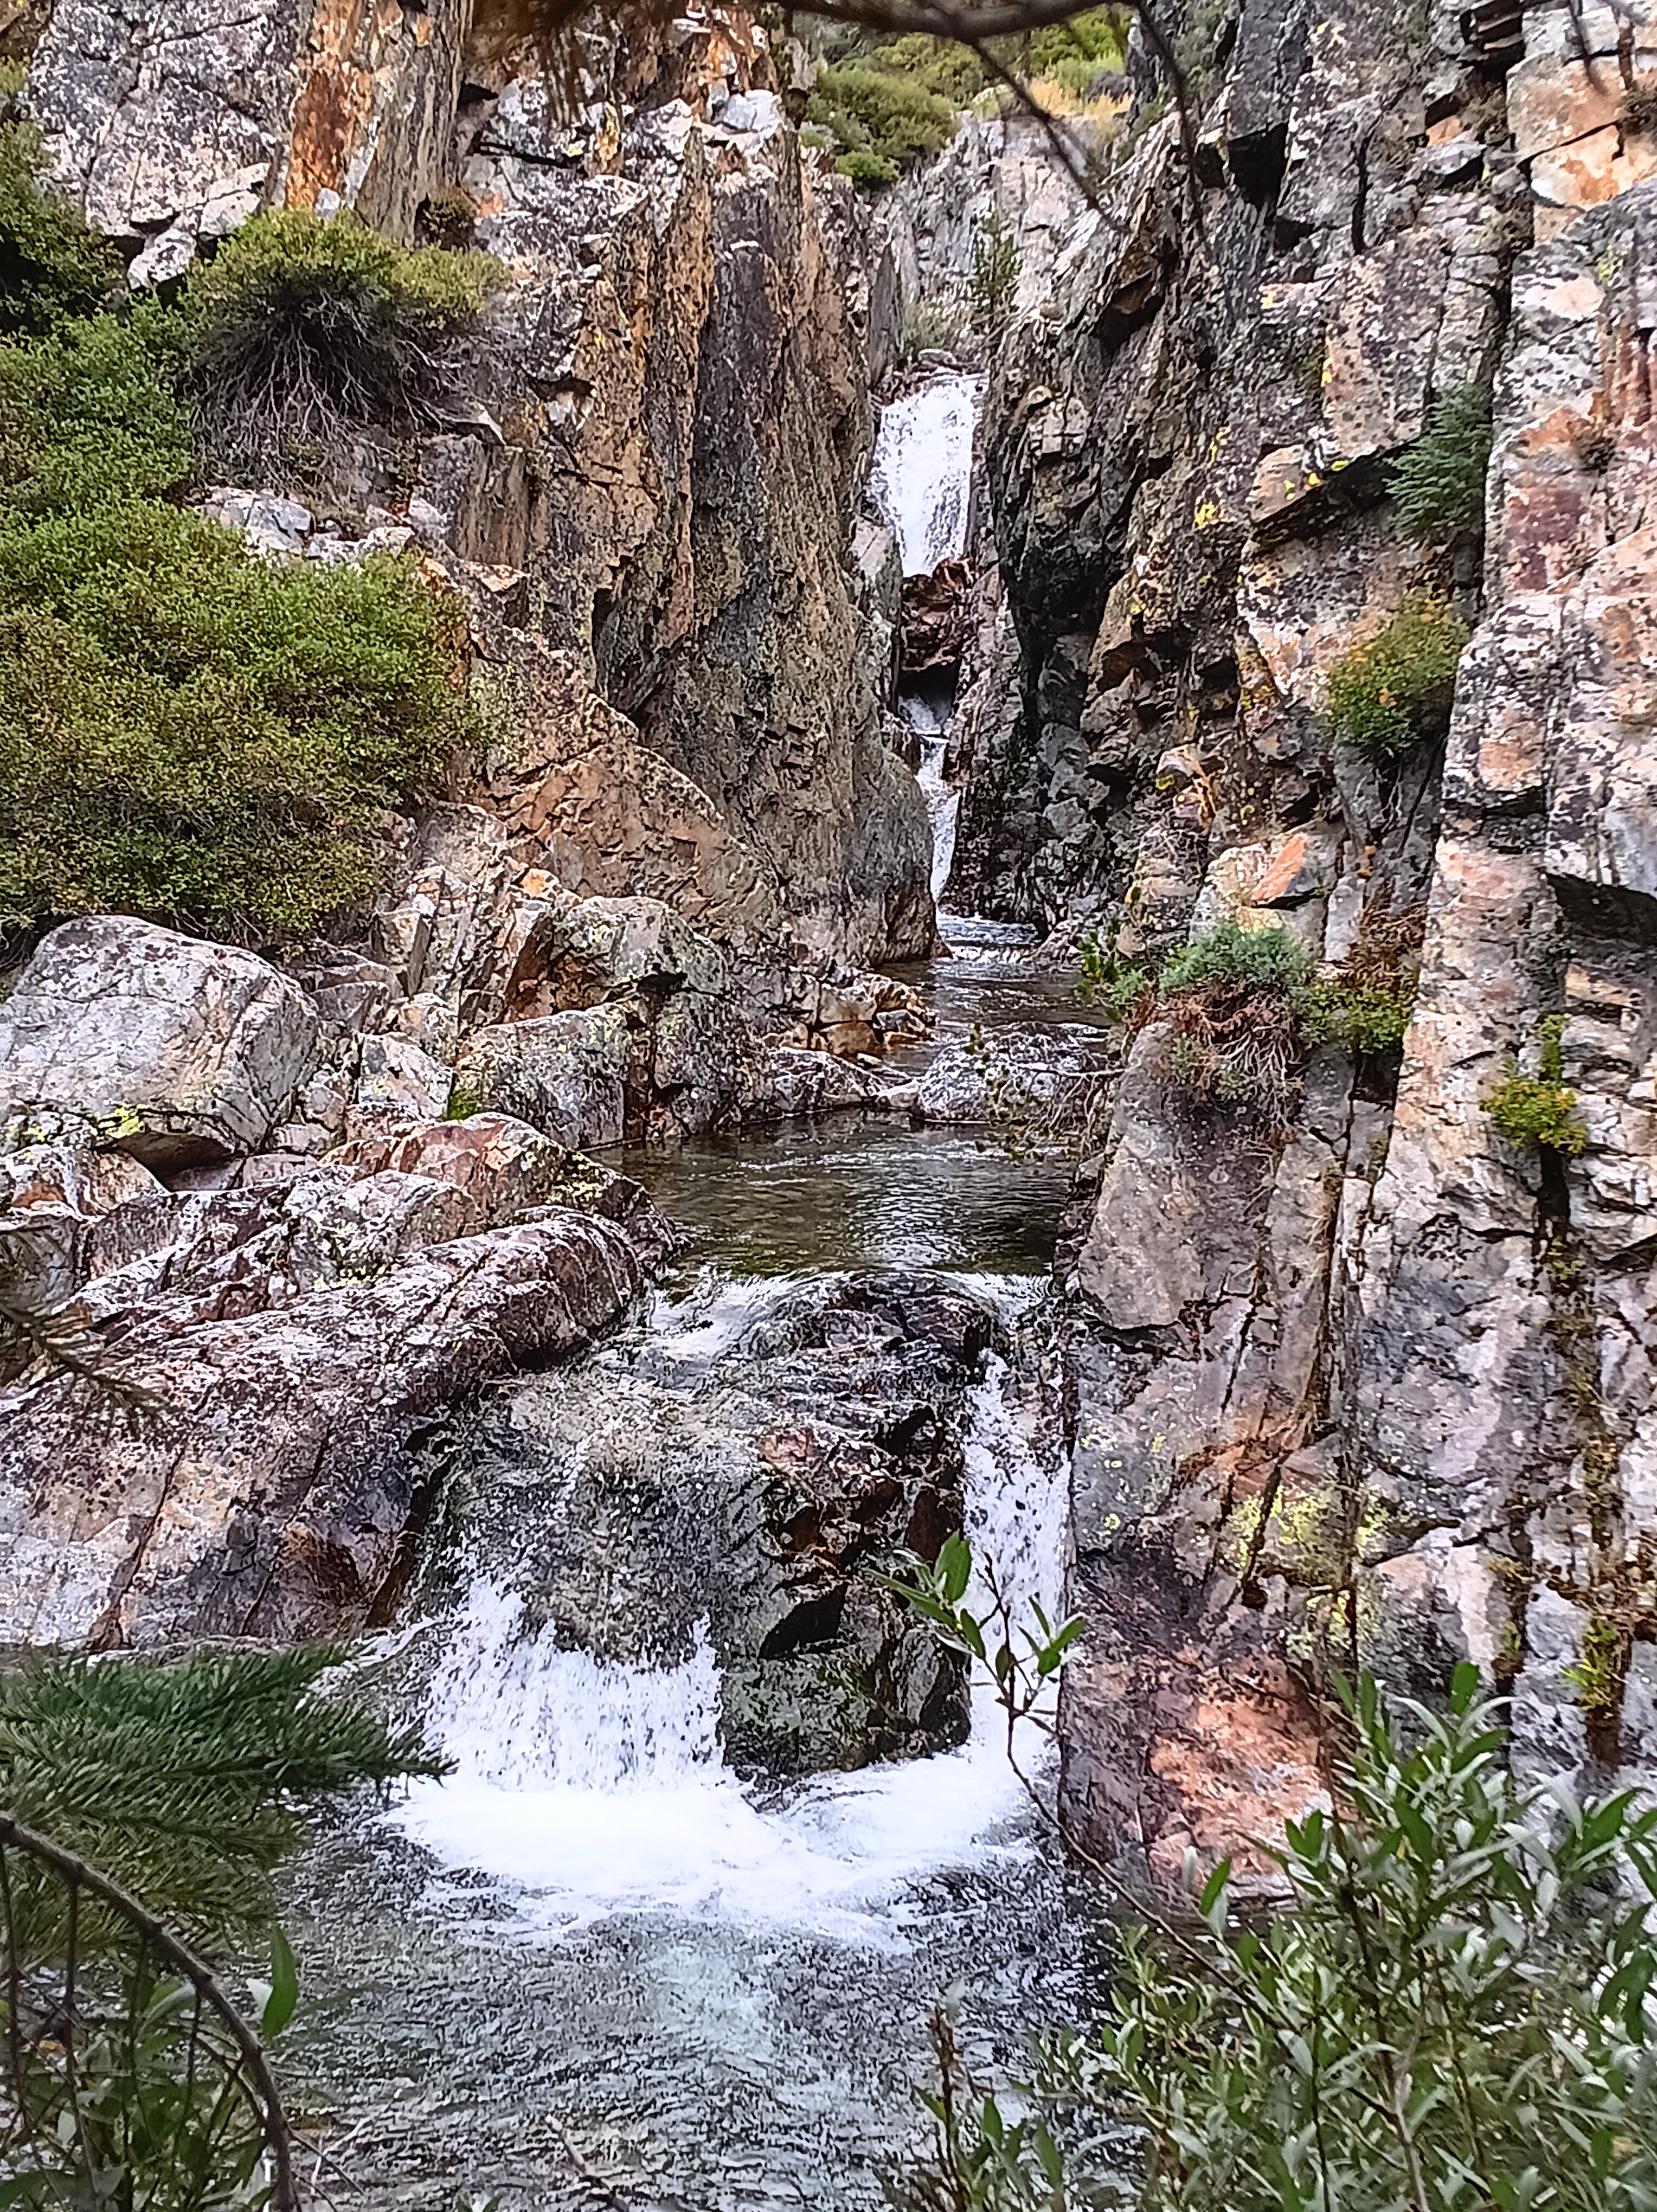
Wet, hungry, and discouraged I reached Hemlock Crossing at noon on Aug.-24, 2024 and discovered its badly damaged bridge. What to do? Rest, eat, and dry out before deciding. Feeling refreshed after a large, warm, hour-long lunch and dry clothes, I decided that the twisted bridge was unsafe to use, but that several logs downstream perhaps offered a better way across the swollen river. Strapping my backpack very tightly to my shoulders, I slid on all fours onto and along two large logs hugging them tightly. A climb over a smaller log lodged across the two larger logs was an added challenge (see photo below top left). This “bridge” was above a 20 feet waterfall downstream and a deep pool of water on the upstream side. I cried on the other side happy to be alive.
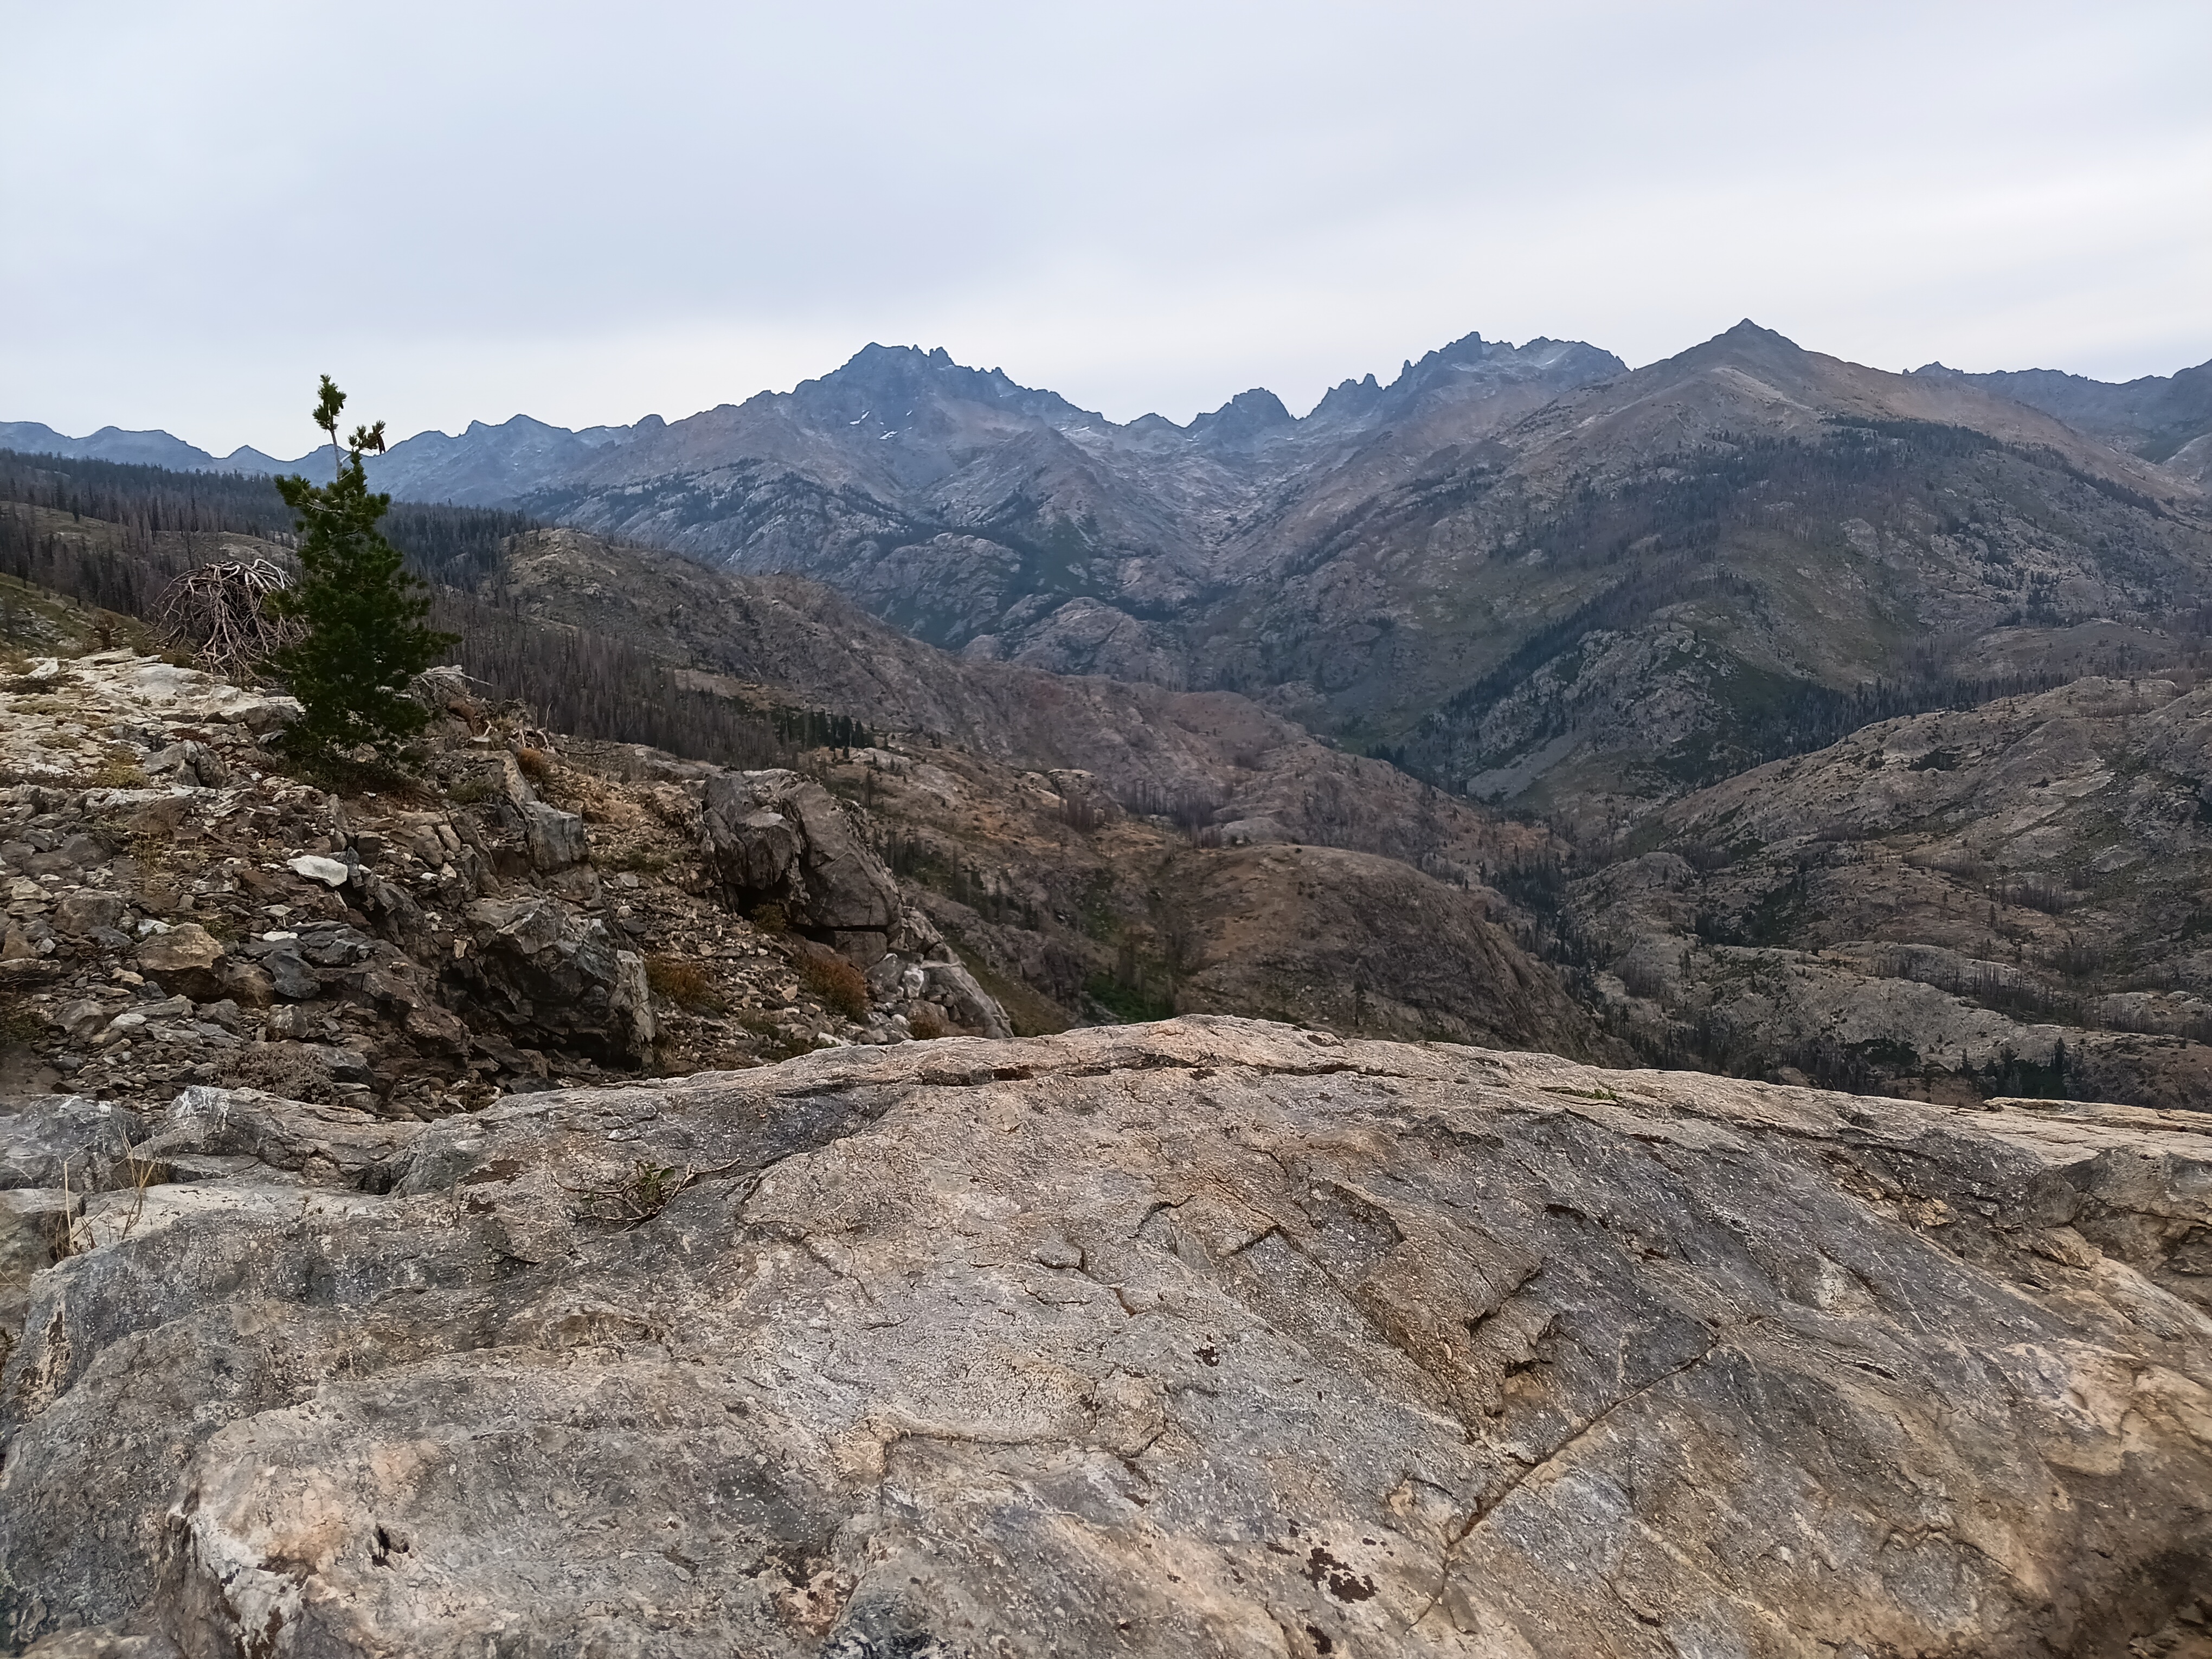
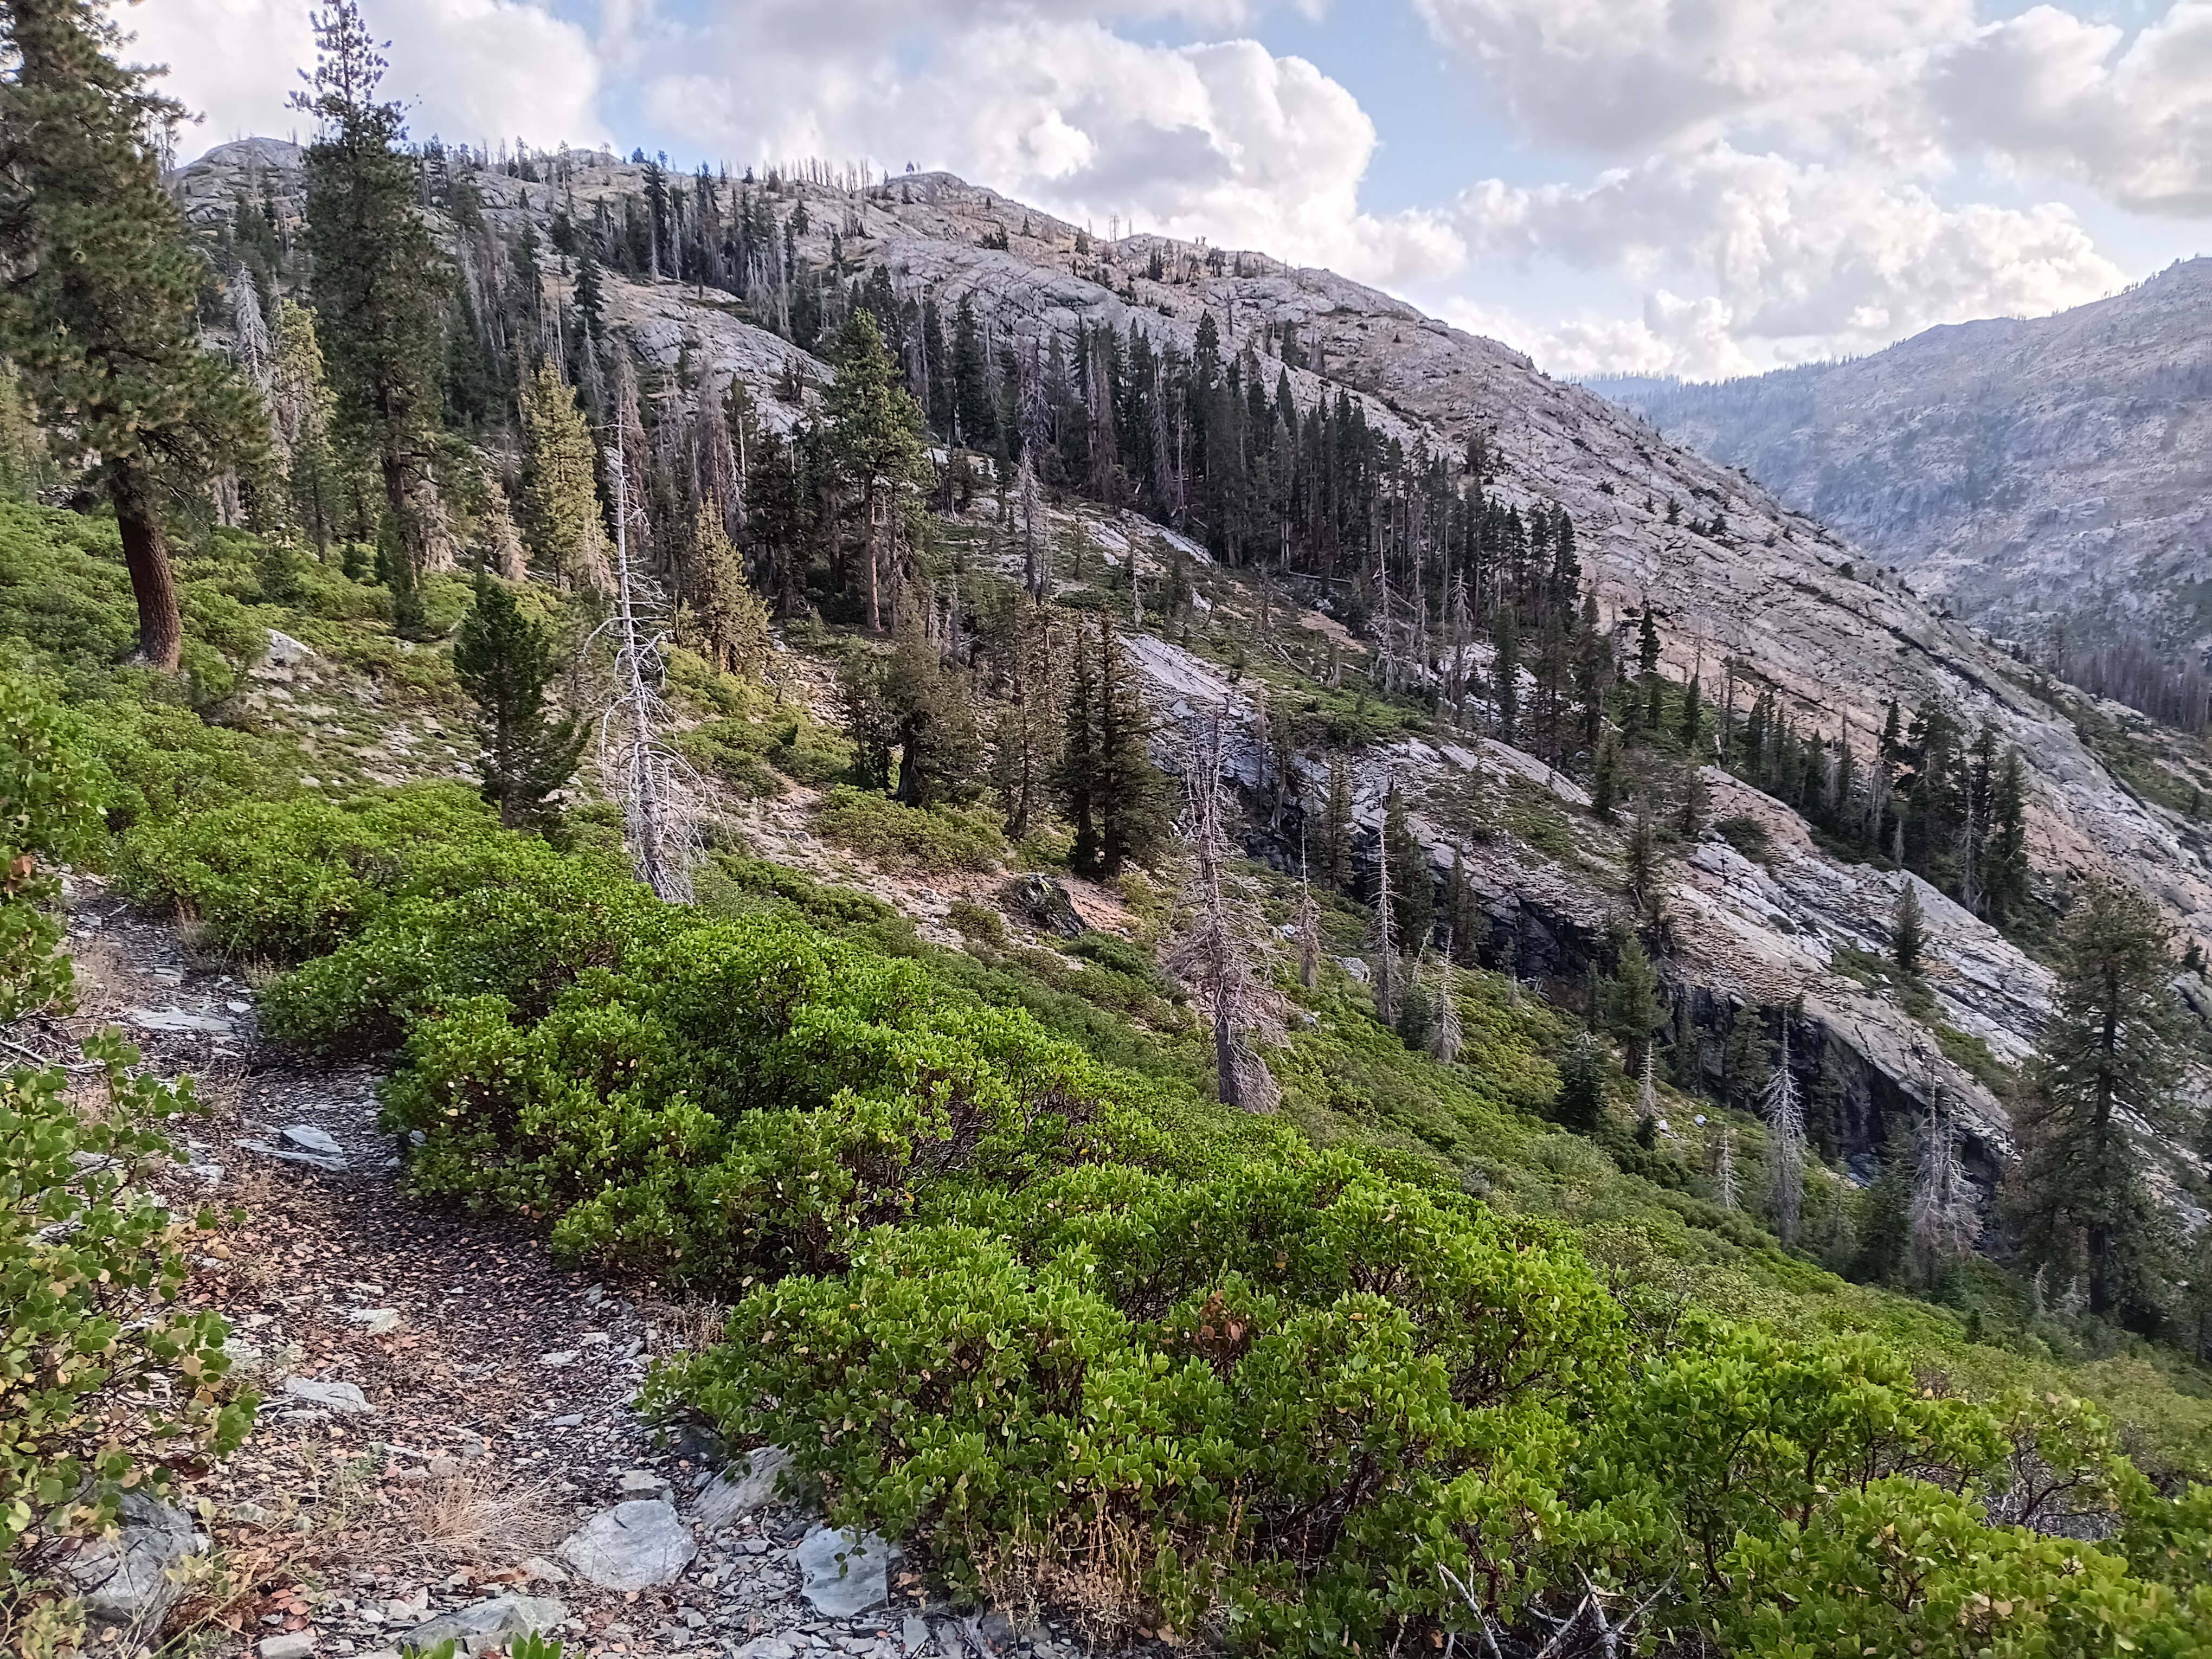
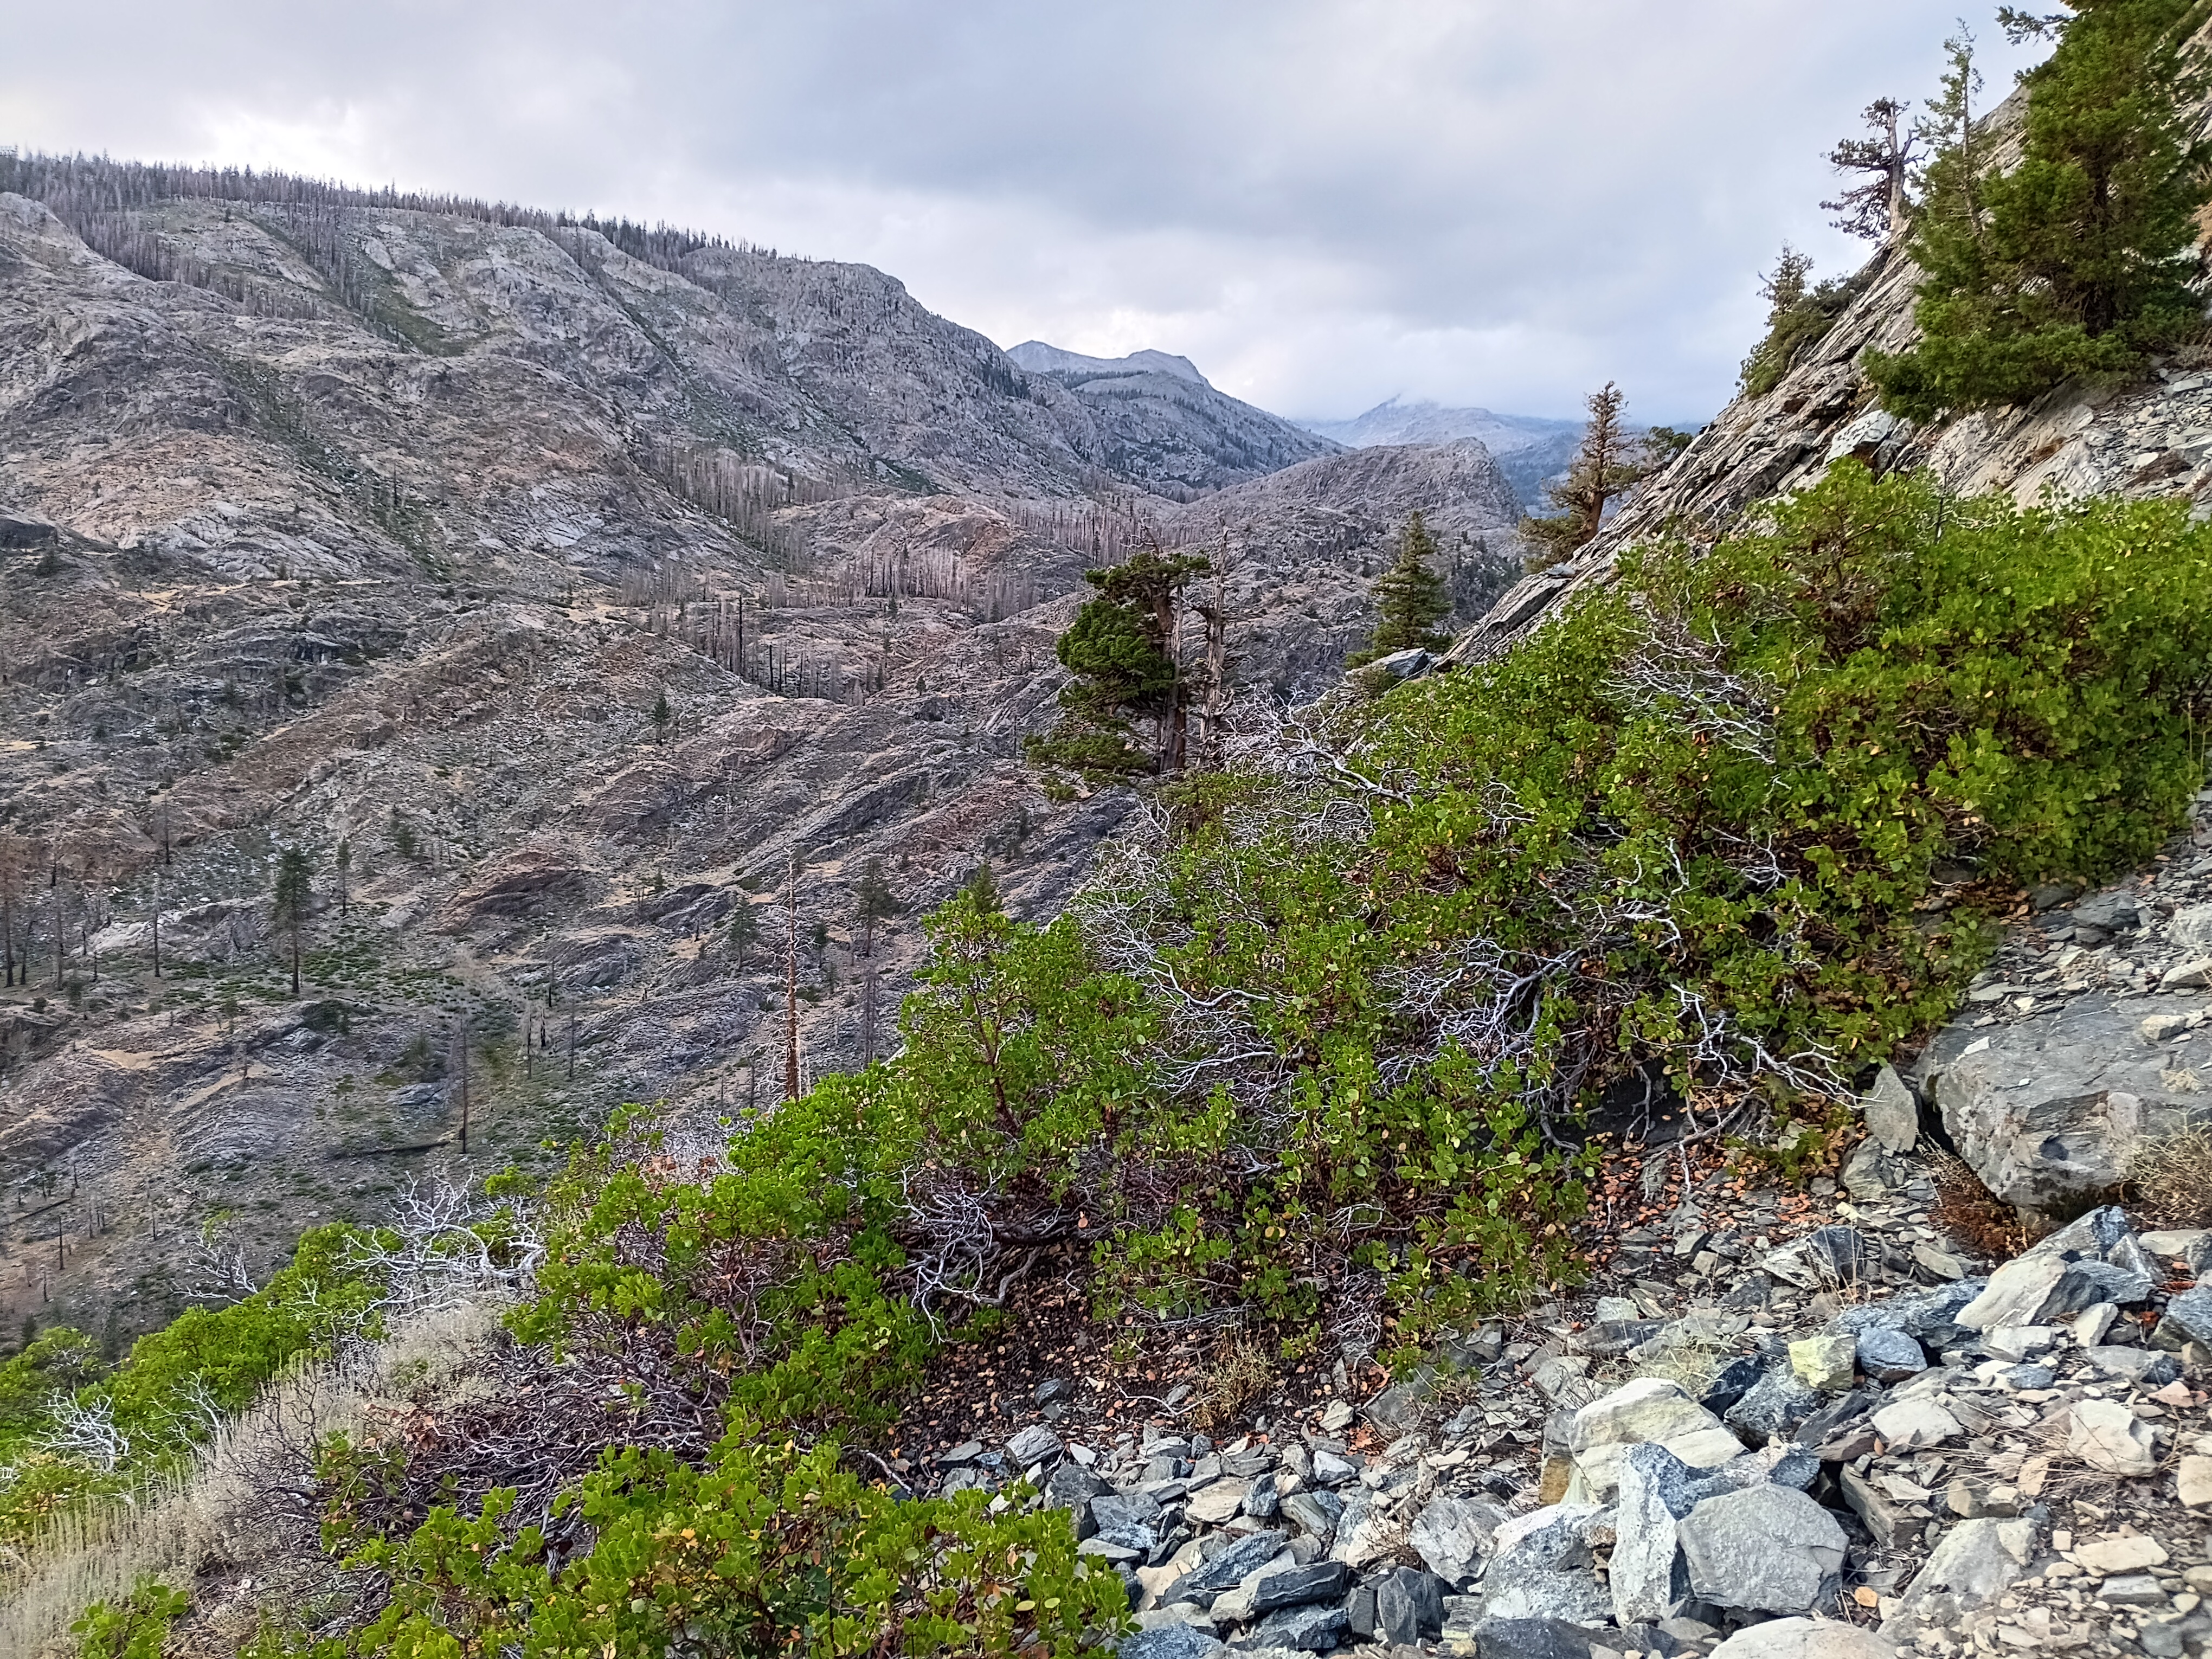
Furthermore, there was a trail on the eastern side of the San Joaquin heading both north towards Bench Canyon and Lake Catherine below Ritter and Banner Mountains and heading south towards Mammouth Lakes where I headed, but again I was soon on my own again without a trail. The path looks pretty clear on the map along a steeply sloping V-shaped valley near the 7,460′ contour, but where my boots hit the ground along this contour were just walls of brush, meadows, overgrown puddles of water, rocks, fallen logs. At one point I dropped my back-pack to move up the slope to 7,700′ to reconnoiter to find a path forward. There was none for 4 hours until I reached Iron Creek where I stayed for the night (Camp #16).
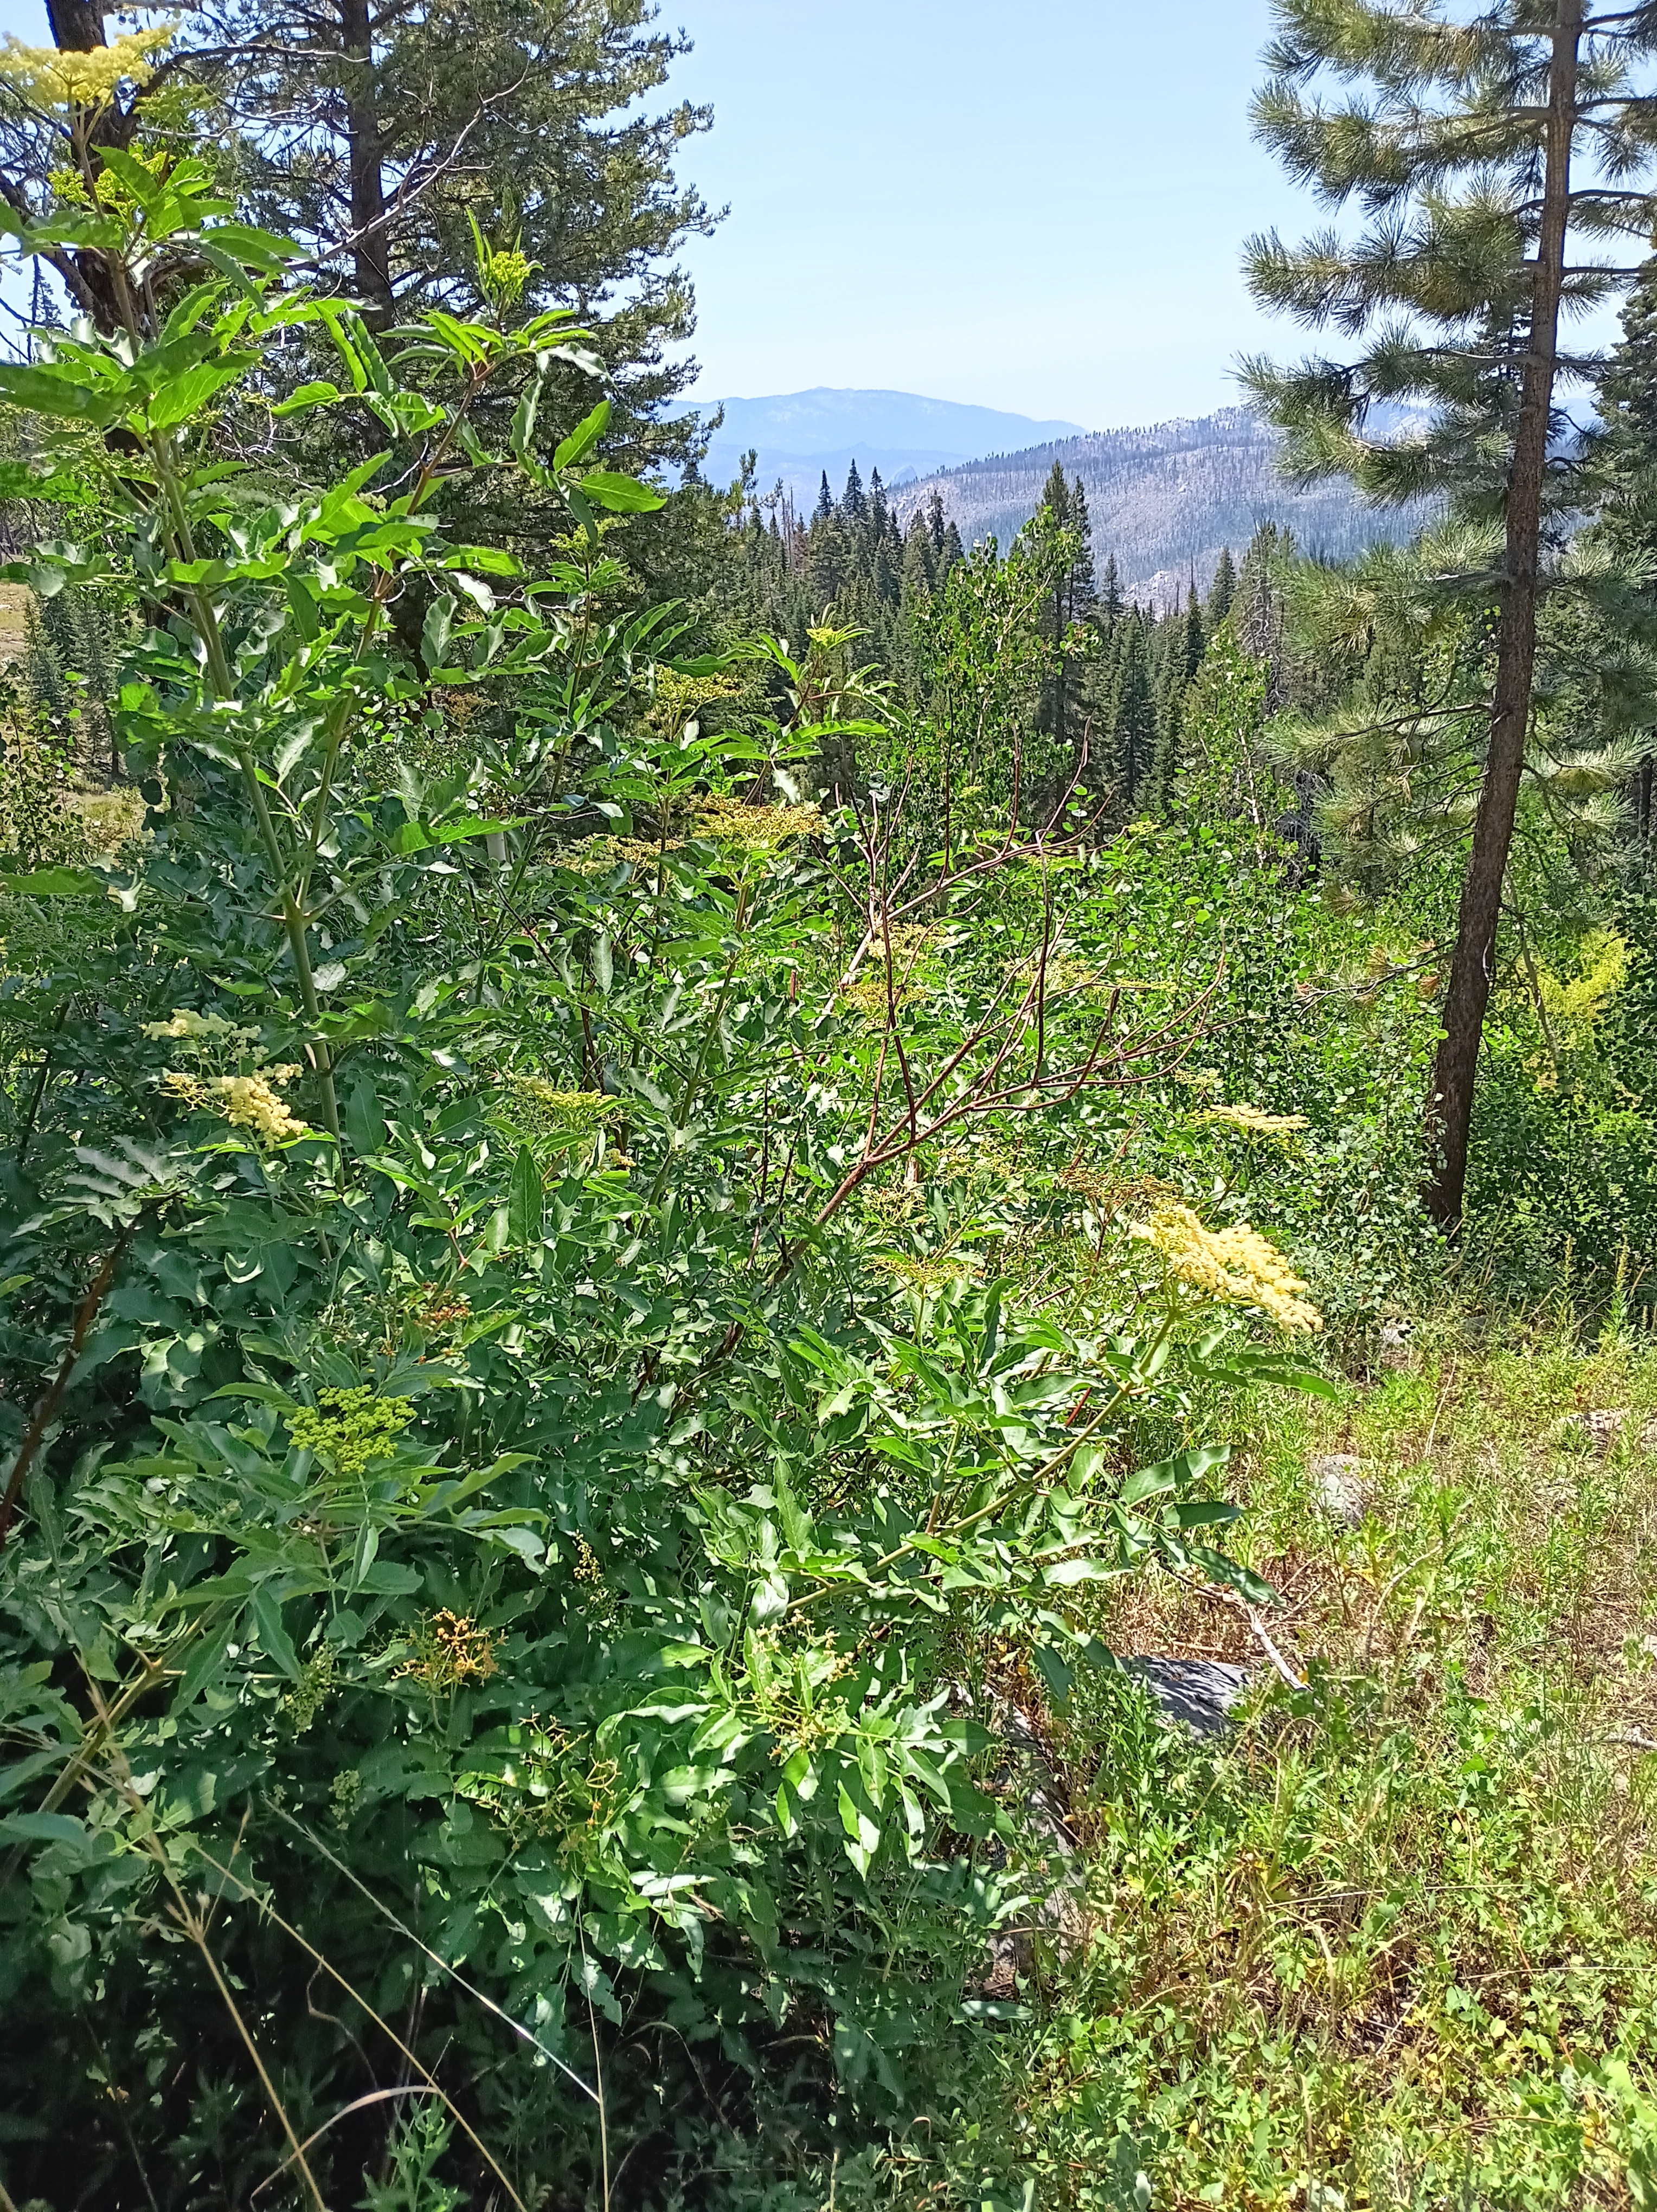
The sun emerged again the next day (Aug.-25), but the trail disappeared again within an hour from camp, but now I was in a dry forest that had not been burnt too badly and the map told me to go uphill. I did so for most of the day getting away from the treacherous San Joaquin River. Trouble awaited only in the meadows as here the terrain was wet, level, and overgrown with brush. My spirits lifted, however, when I noticed wild Elderberries. The photo above (bottom left) shows their blossoms, but later I found big, dark, black elderberries that I devoured after cooking them. The names of the meadows in the forest without a trail invoked emotions, too, such as “Naked Lady Meadow” followed by “Earthquake Meadow” followed by “Headquarters Meadow” followed by “Corral Meadow” followed by “Cargyle Meadow” before I reached a meadow without a name at the end of the day. These names tell me that people traveled and lived here in the past. There probably are stories that I do not yet know.
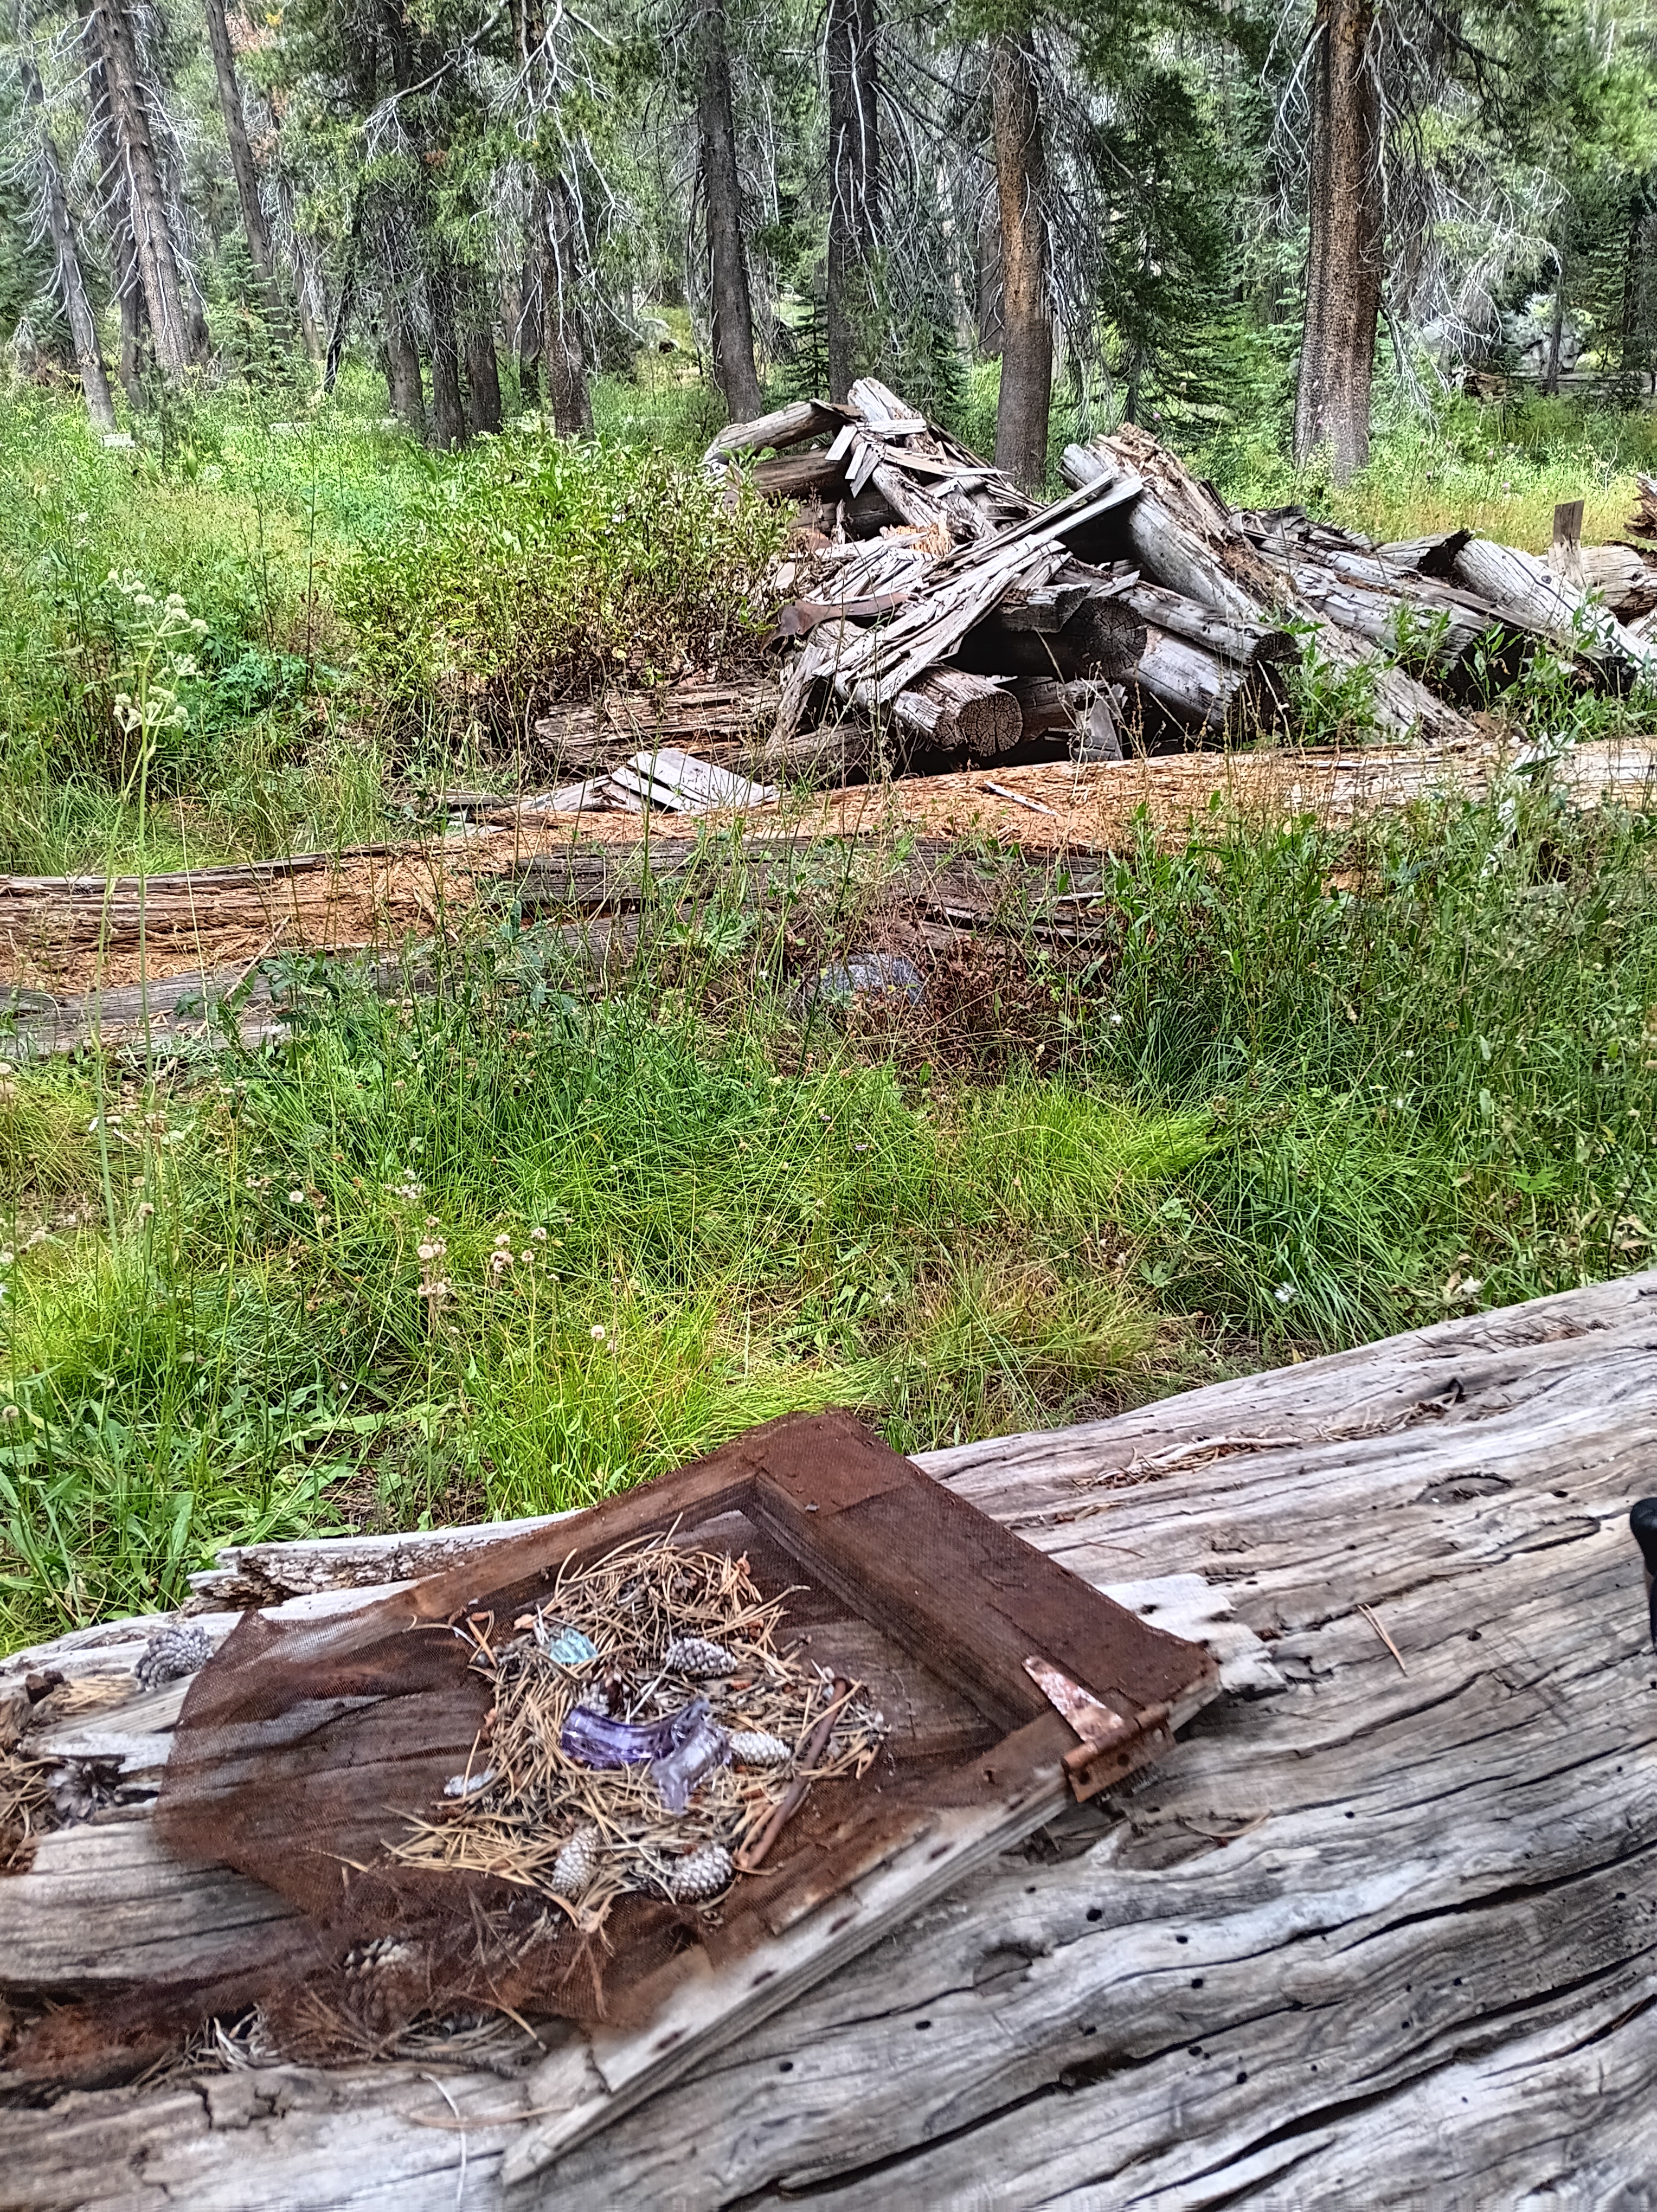
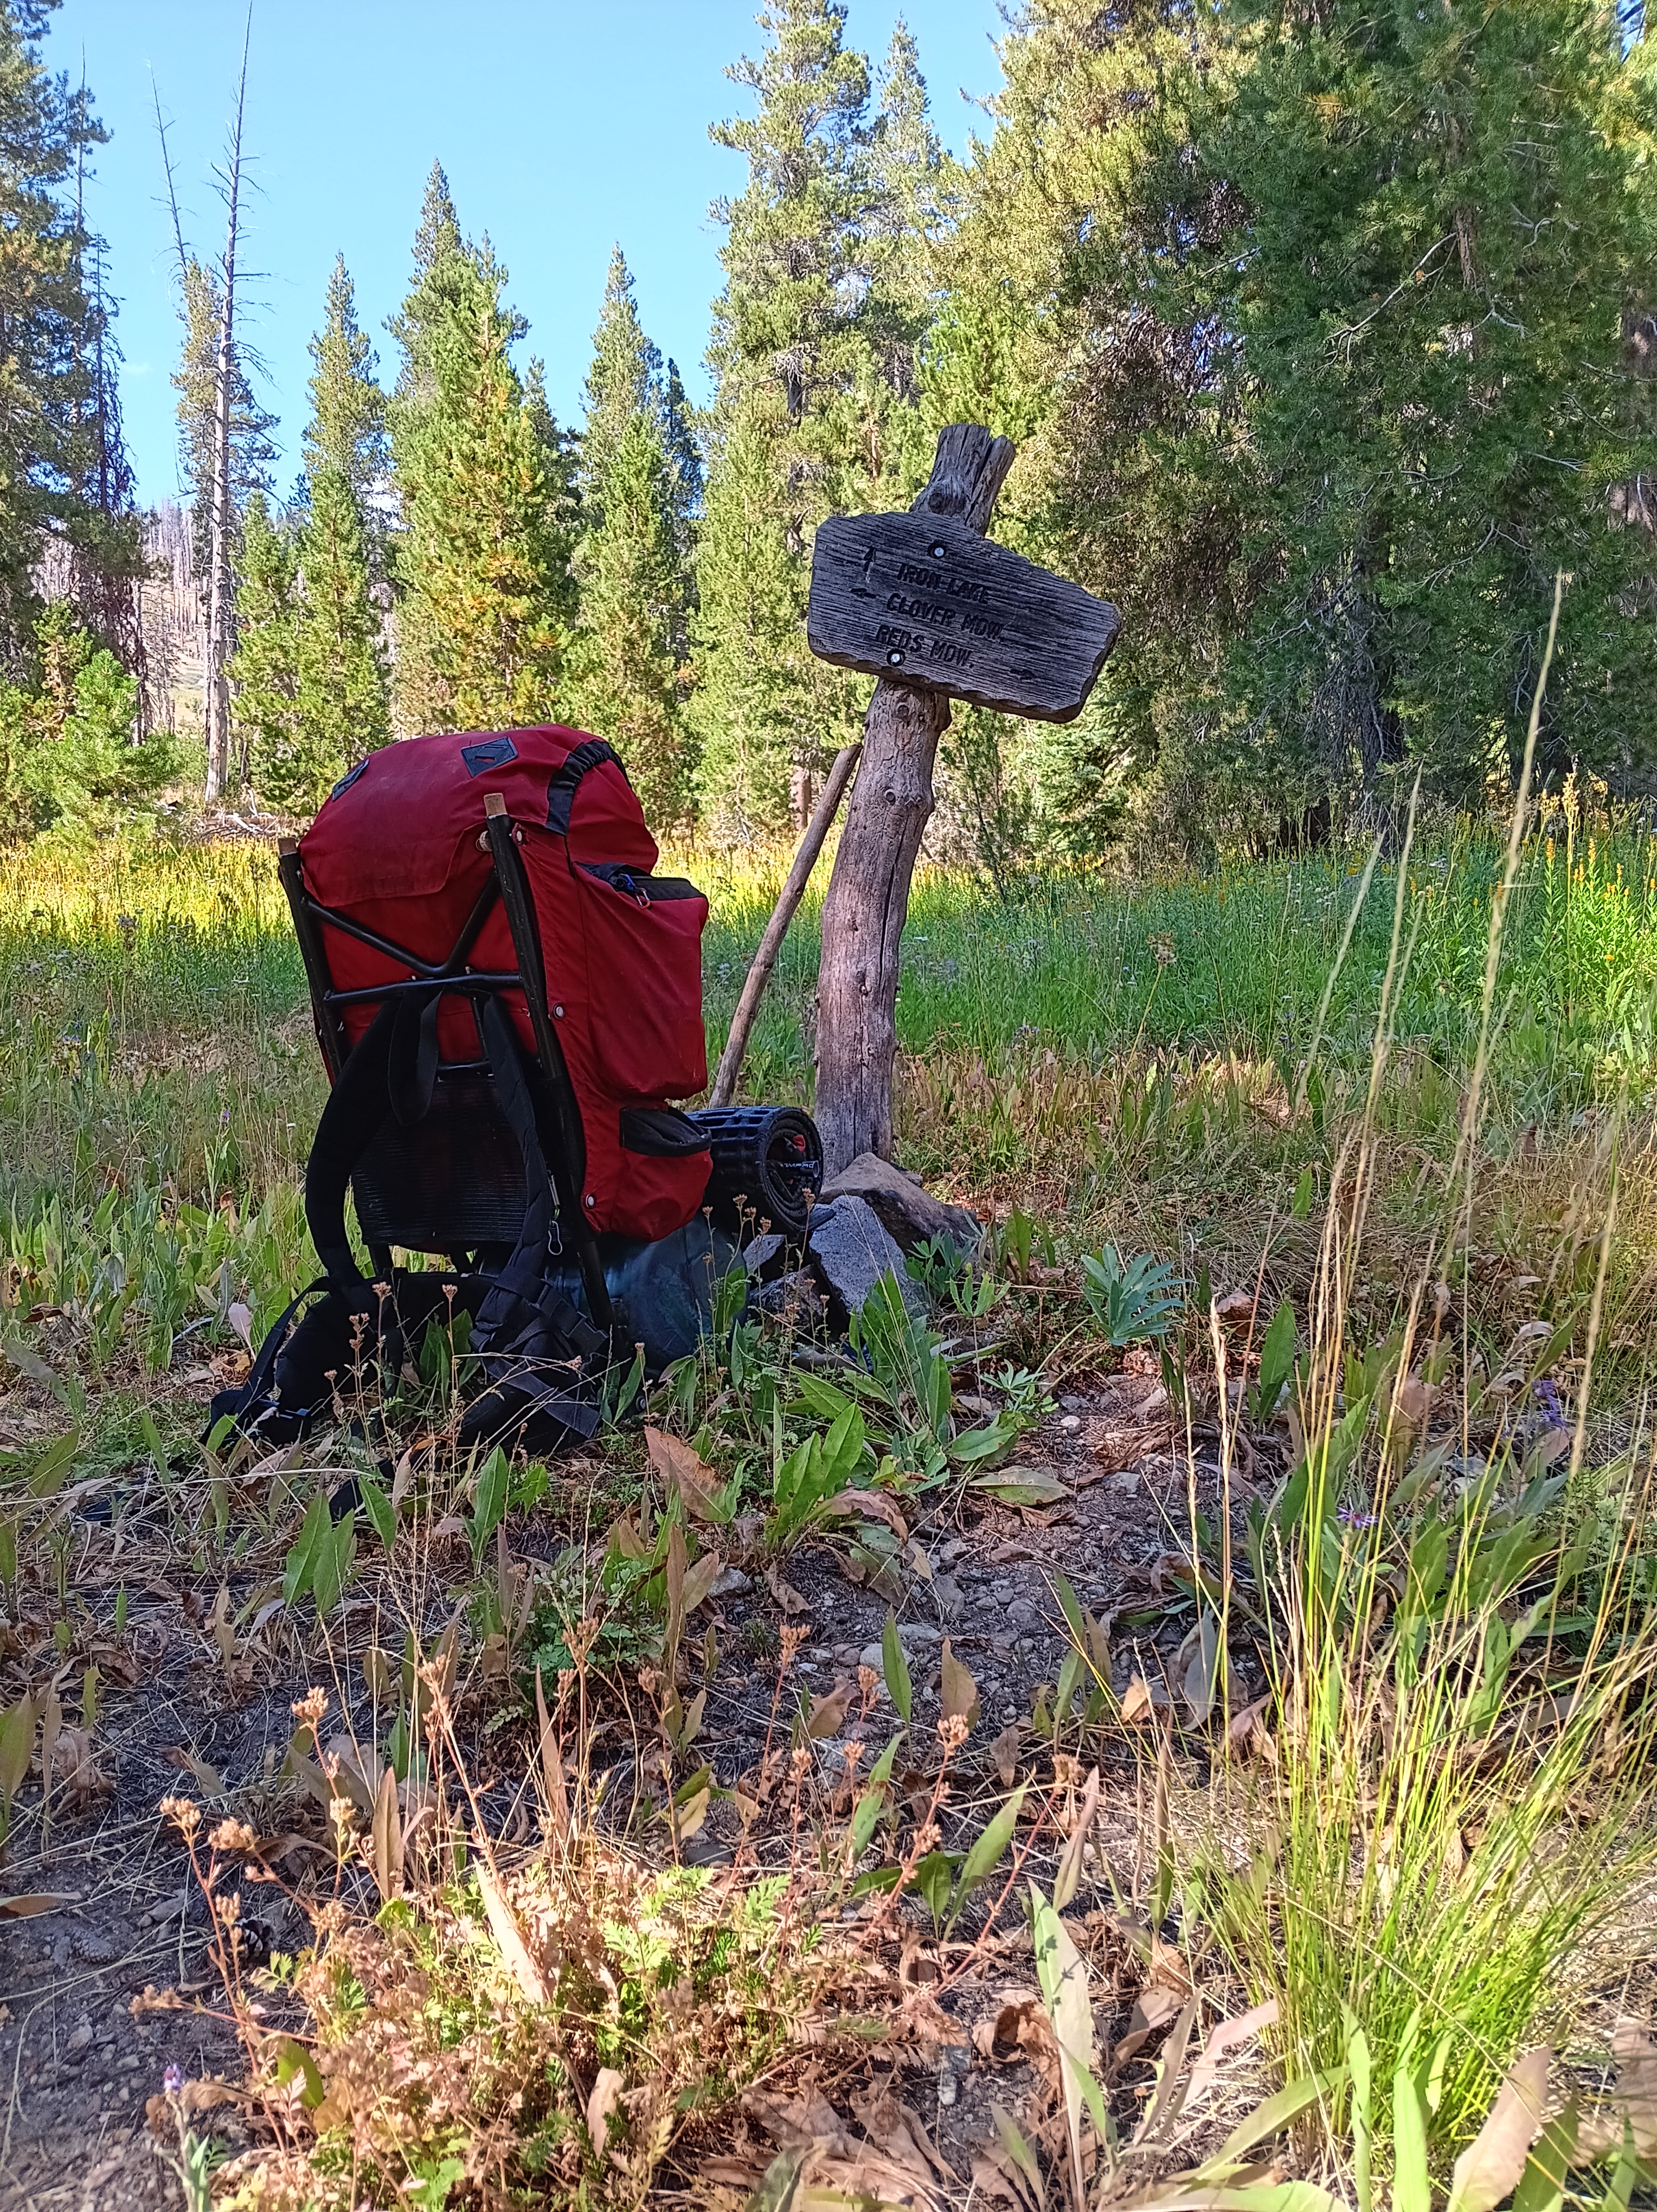
My senses sharpened during this day without a trail as I noticed more and more fallen tree logs that had a flat cut surface. At first I recorded each such sighting with its GPS position, but over time I could tell where they were. In the middle of these wild wanderings along a disappeared trail, I found this sign post (top left below) pointing out that this is the intersection of the trail to Mammouth Lakes to the right and Iron Mountain straight ahead. My navigation was good, but the so-called trail after this point was just one pile of wood after another pile of wood where I had to climb over, under, or walk around. Looking back, I find it amazing what one gets used to and how much punishment my then 62-year old body was able to take. After 10 miles of this I made camp at the unnamed meadow at 8,577′ (2610 m) below “Stairway Meadow,” “Granite Stairway,” and “Summit Meadow.” After that, a JMT-type trail emerged that led me down the mountain for 8 fast and furious miles downhill to Reds Meadow. Here civilization expressed itself in the form of a shower, beer, and double cheeseburger in that order. These last 8 miles passed faster than the prior 2 miles navigating wood piles:
Did my solution work? Yes it did for me in 2024, but it may not do so for everyone. During the 8-day return loop via the Clarke Range and North Fork of the San Joaquin River I met three other hiking groups: First 2 students from San Francisco, then the 2 women from Delaware, and finally the friendly “preacher” and his disciples. That was it in terms of people for 8 days. Along the way I learnt to read and interpret both the map and the landscape in front of me.
What served me well was to always listen to my body. I was NOT fighting to reach a destination. I walked only as long as it was fun (mostly) and always stopped for an hour or two when I felt like it. I took off my pack to investigate a pretty flower or a bee on it, watched a bird, or picked wild Elderberries, Red Currants, Rasberries, and even Blueberries. I made camp when I felt like, I was prepared to go home any day that was not fun, completion of the JMT or a certain section was not important. Some days I felt like walking 6-7 miles, but on other days it was 12 miles (to reach that cheeseburger at Red Meadow) or 17 miles (my last day on the trail to reach Lone Pine). It also made me enjoy the well maintained John Muir Trail the next 18 days.
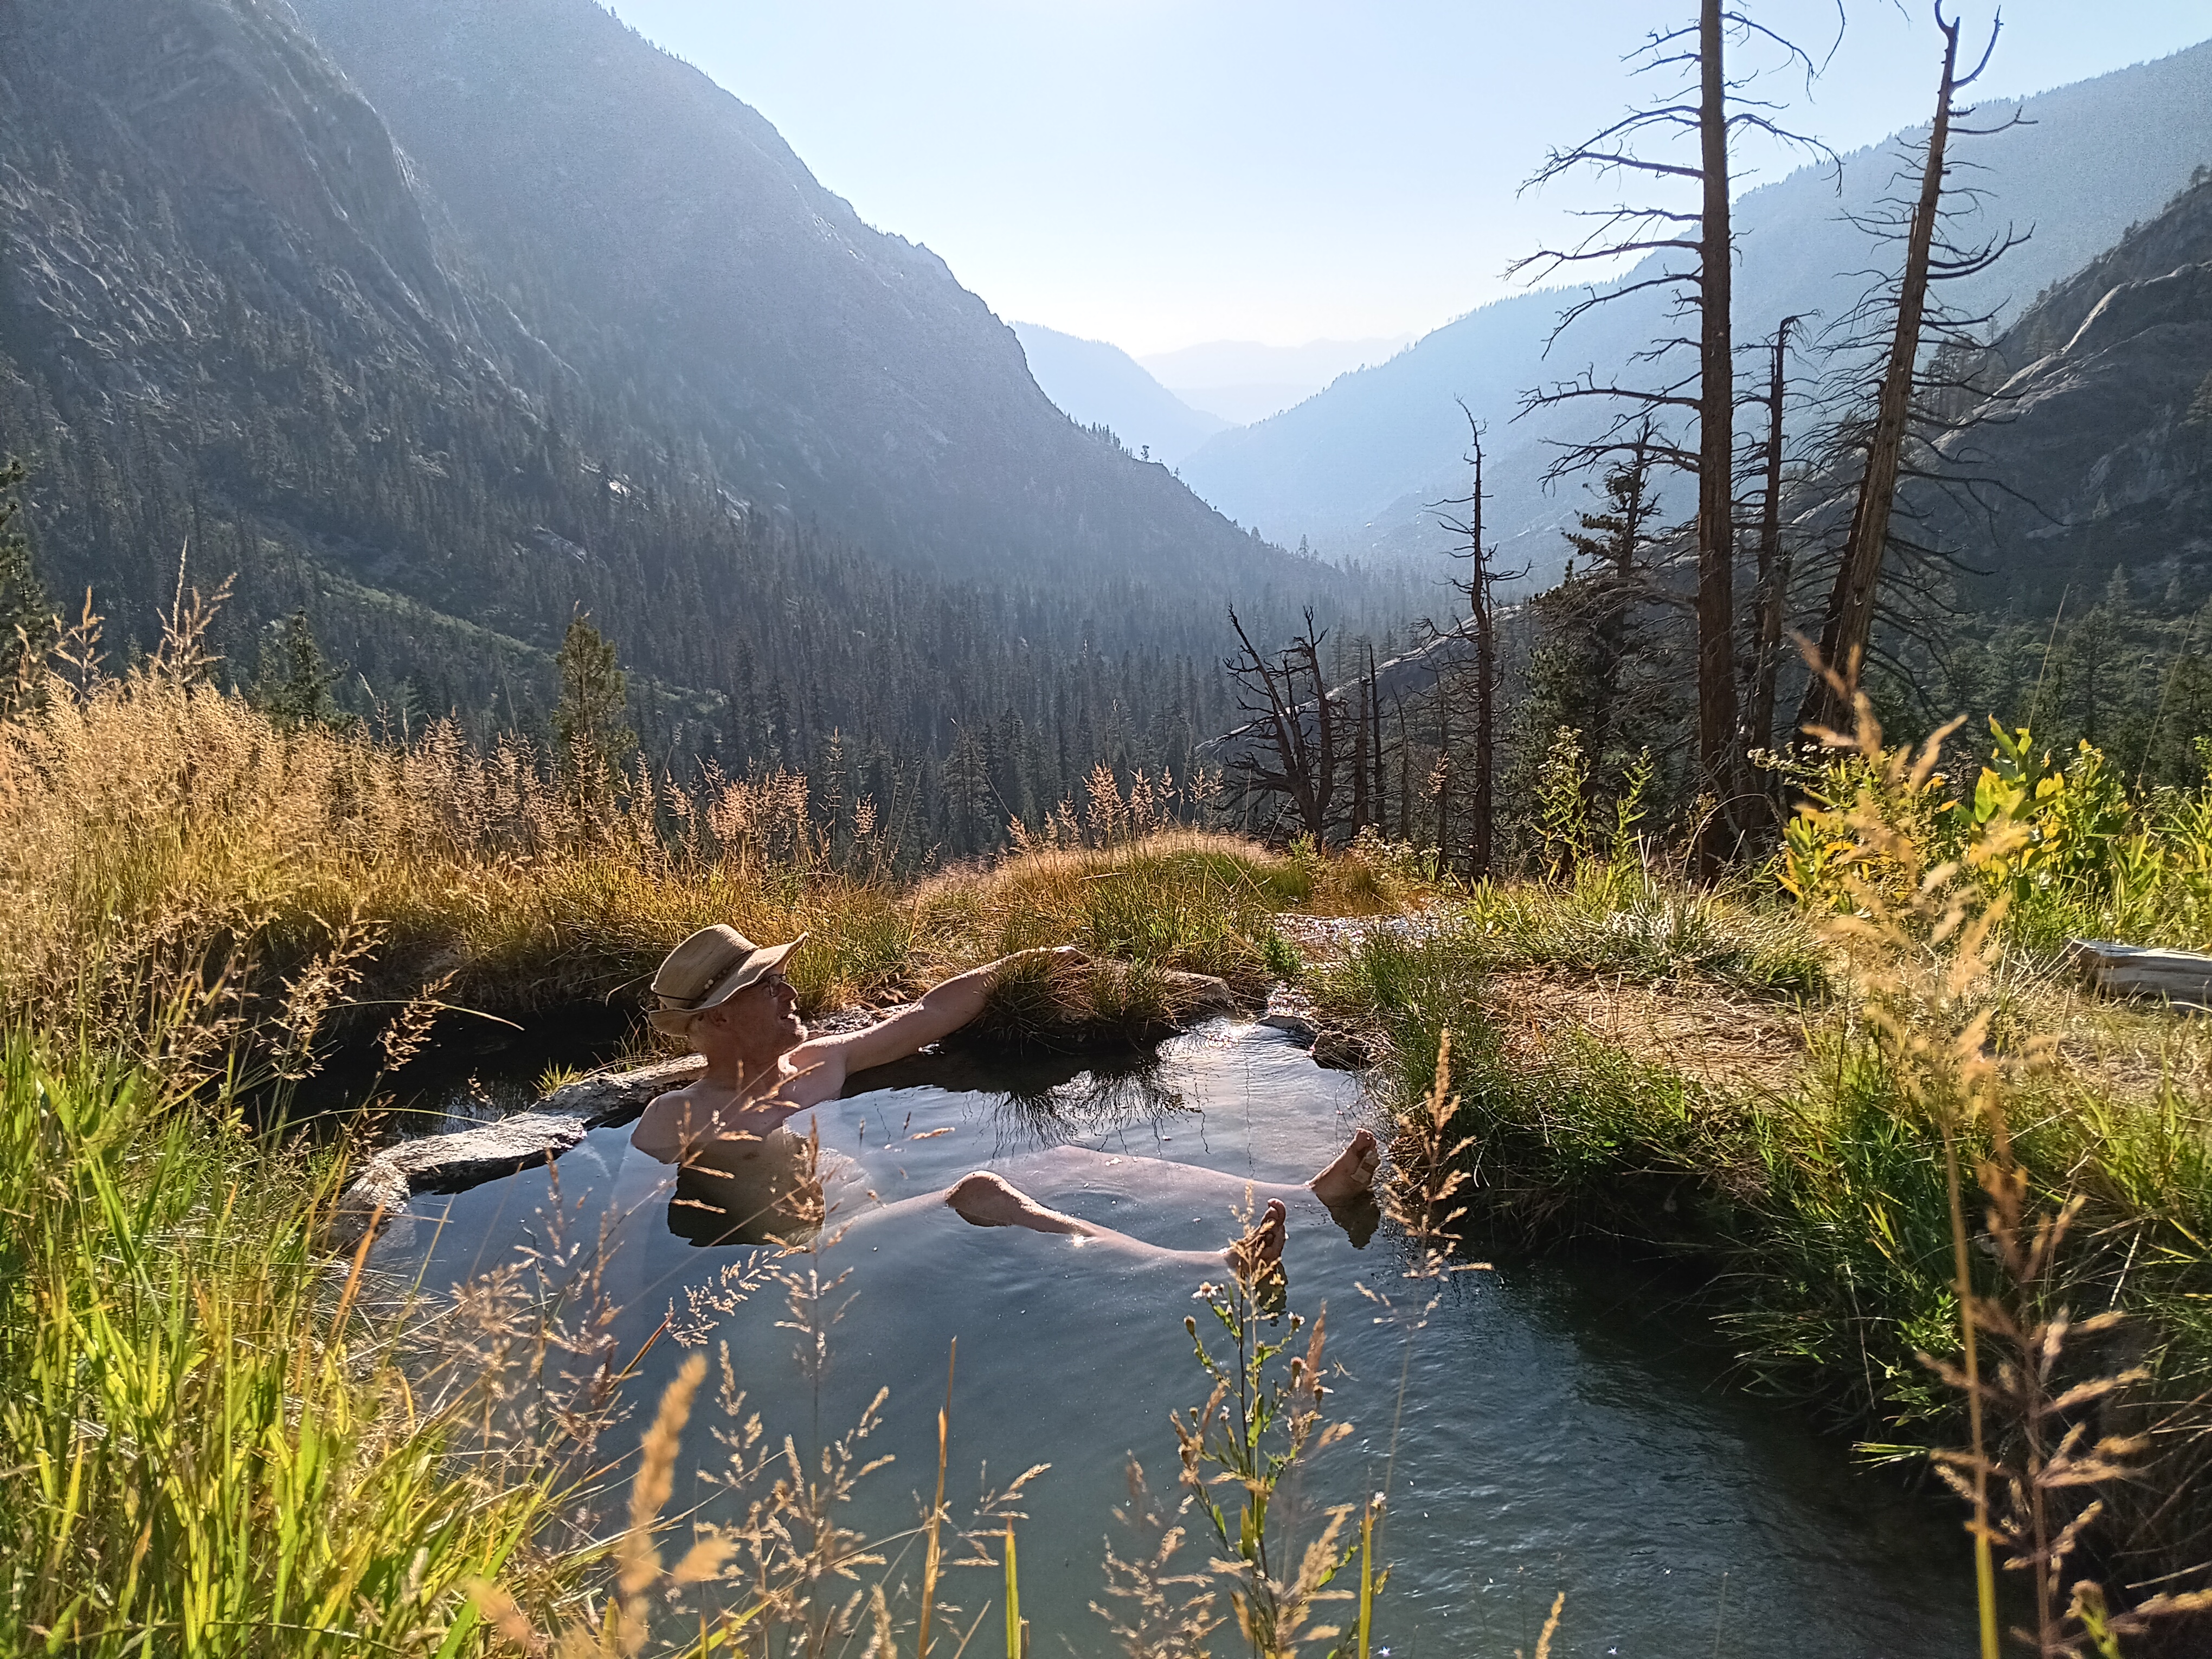
Now, would I do this exact hike again? Probably not, but only now do I know how to read a map of what is out there. In the future I will focus on the many trails that intersect with JMT. That’s where you will find me. The JMT is the scenic highway that leads to all the others. Two days after my shower and cheeseburger at Reds Meadow, I found the Hot Springs of Fish Valley (camp #20). [Photo Credit to Justin from Bend, Oregon; he appeared out of nowhere from above, staged, and took the picture. I met him several times again the next 10 days, but that’s another story.]
Hot pool and spring in Fish Valley; view is to the west.
So, my next solution would be turn east at Toulumne Meadows and then turn south to cross Parker Pass (11,115′ or 3390 m), Koip Peak Pass (12,280′ or 3740 m), and Agnew Pass (9,900′ or 3320 m). Then follow the Pacific Crest Trail along the Middle Fork of the San Joaquin River back to Mammouth Lakes.
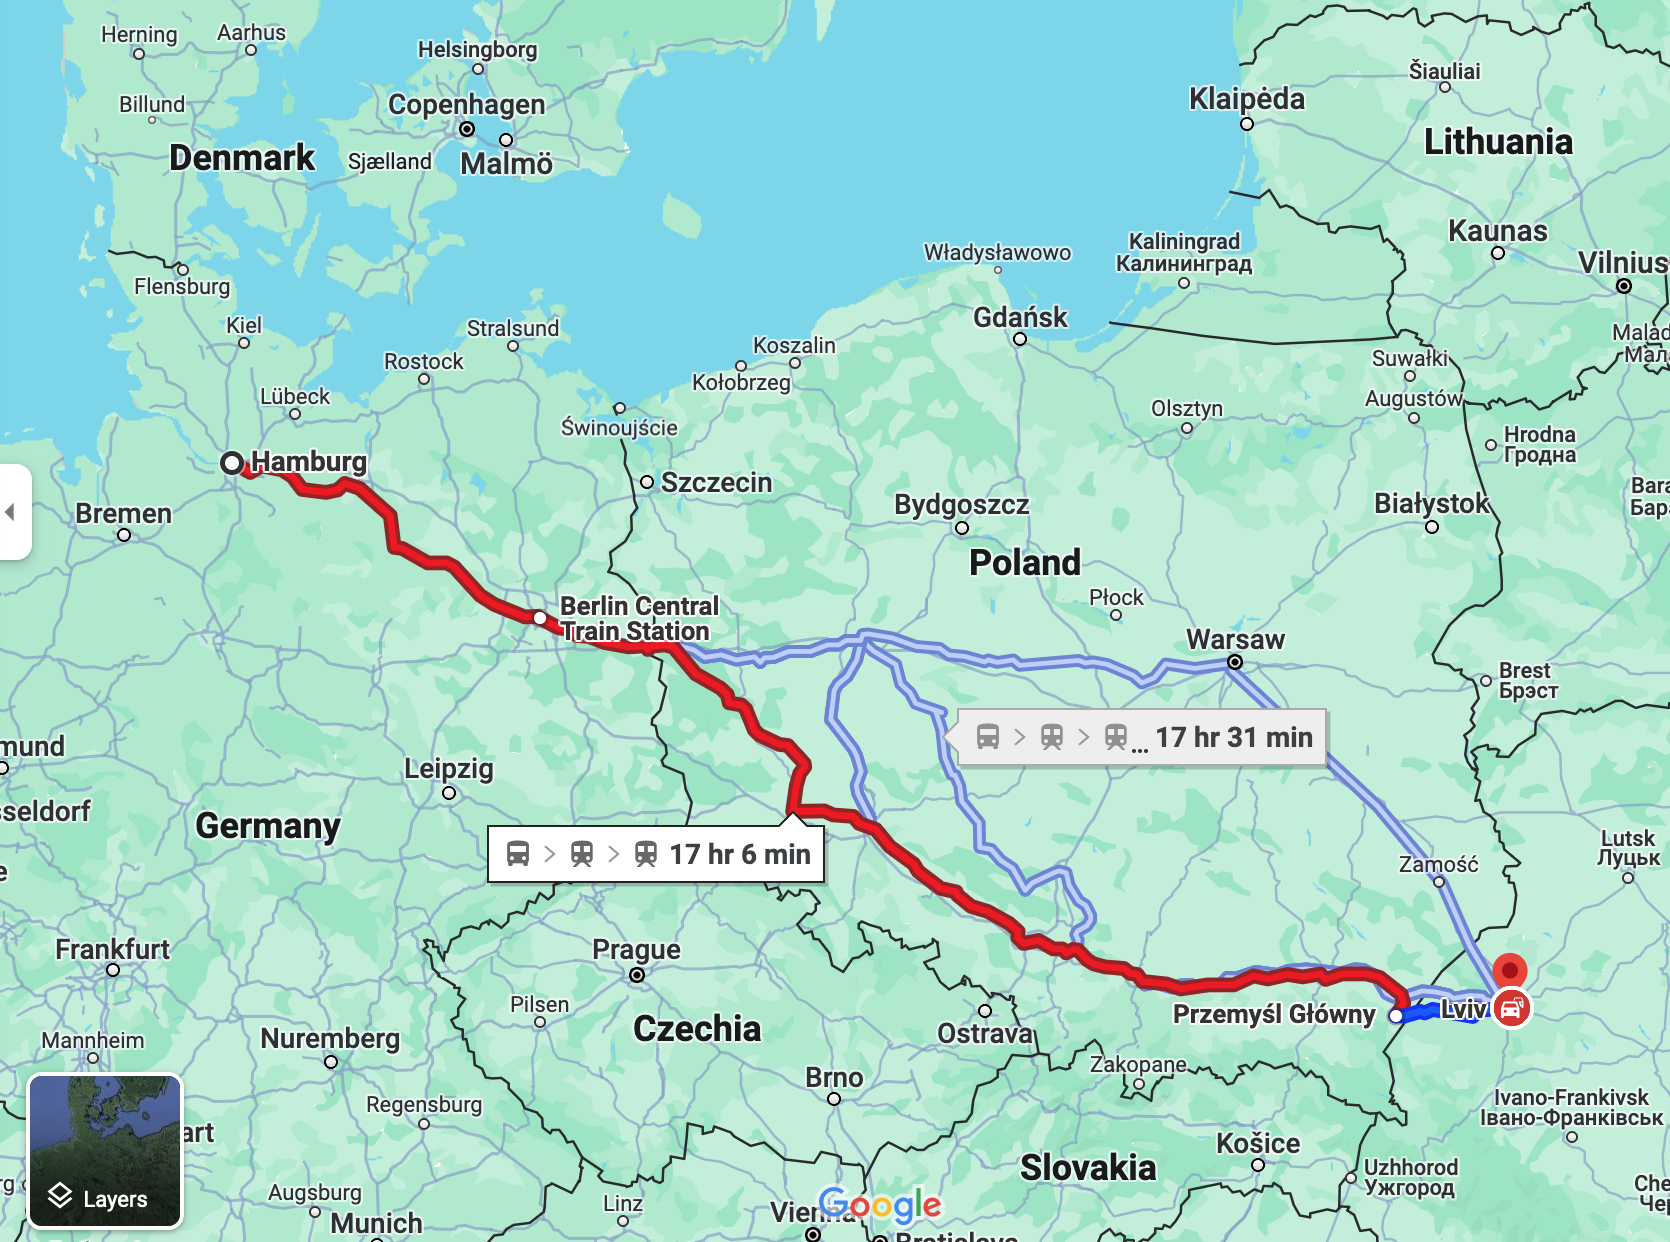
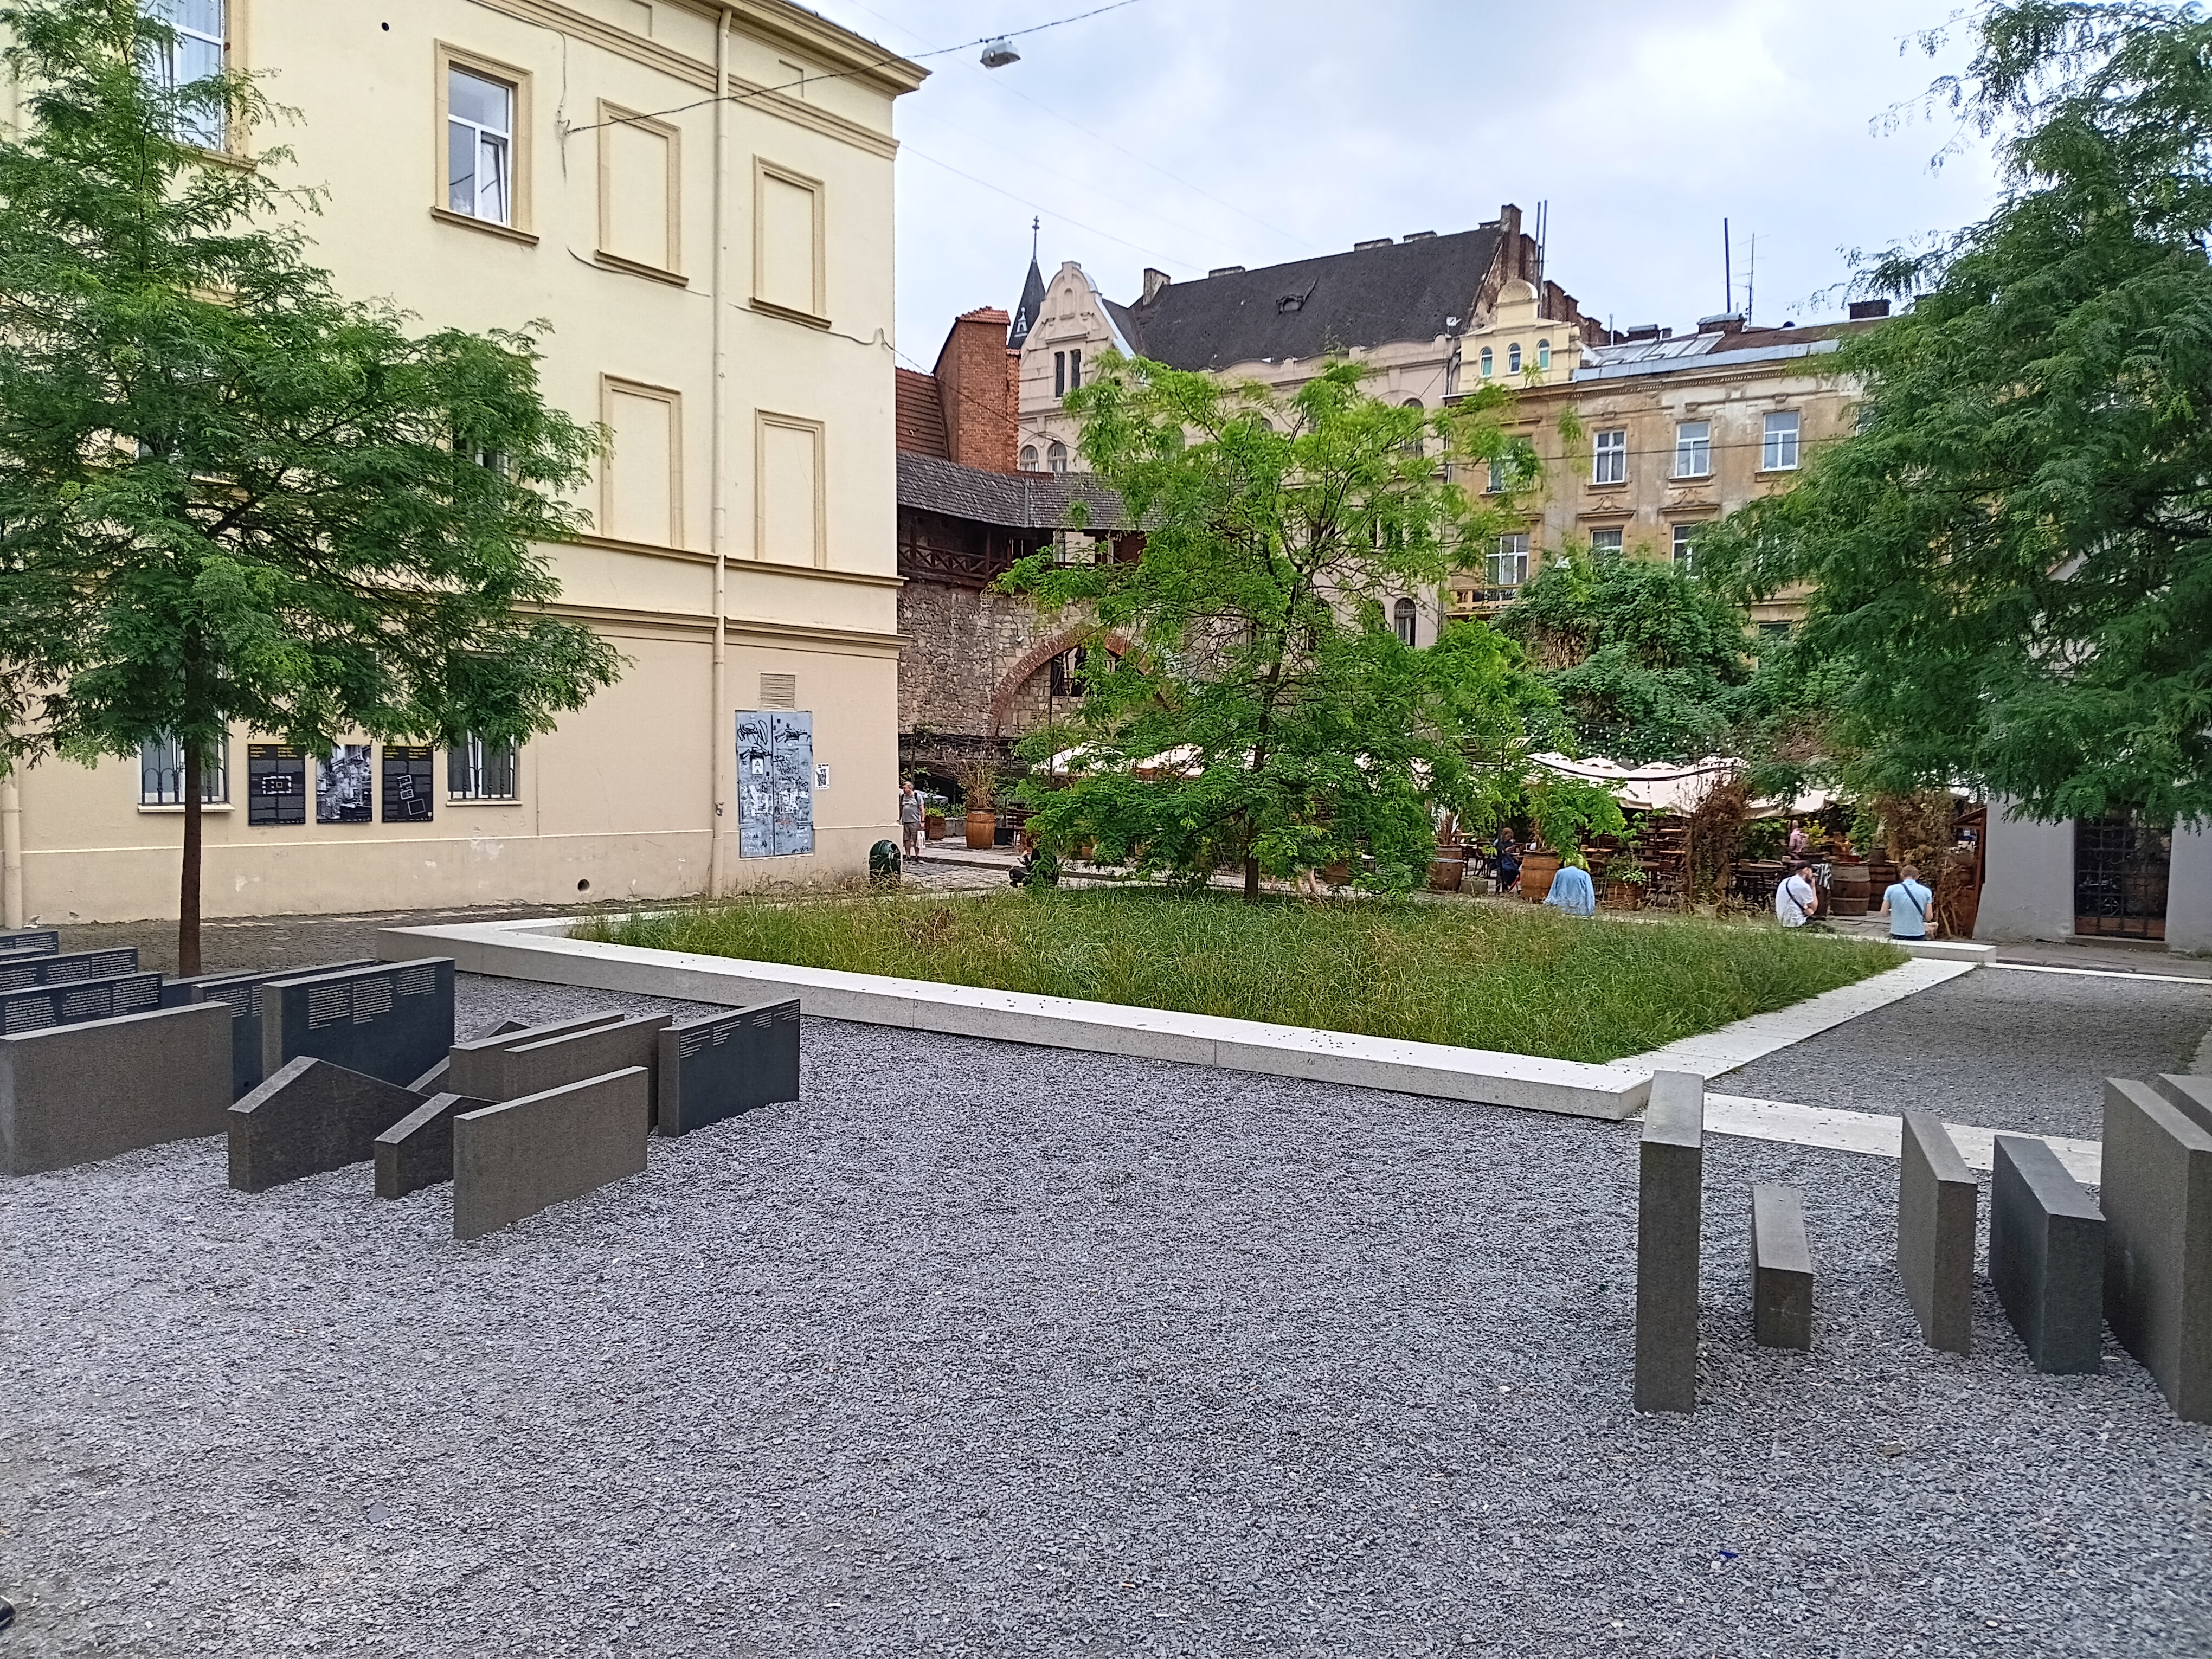
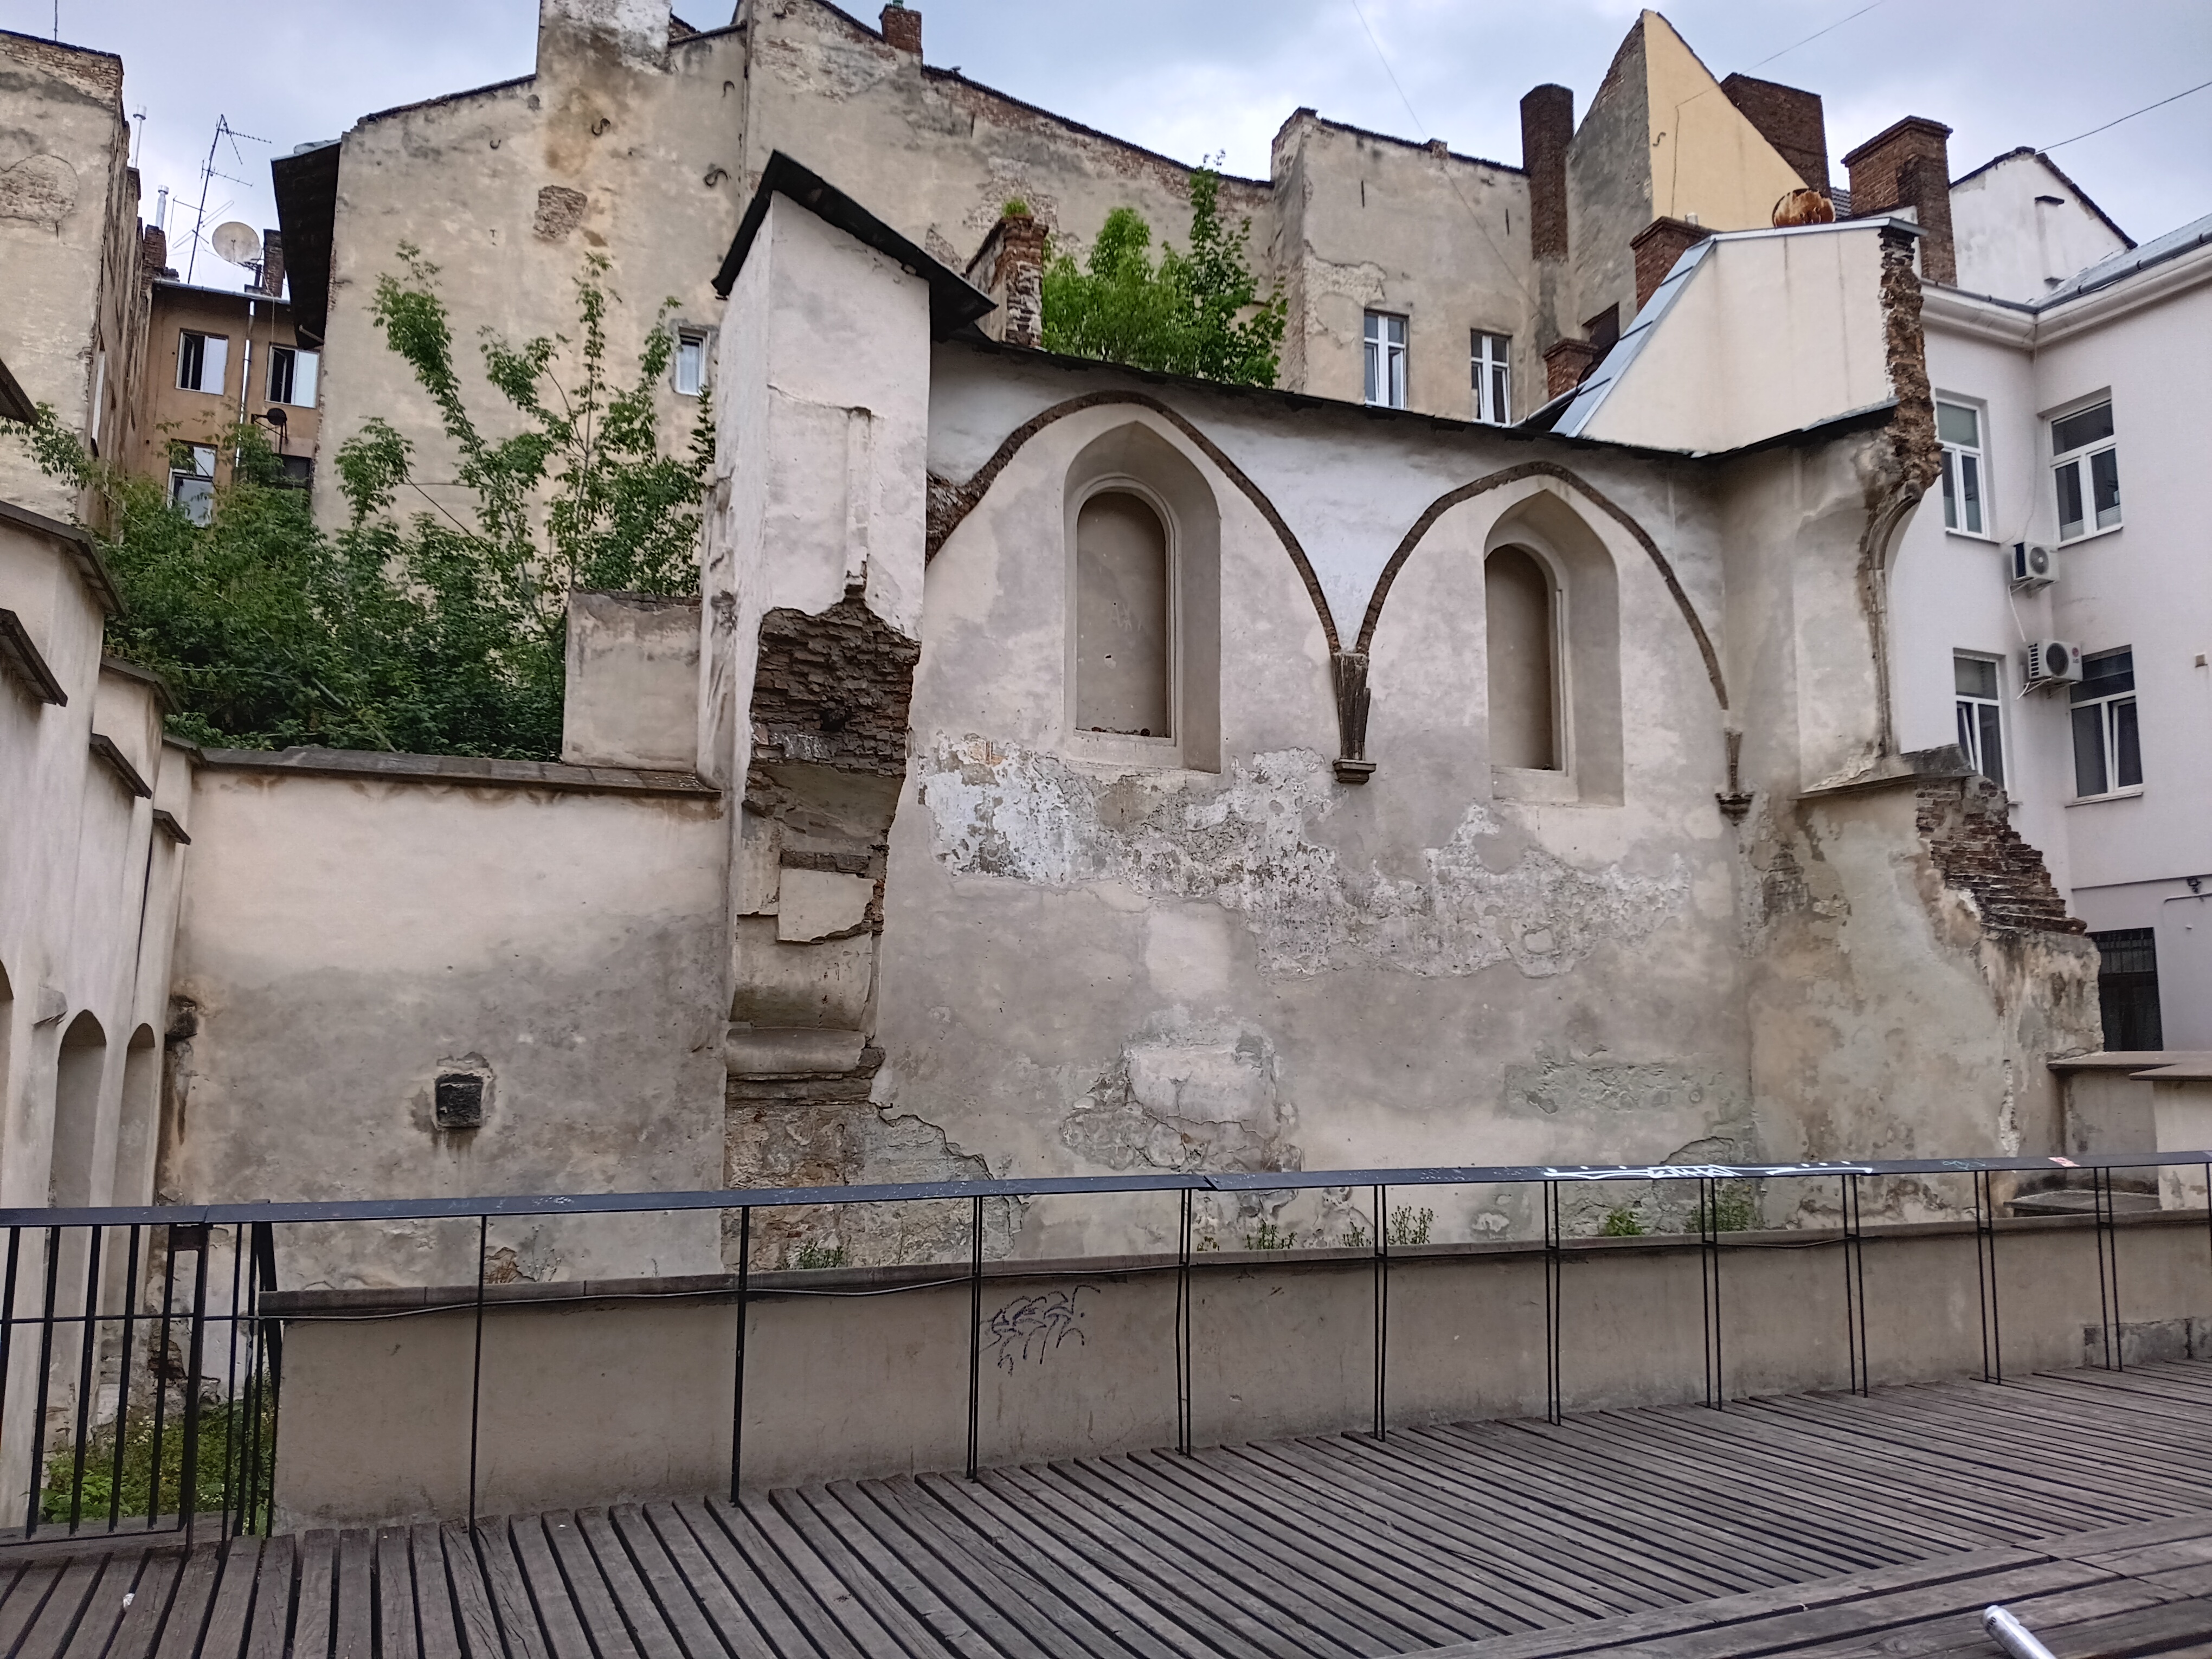
Lviv lies about 40 miles east of the Polish border in Ukraine. It is closer to peaceful Hamburg in Germany (1200 km) than it is to destroyed Mariupol in Ukraine (1250 km). Leaving Hamburg by train, I arrived 20 hours later in Lviv where I spent the next 7 days. As a scientist I planned to collect my own data to calibrate media reportings. I wanted to test second-hand opinions to perhaps revise them based on first-hand observations to better anticipate the future and my actions within it. How can I best support Ukraine in its current war with Russia?
The U.S. Department of State advises “Ukraine – Level 4: Do not travel” in dark red letters, because it is a country at war. I ignored this advice, but nevertheless registered details of my travel plans with the Smart Traveler Enrollment Program. I also followed my government’s advice on how to prepare for travel to high-risk areas such as making a notarized will and to communicate daily with my wife. I do the same when backpacking for 30 days in Yosemite, Adam Ansel, and John Muir Wilderness areas in California. Looking back, I believe that visiting Lviv is less dangerous than visiting Fordyce, Arkansas (population 3,400). Death by random shooting in this town is about 1 person killed for every 1000 residents as of yesterday. In Lviv death by random Russian missile is about 1 person killed for every 100,000 residents. The last Russian missile hit Lviv (population 700,000) a year ago and killed 7 people. Air defences, too, have improved the last 12 month thanks to Norwegian, U.S., and German systems.
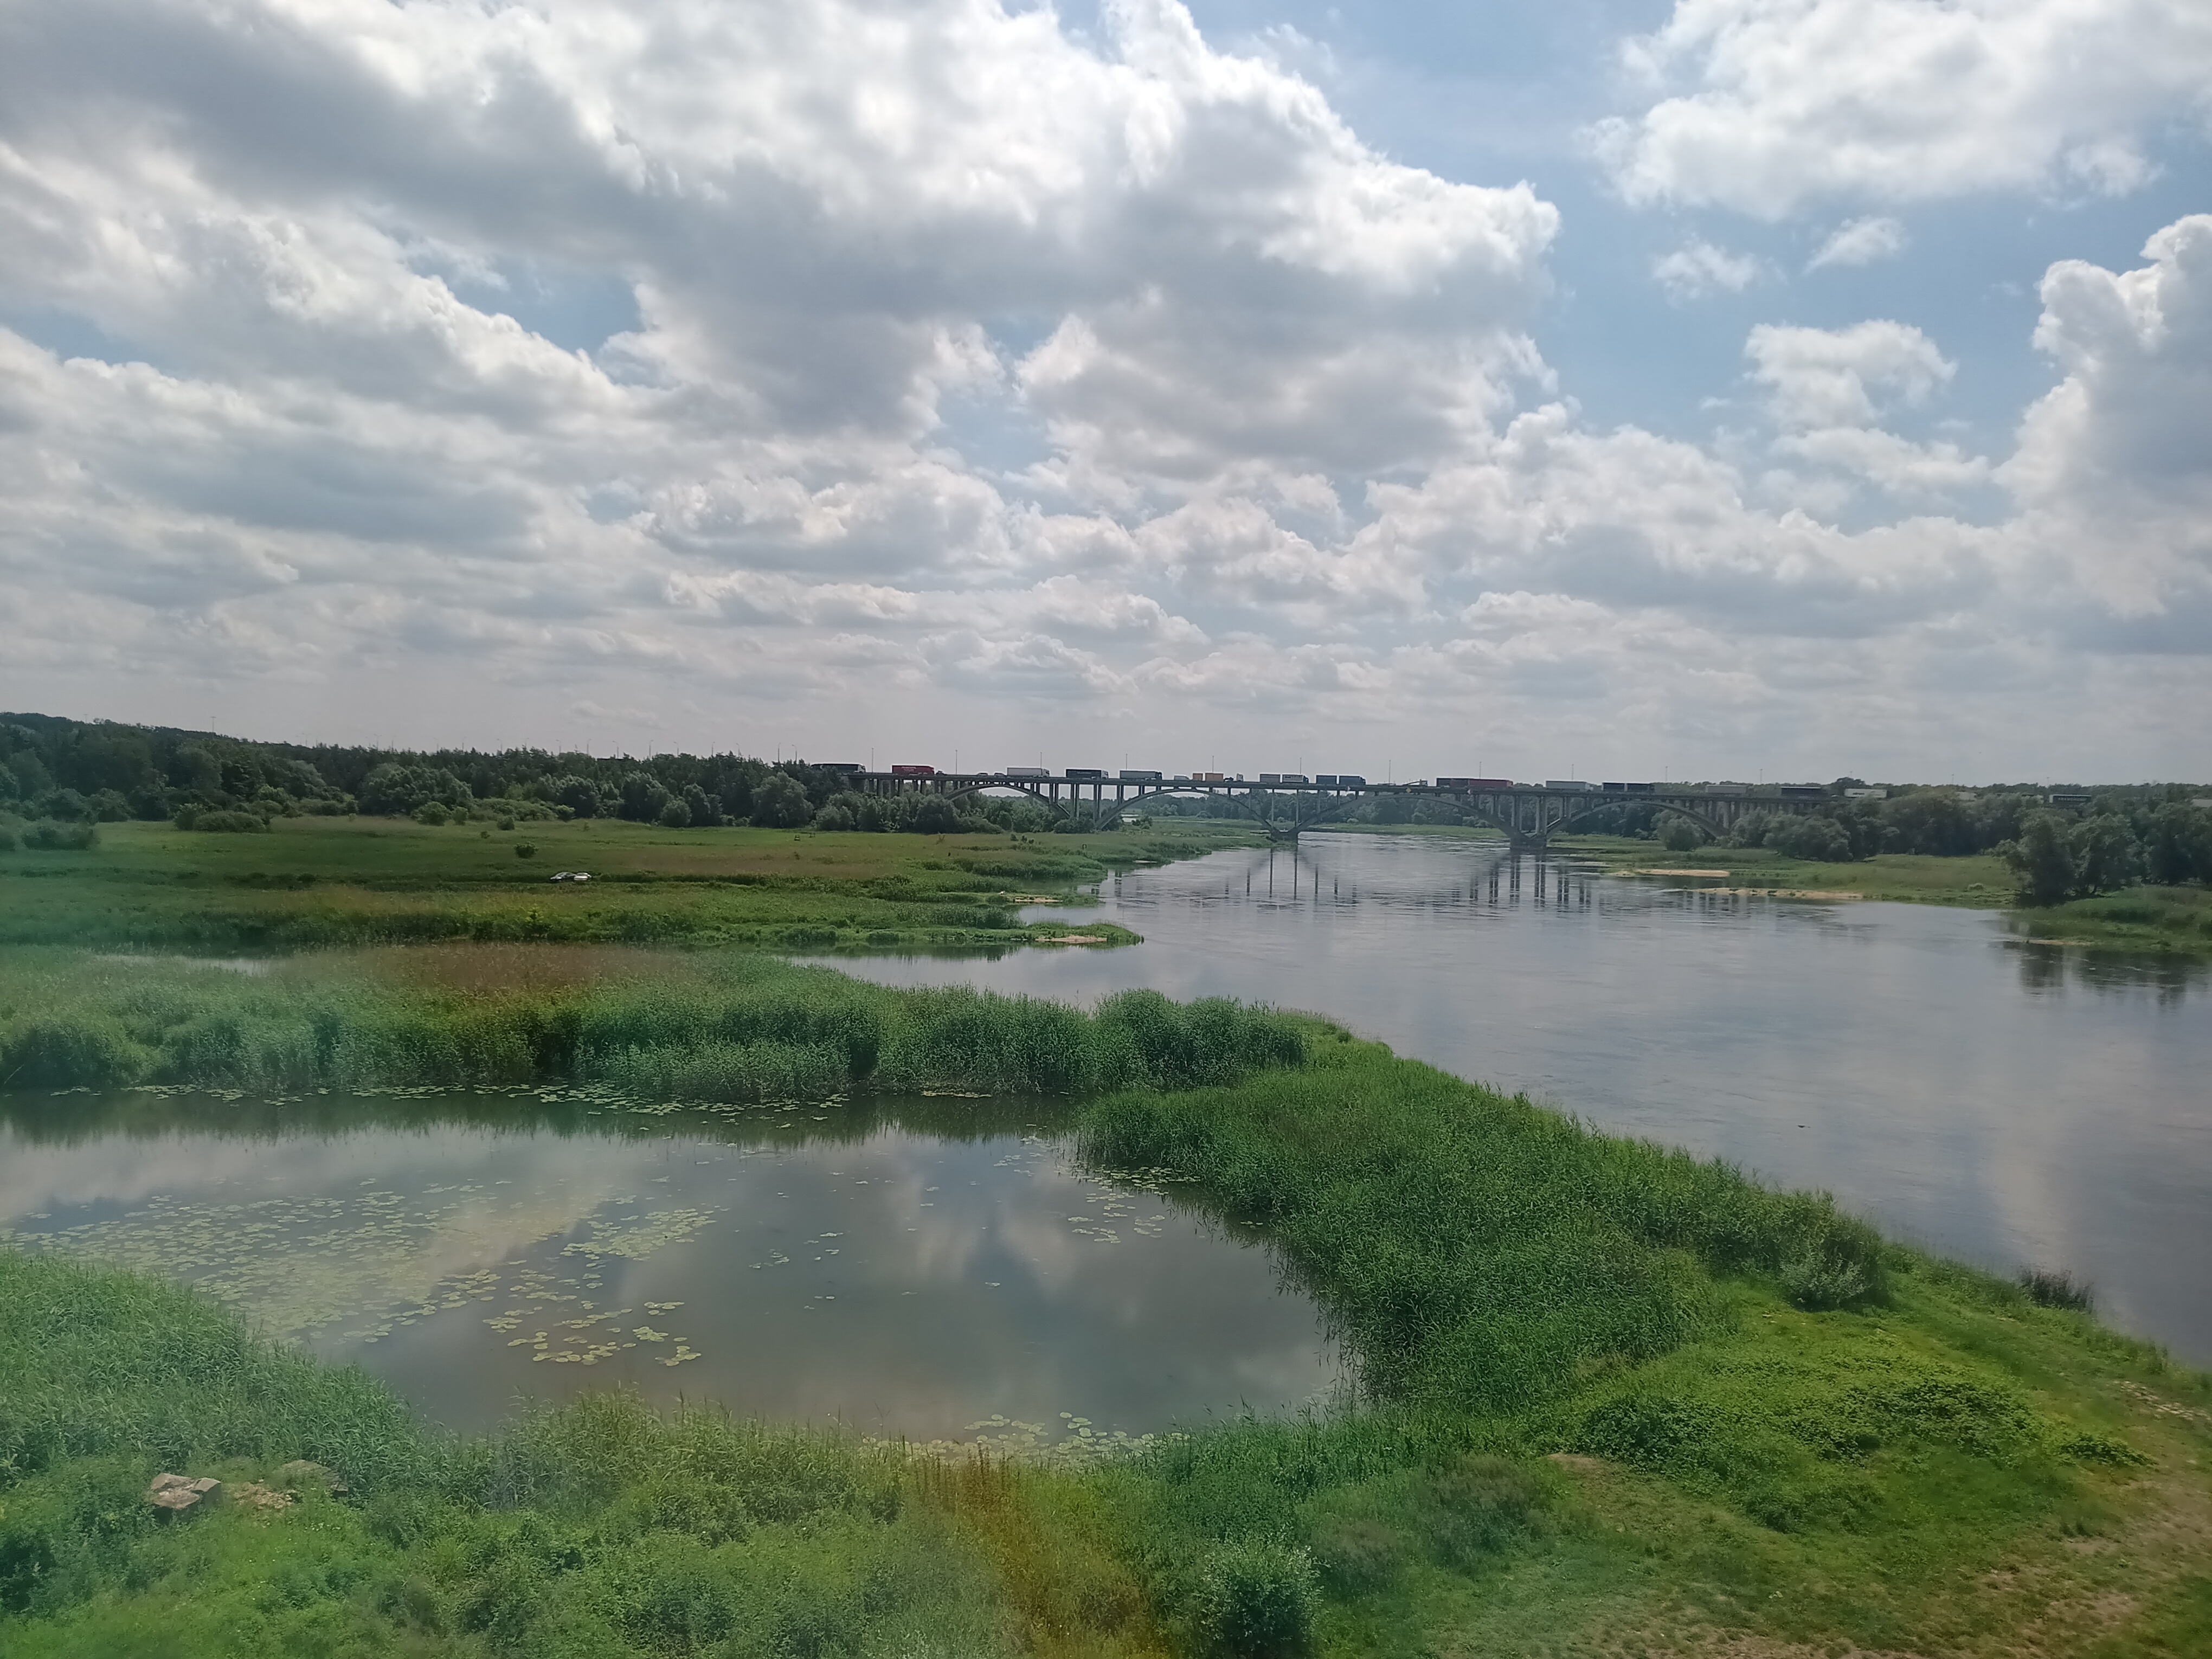
My voyage to eastern and across central Europe brought me into spaces that were violently contested during the last 1000 years. Recall that the current border between Poland and Ukraine was drawn in 1939 when Adolf Hitler of Germany and Joseph Stalin of the Soviet Union divided Poland (as well as Finland, Estonia, Latvia, and Lithuania) a mere 10 days before World War Two. The Yale historian Timothy Snyder calls these lands “Bloodlands” where the totalitarian regimes of Germany and the Soviet Union killed between 10 and 20 Million women, children, and men from 1933 to 1945. My father was born 1934 and my family celebrated his 90th birthday the weekend before I left for Lviv.
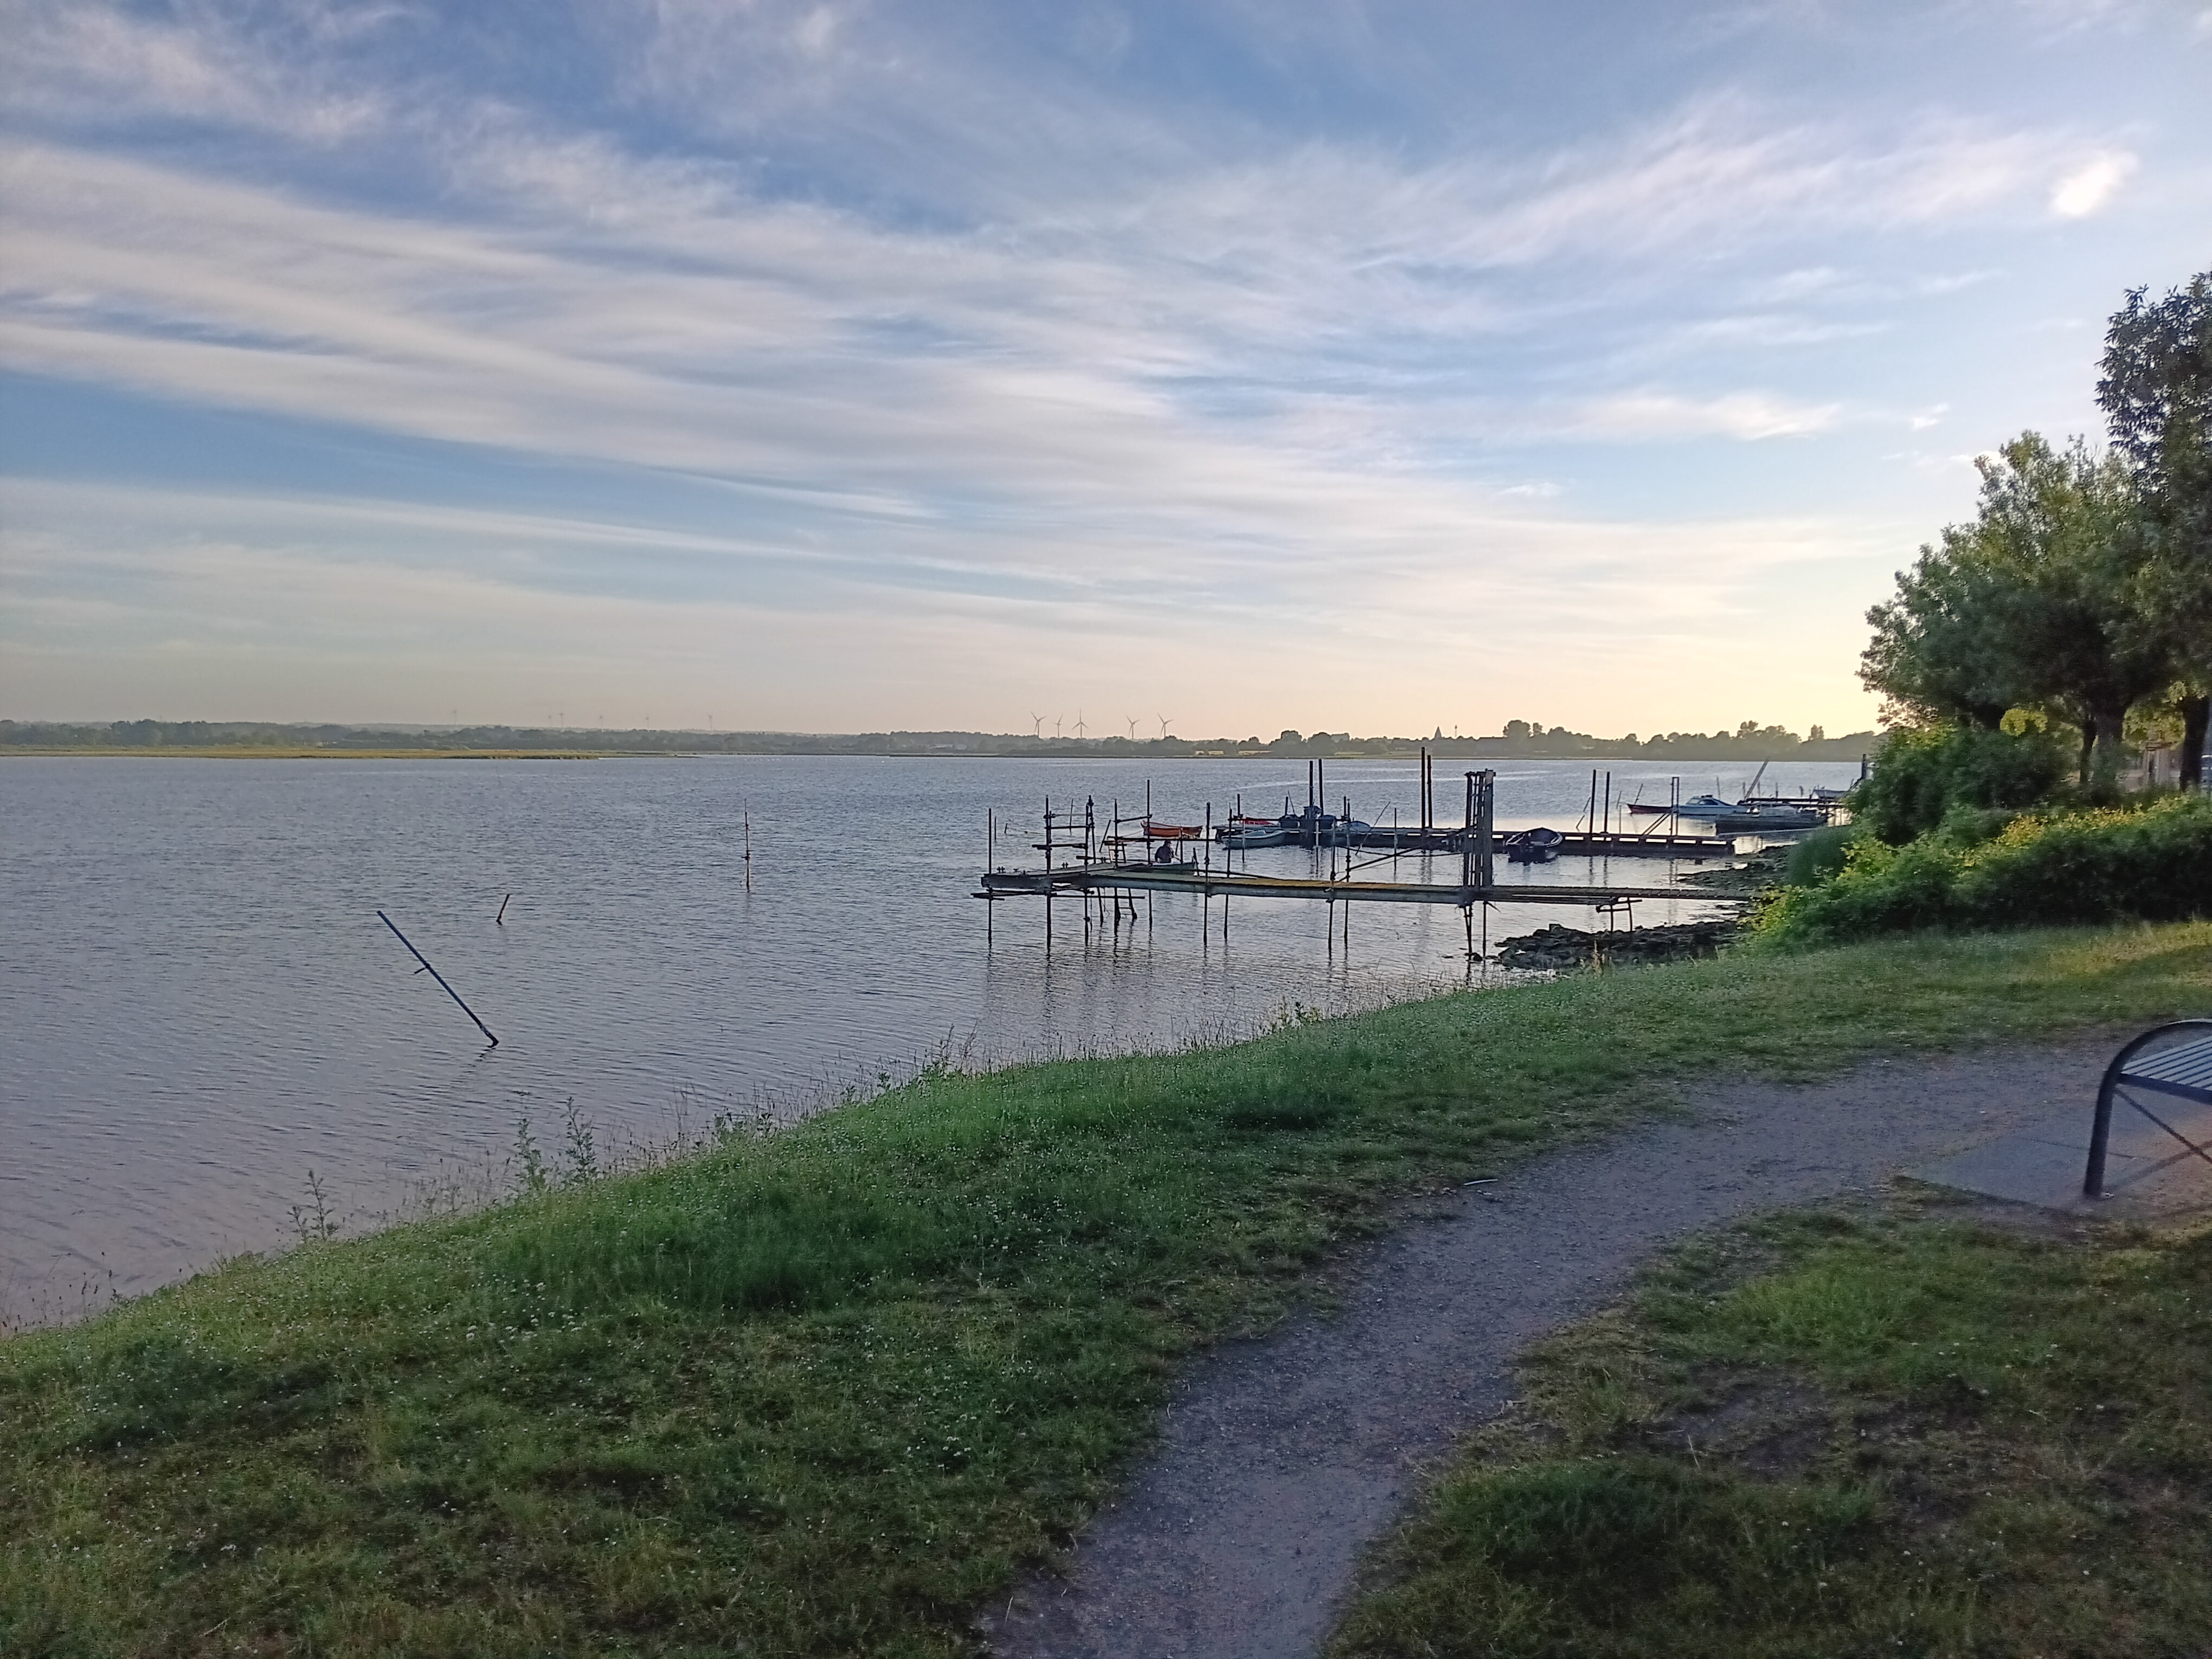
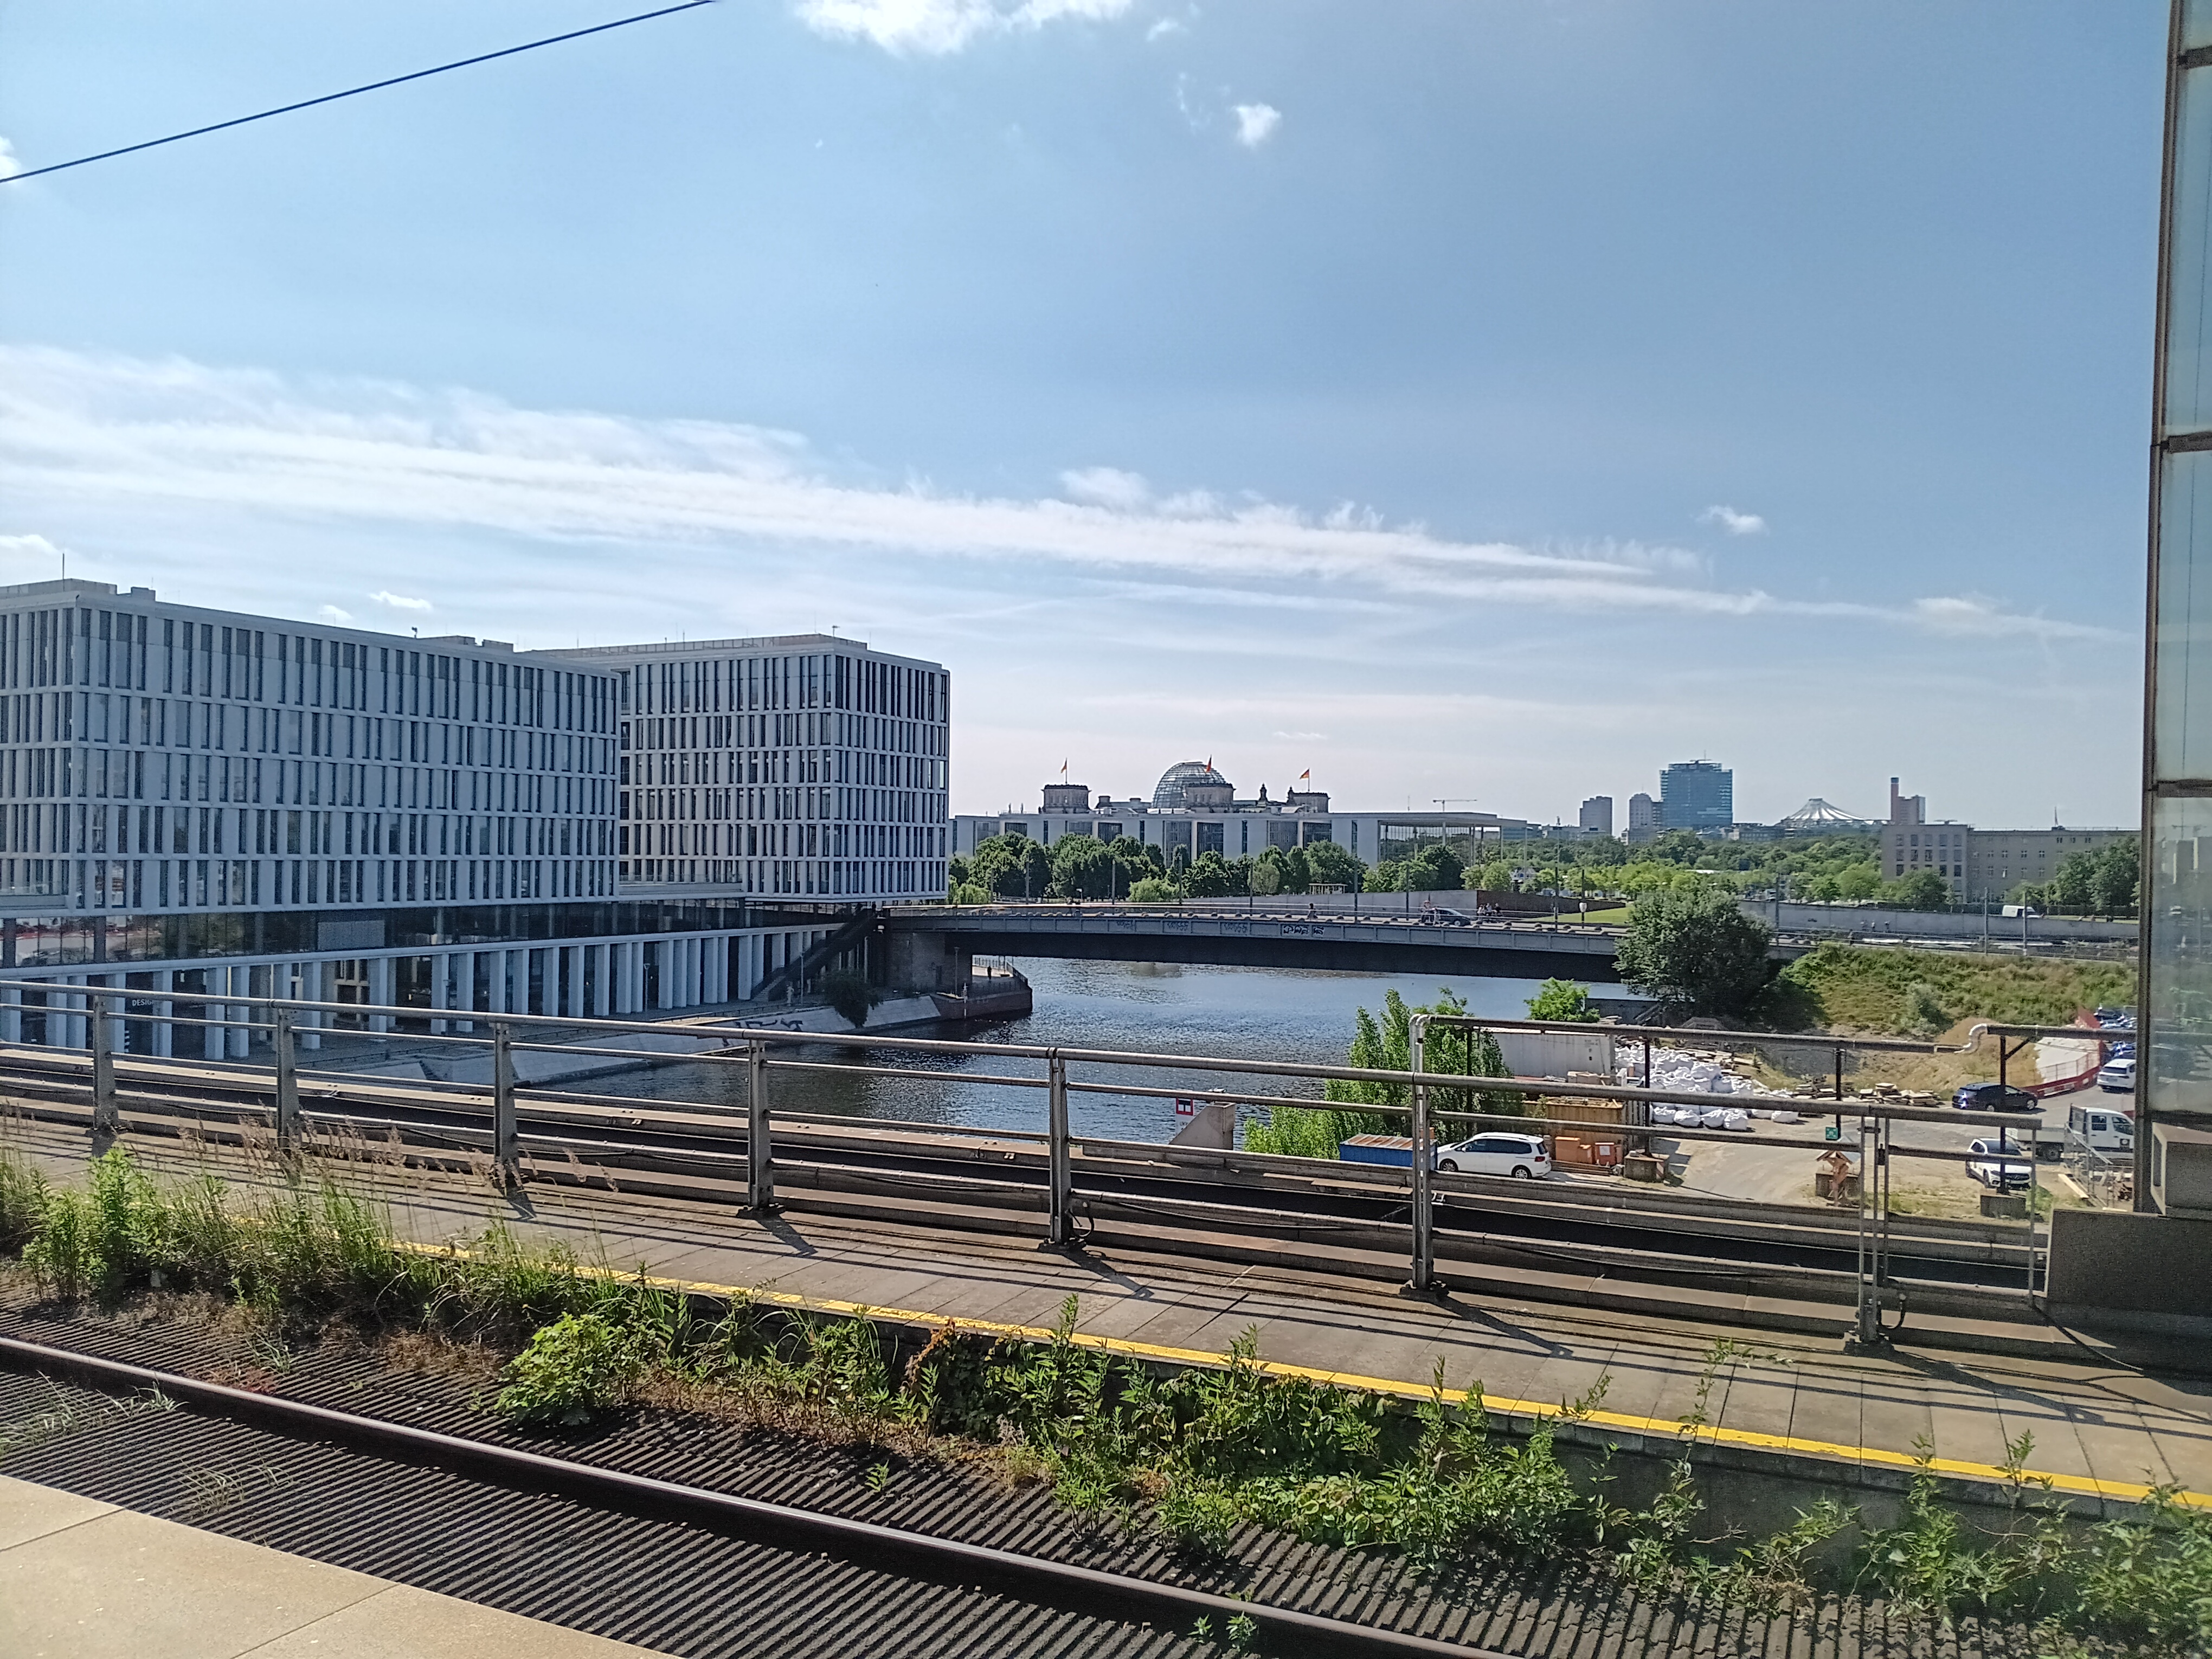
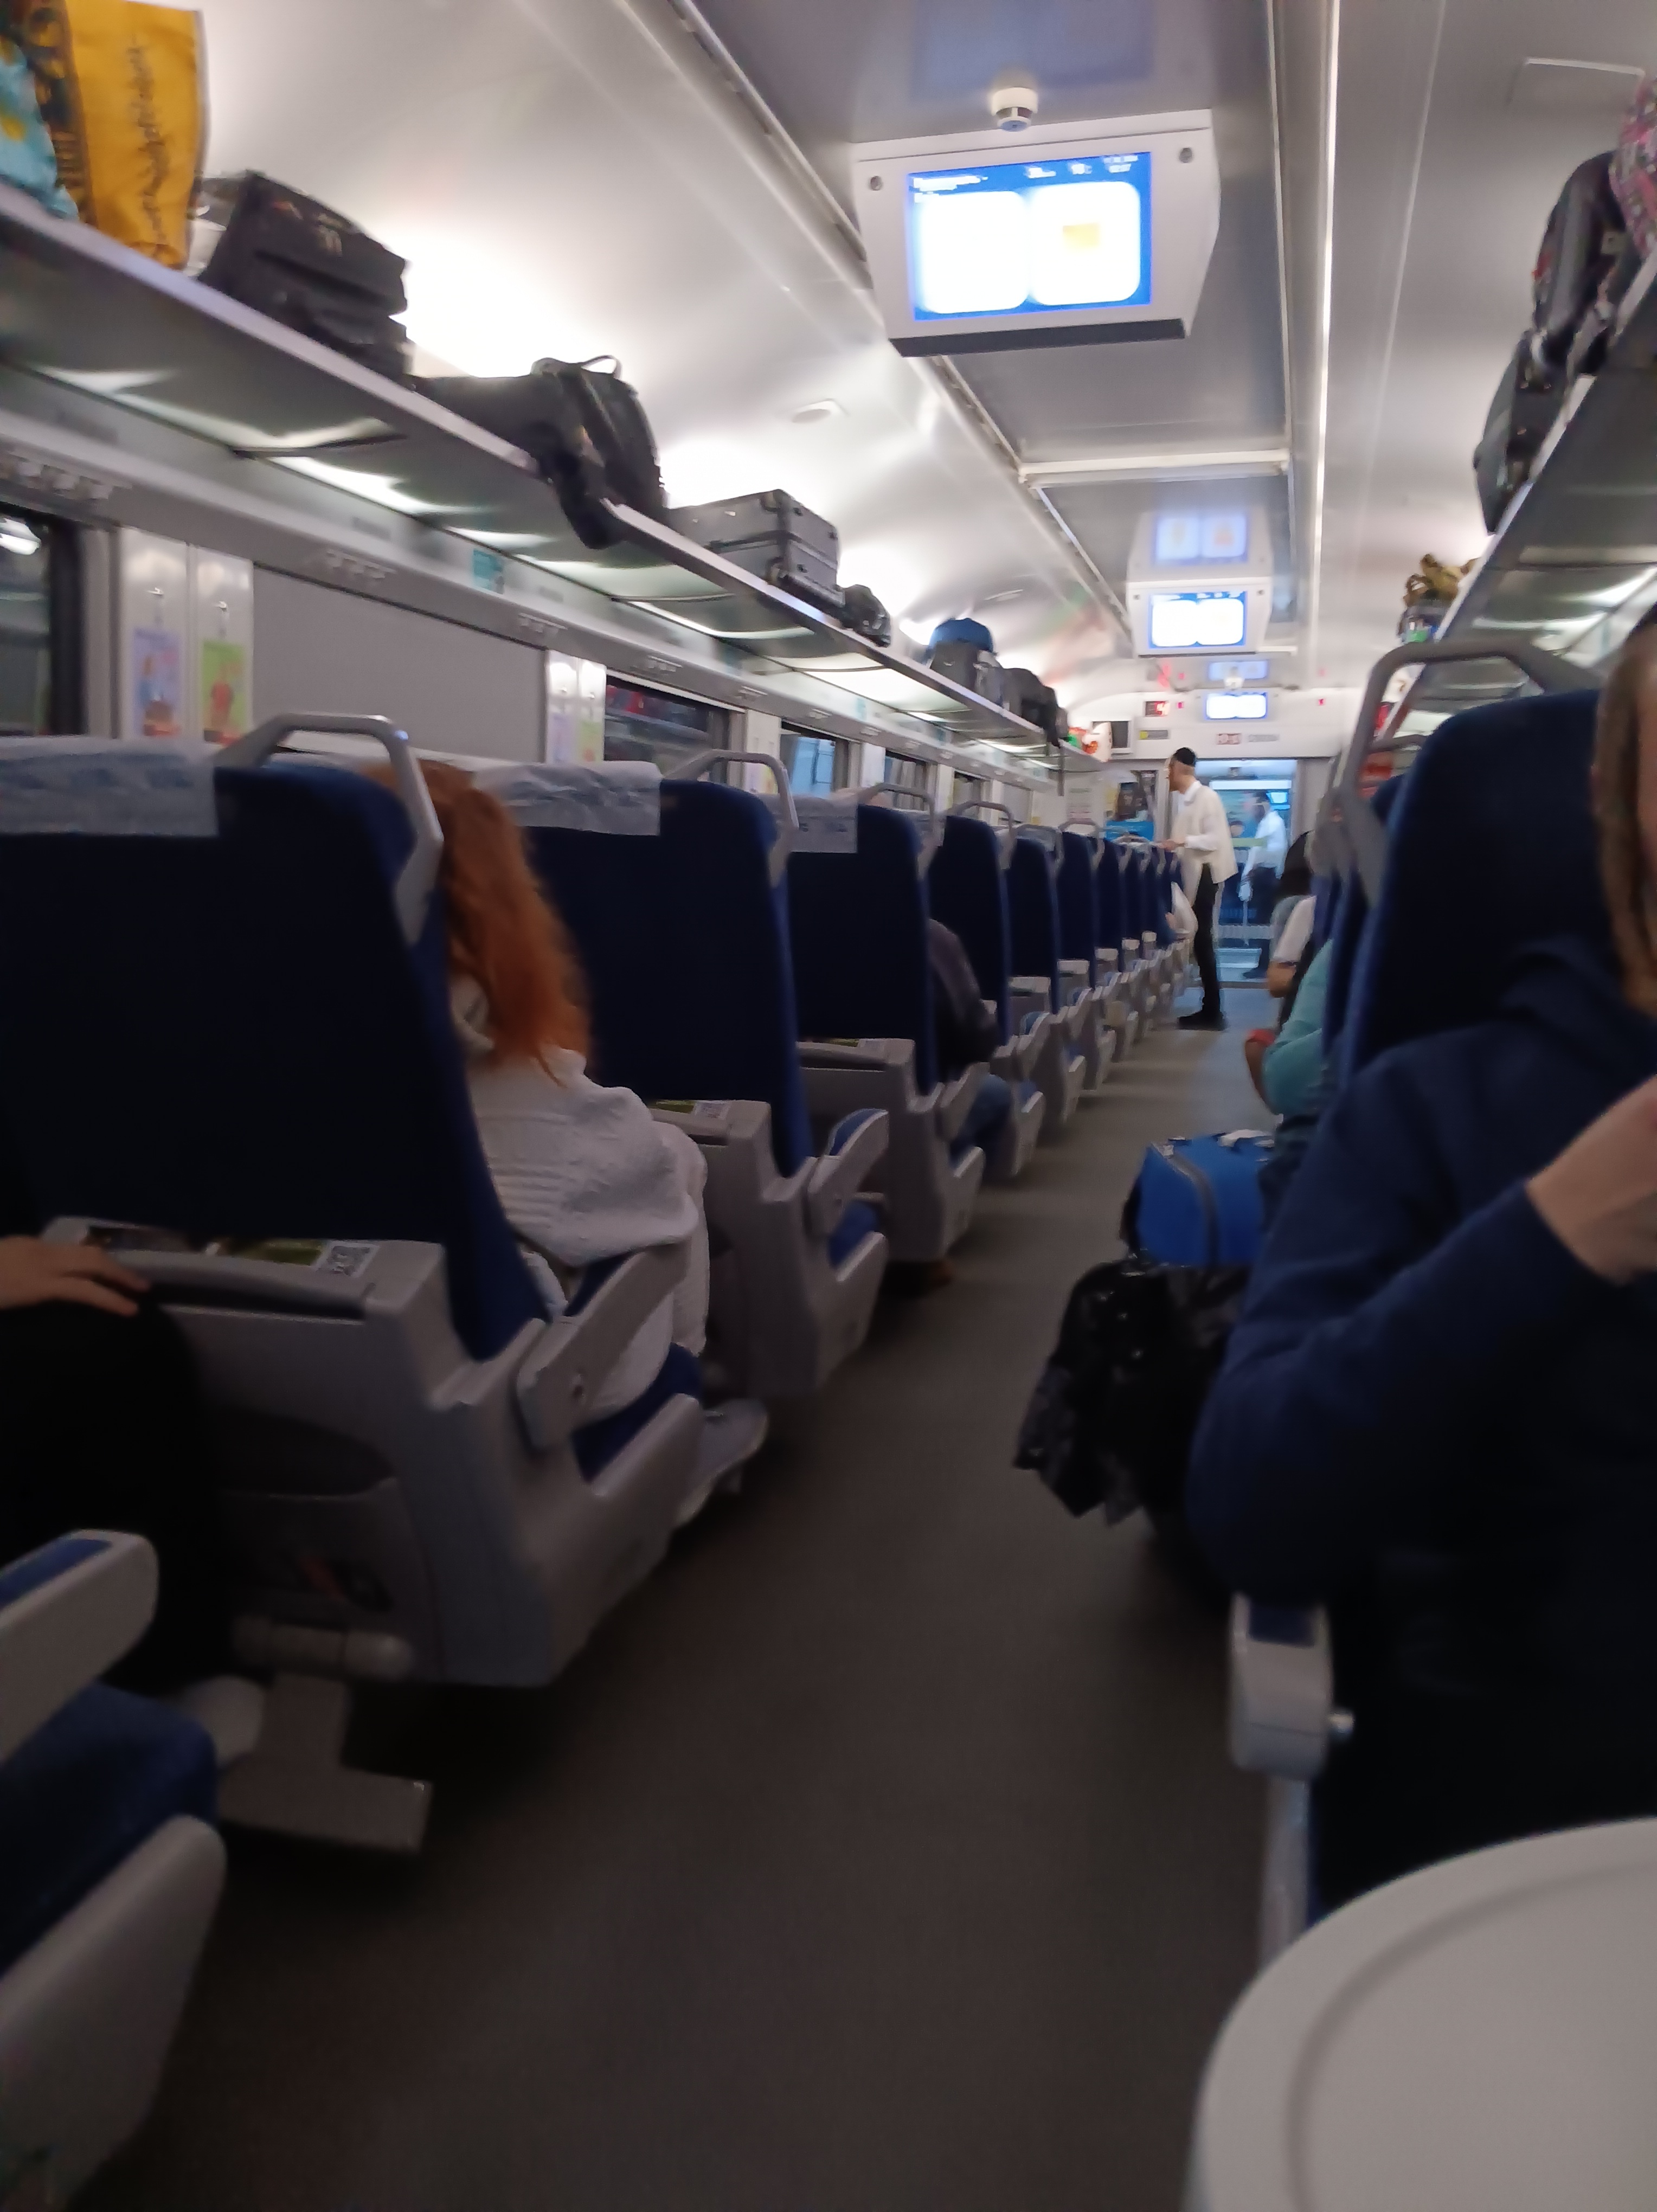
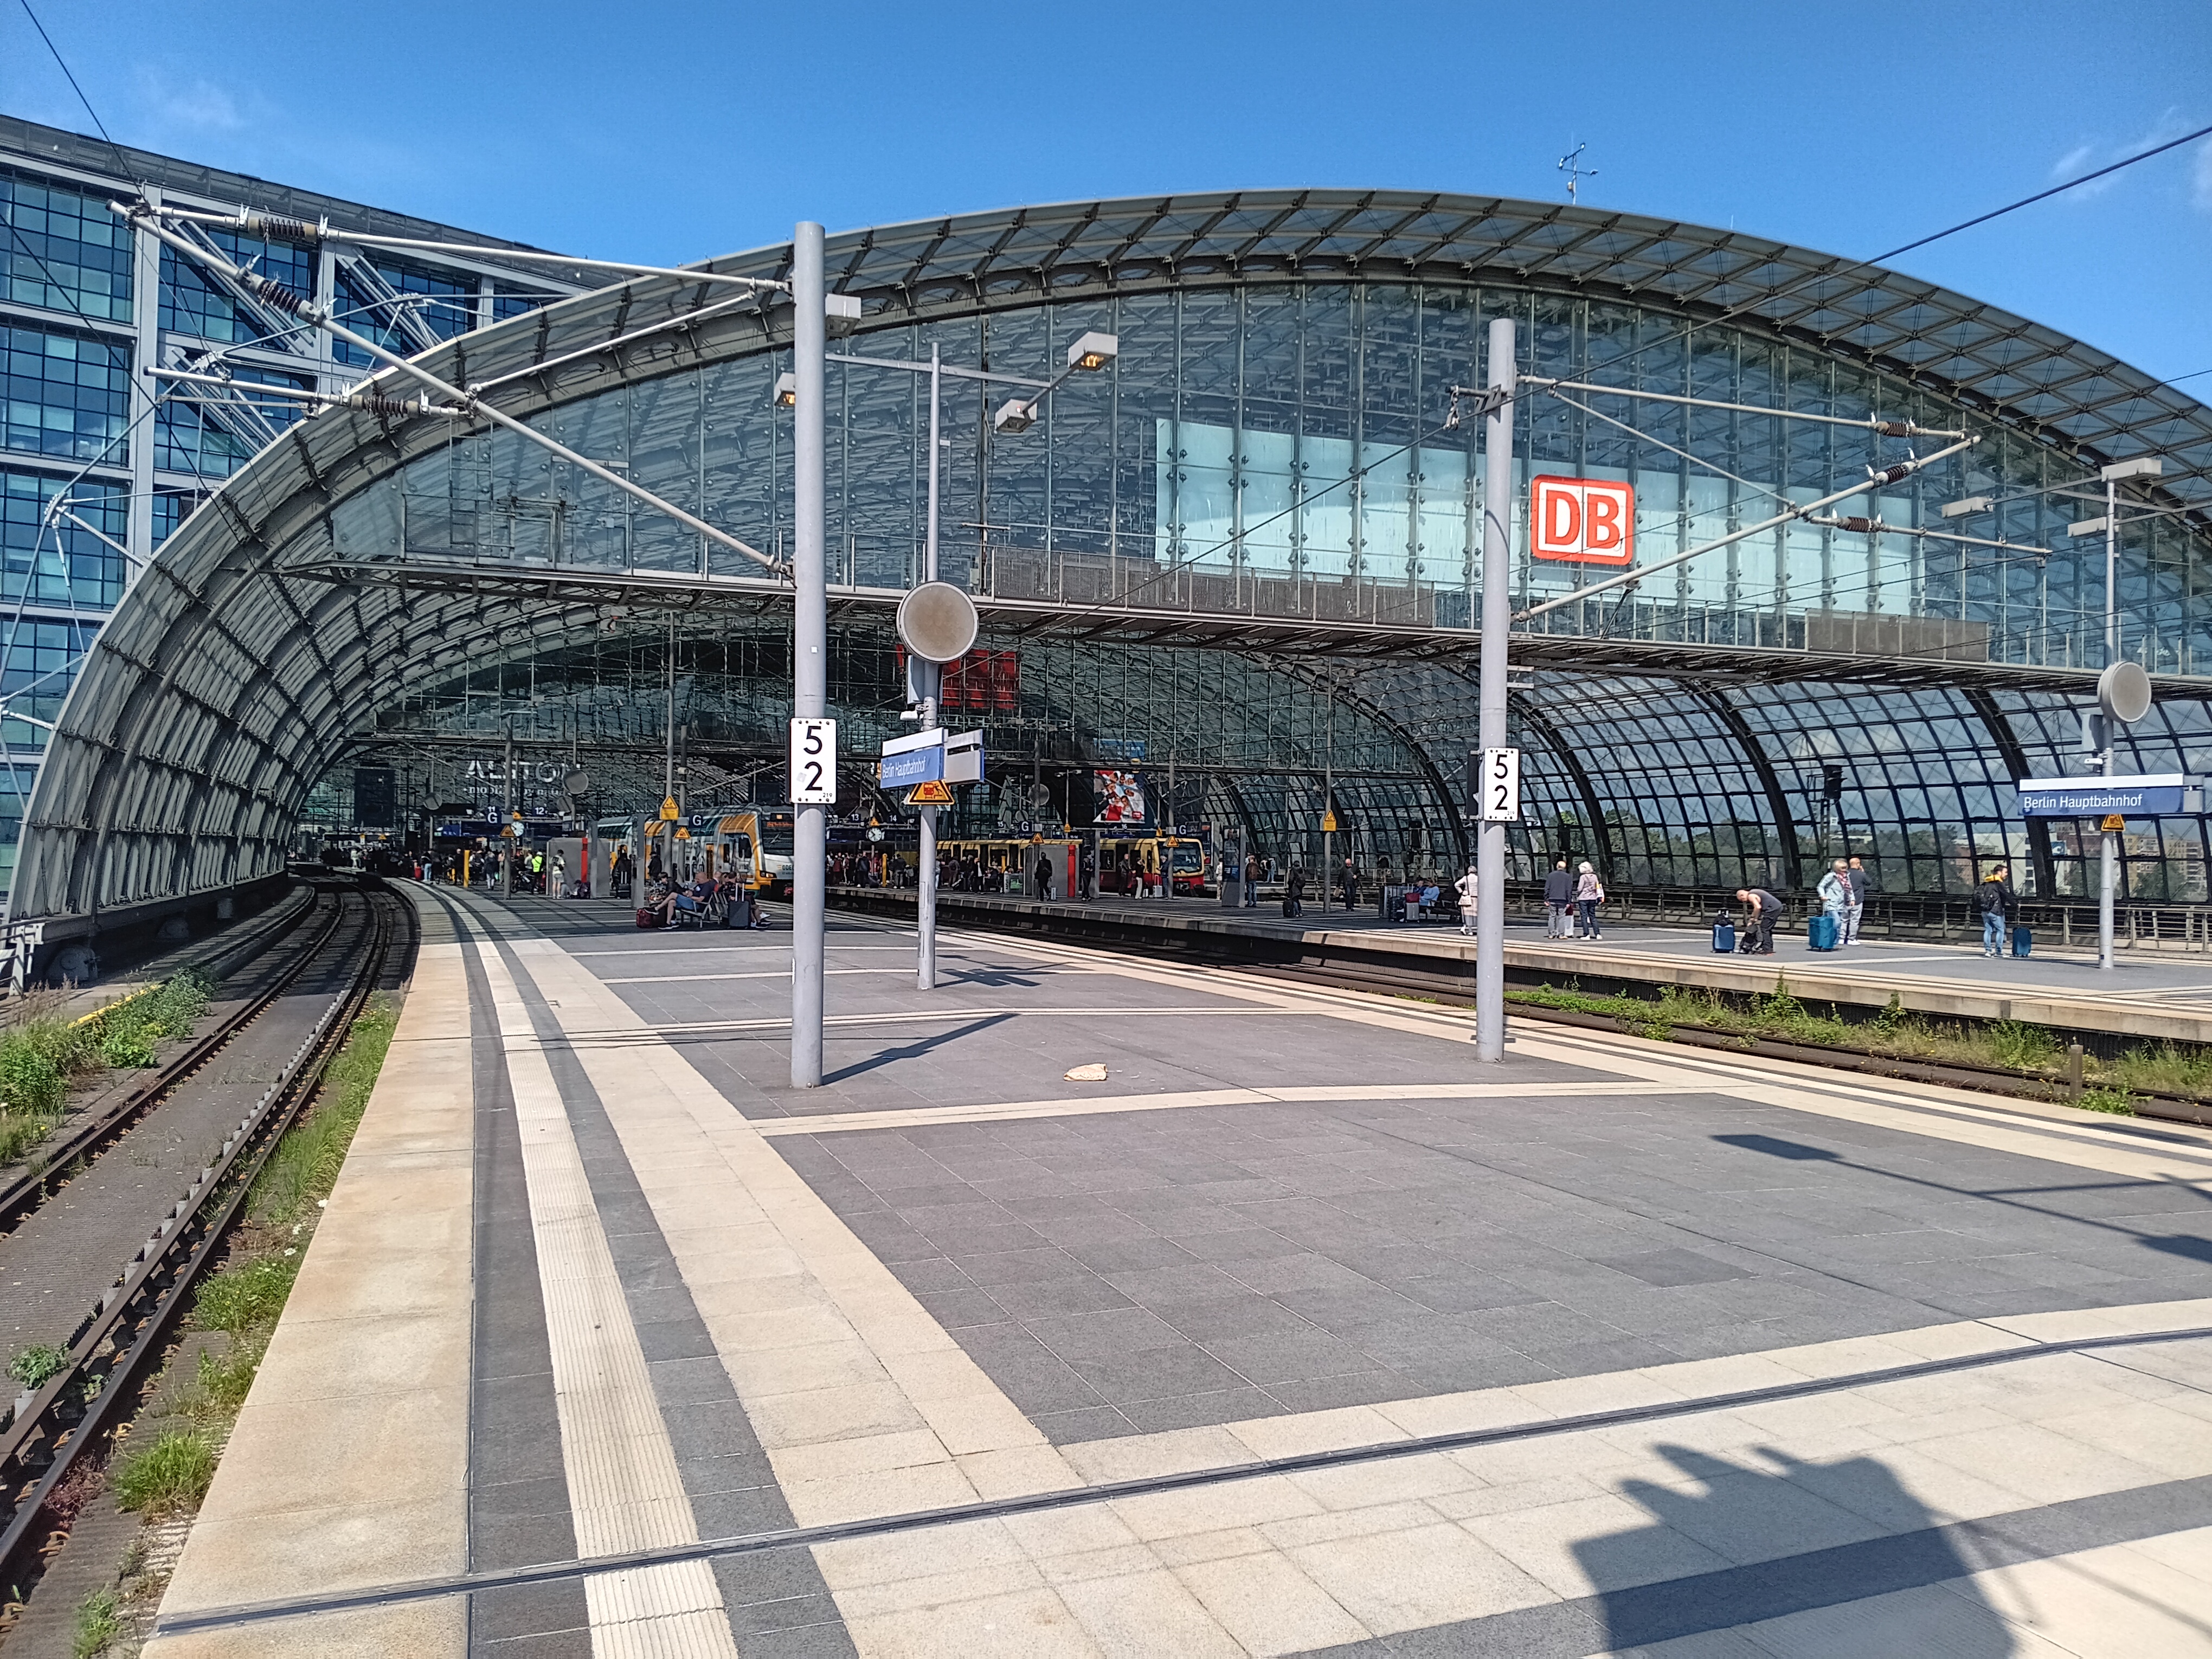
My voyage started at my parents home in Neustadt on the western edge of the Baltic Sea at 6 am. A first train got me to the old Hanseatic town of Luebeck, a second train to Hamburg, and a third train to Berlin. Here I bought the missing train ticket #5 from Przemysl in Poland to Lviv in Ukraine before boarding train #4 from Berlin to Przemysl. My reserved seat for the next 10 hours placed me opposite to a young Ukrainian artist traveling home to Kyiv. Along the way she introduced me to Lviv where she had lived in a prior life. Her pointers of Lviv places to visit, eat, and walk provided me with major initial reference points. As she had crossed the border into Ukraine many times before, we went for a evening stroll in Przemysl and found a busy beer-garden where we had a beer and gin tonic. Despite this “delay,” we still had to wait for 3 hours to be allowed on the next train that was 2 hours late. A large group of perhaps 20 Orthodox Jewish men with U.S. passports were waiting as well. I asked one of them what language they were speaking and he replied “Jiddish.” Bente Kahan’s music from her album “Farewell Cracow” was on my mind even more now than it was prior to this voyage. Once this last train left Poland just before midnight, the mood became somber.
Ukrainian border guards checked passports on the train while different heavily armed military personel counted the number of passengers at least 3 times independently of each other. It was pitch dark outside without any lights visible anywhere. The train, too, had lights dimmed. After a very short 45 minutes the train to Kyiv made its first stop in Lviv and I got off.
It was about 3:30 am local time and I had no idea how to get the 2 miles from the train station to my bed. During the general curfew from midnight to 5 am all public transportation stops. Nobody at Lviv’s station spoke English and I could not read the cyrillic signs. So I stumbled along dead tired hoping, first, that my GPS would lead the way and, second, police enforcing the curfew may be sympathetic towards a tired and lost American tourist.
Sun light came out when I arrived in my small appartment at 4 am. The Wifi worked flawlessly and I called my wife via WhatsApp. It was only 9 pm in Delaware and we talked for an hour on what had happened this long day. Then I let my Ukrainian AirBnB host, Olya, know that I had arrived:
Olya: Everything went well. A person found me at the train station. He did not speak English, but I had pen and paper prepared as well as lat/lon of your place on my GPS that I use for hiking in the woods. He followed my direction and got me within 200 m. The rest was easy including the hour-long WhatsApp phone call with my wife from inside your appartment using your Wifi. It “only” took me 22 hours total door-to-door, so I will now head for some sleep … which is hard, because it is light outside, curfew is over, and I already saw so many cool stuff in the dark that I want to head outside to explore more, but my wife told me to sleep a few hours and wise man is one who listens to his wife … or so i am told by wiser men than myself. ~Andreas
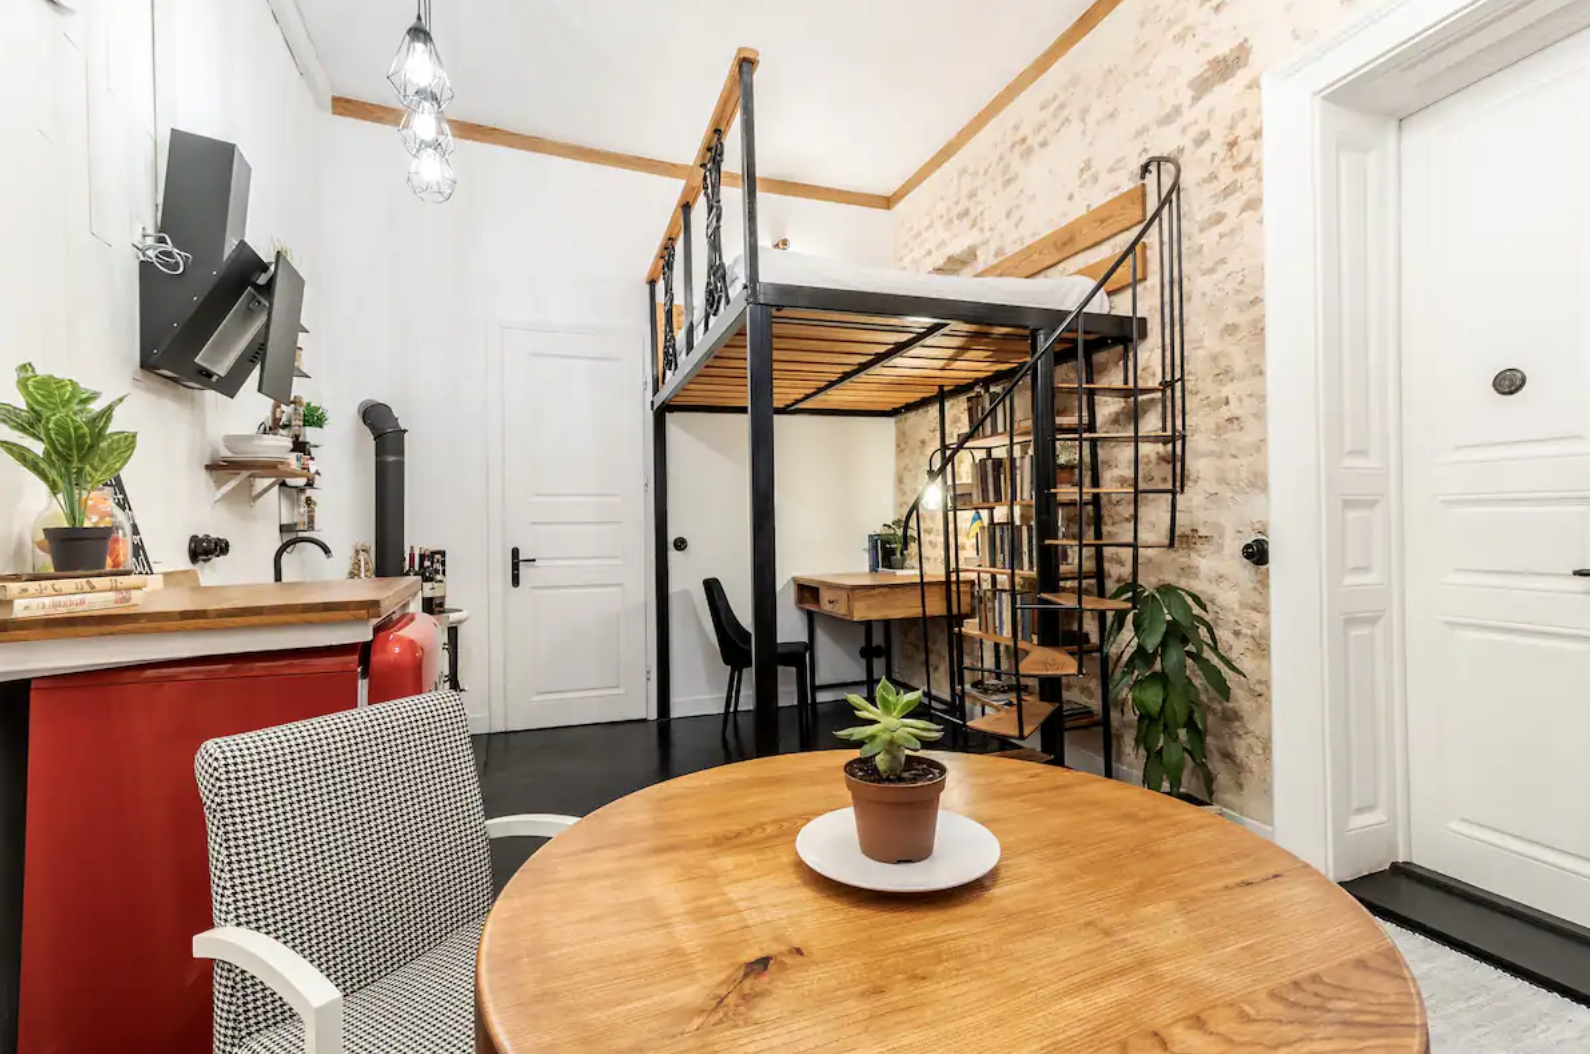
I was writing the above lines with this view of the bed, desk, fridge (red), and the door to the bathroom, shower, washing machine and dryer. The entrance is the door on the right. This was my home away from home for the next 7 days where I rested after long walks to explore Lviv, its culture, history, public life, and people. The internet speeds in Lviv were faster than those in either Germany or at home in Delaware.
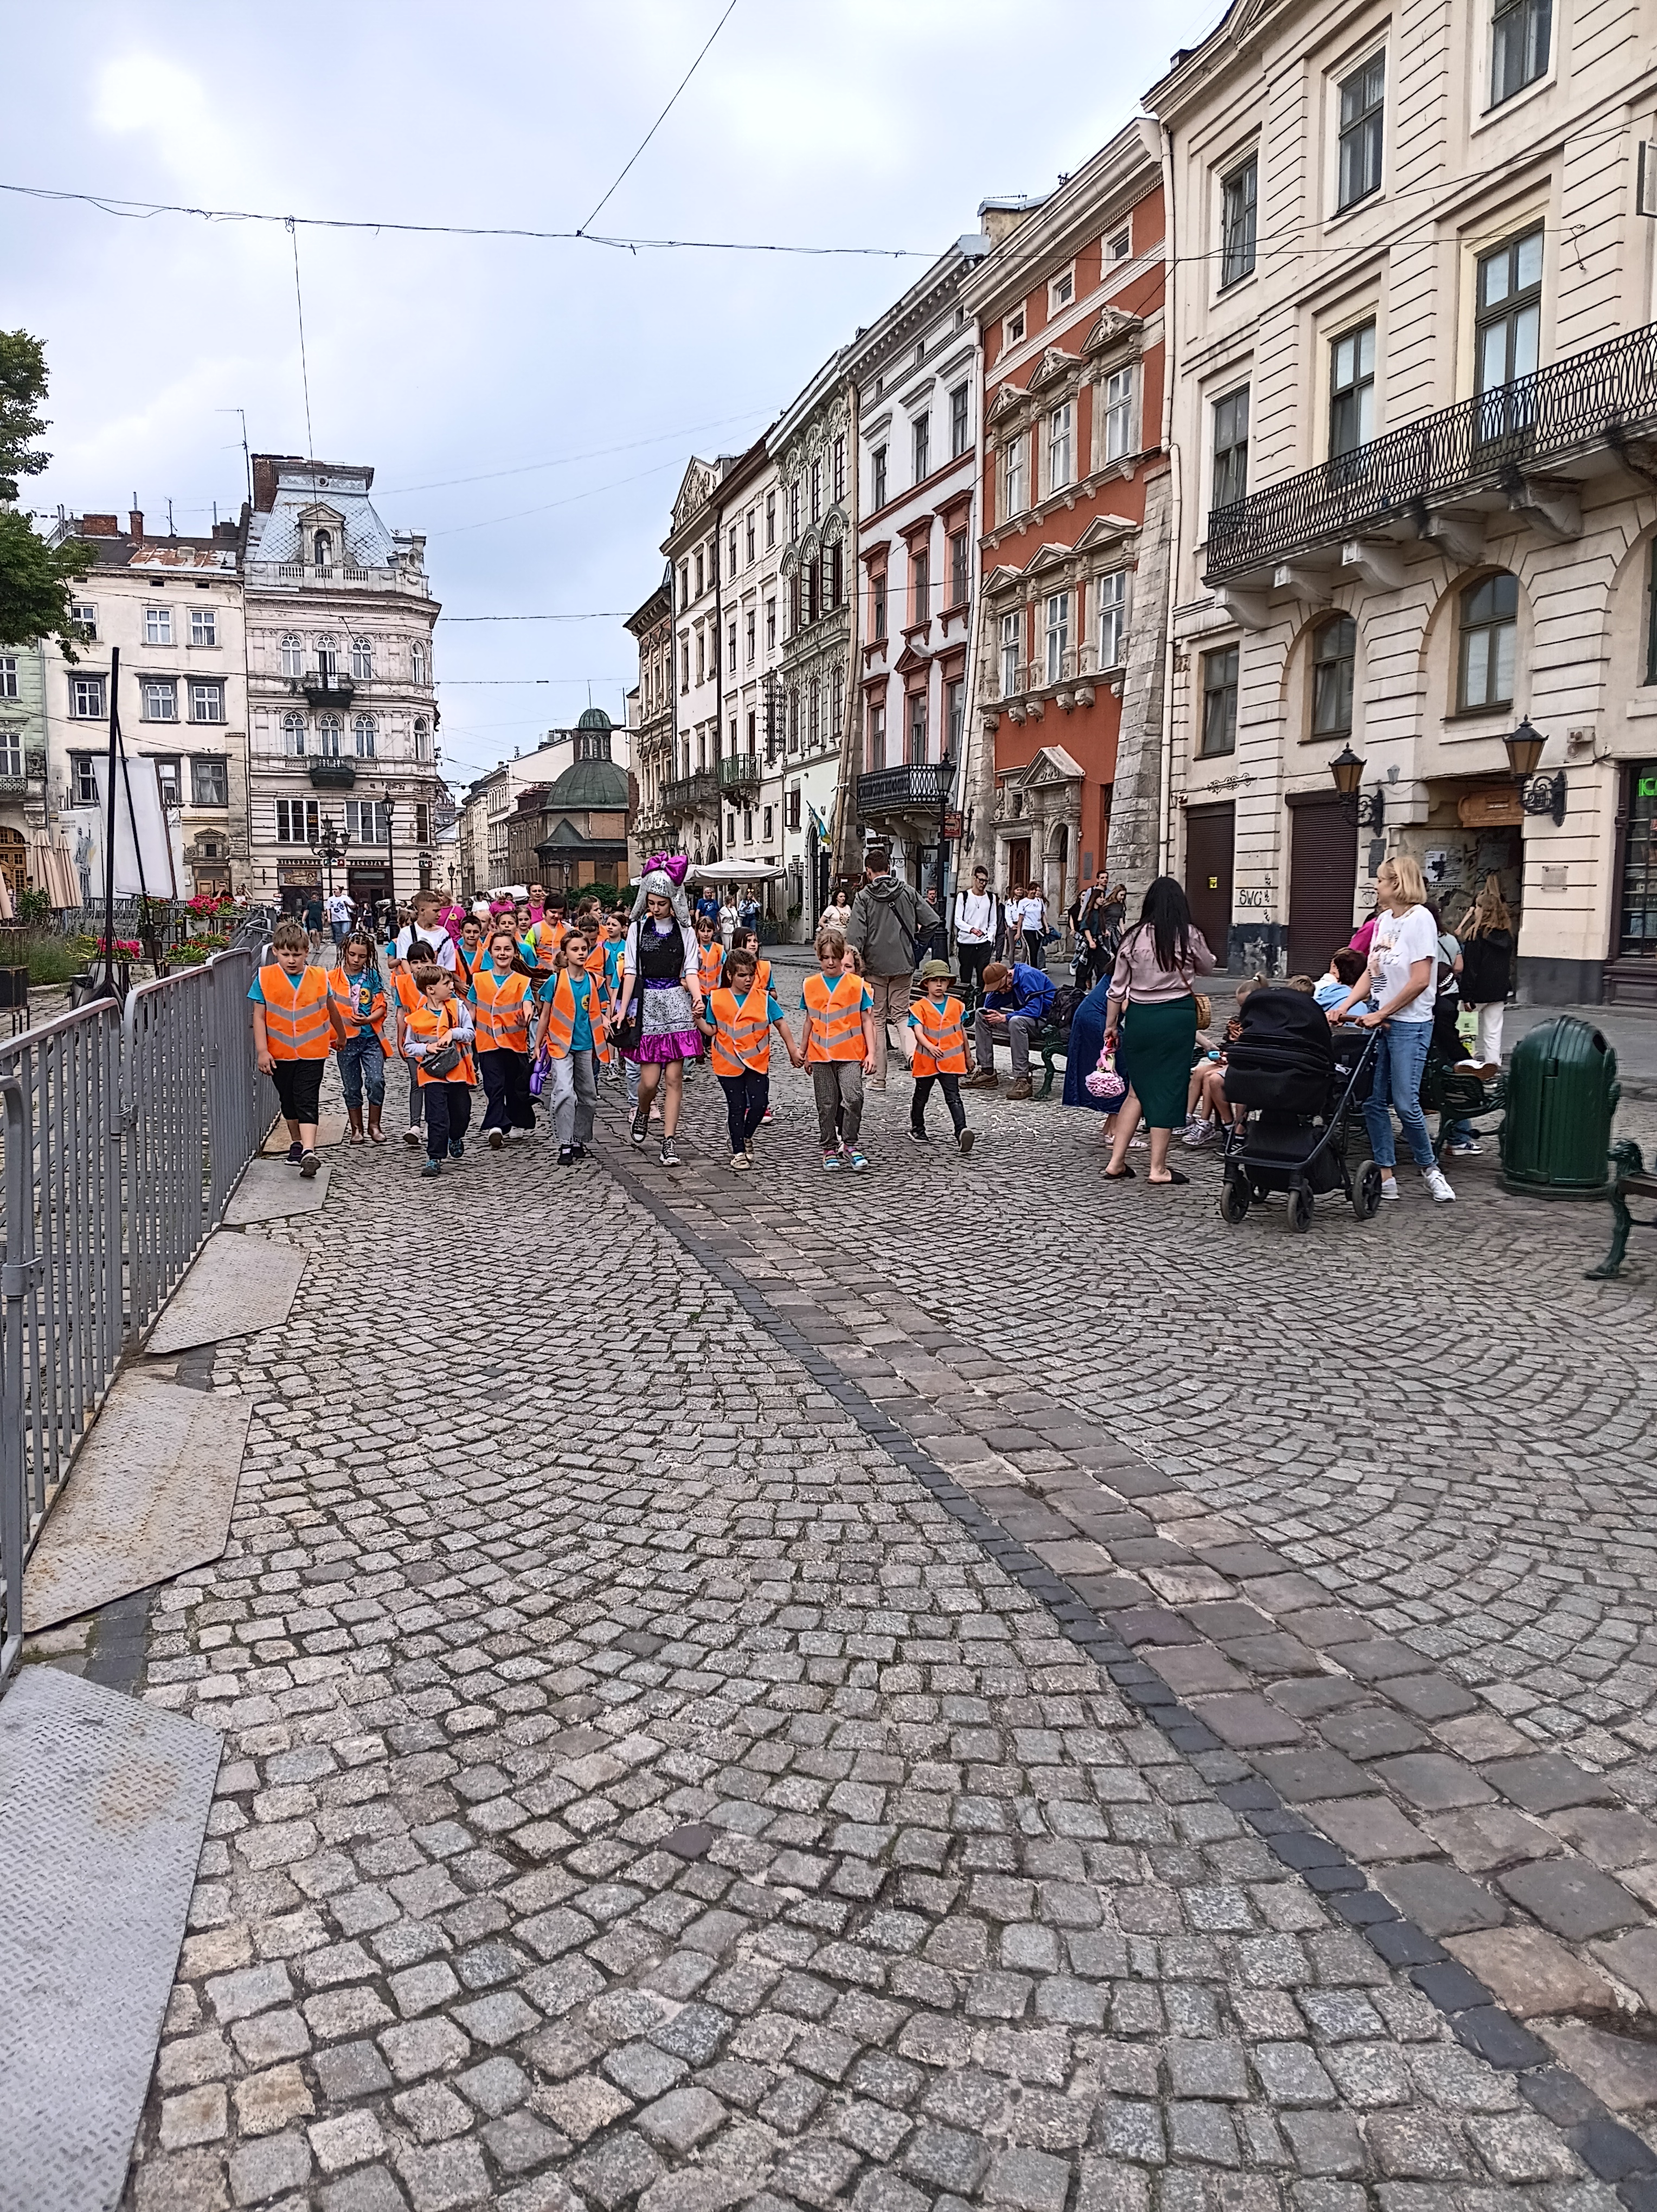
As a teaser for my next post I show the first three photos that I took the next morning after 4 hours of sleep within 5 minutes walking from my bed in Lviv.
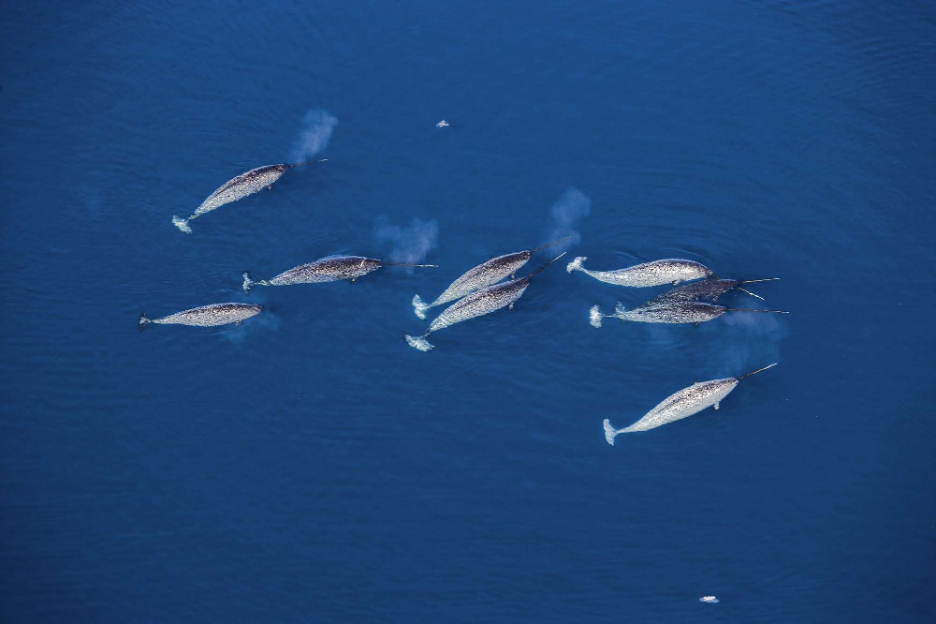
Having spent my whole life in Maryland, I know very little about narwhals or Greenland. When presented a figure of the distribution of 12 tracked narwhals (Figure 1), I noticed that these mammals spent the majority of their time away from the mouth of the fjord (Heide-Jørgensen et al., 2020), and that the fjord looked similar to the geography of the Chesapeake Bay in Maryland. To understand why the narwhals may prefer water near the tributaries to the fjord, I compared it to recorded locations of dolphins in the Chesapeake Bay.
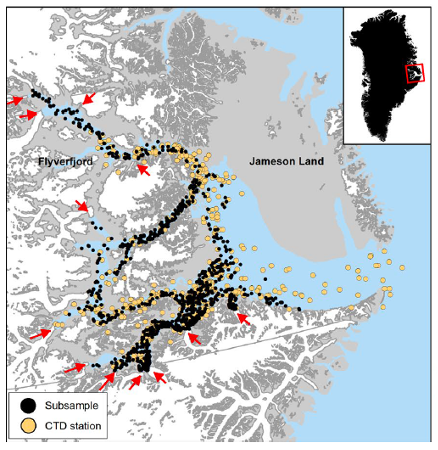
Data collected during a study on temperature-dependent habitat selection for narwhals displays 10 locations per day of 12 narwhals in Scoresby Sound in Greenland for a total of 1,000 positions (Heide-Jørgensen et al., 2020). The narwhals were tracked using satellite-linked time-depth recorders. The mapped positions of the narwhals (black dots) are more concentrated away from the mouth of the fjord complex where Atlantic water enters. Instead, they gather in tributaries on the western side of the fjord where there are active glaciers (red arrows).
Figure 1: Positions of 12 narwhals (black dots) tracked in Scoresby Sound fjord, Greenland. Positions were recorded 10 times per day, then resampled to 1,000 positions. Red arrows indicate active glaciers and yellow dots indicate positions where CTD profiles were collected (Heide-Jørgensen et al., 2020).
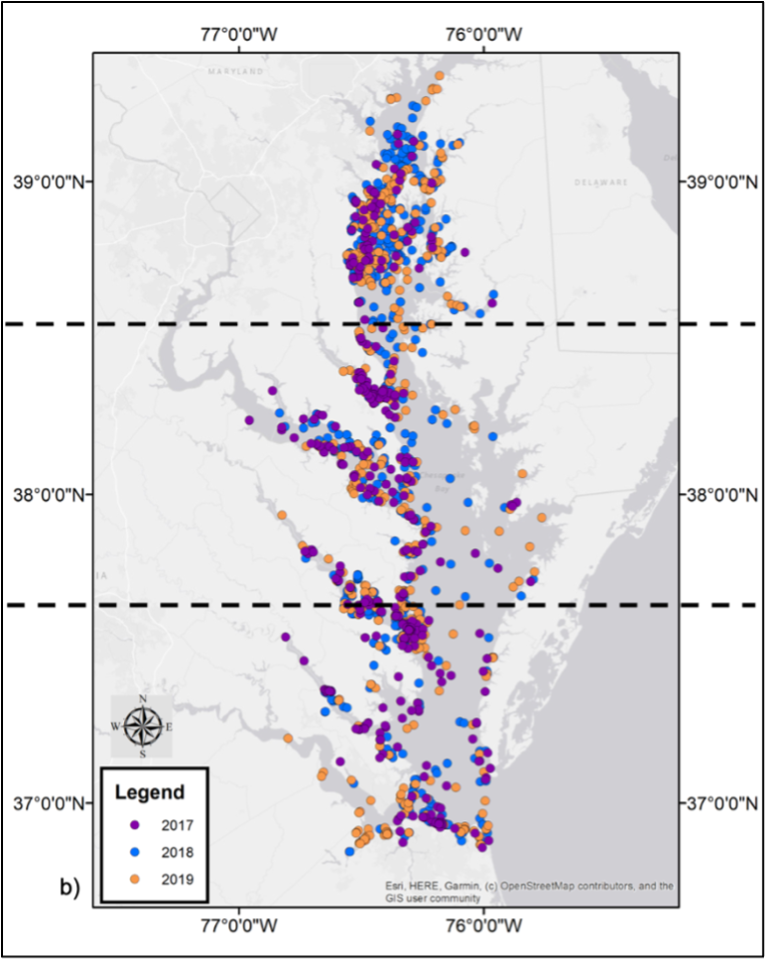
The University of Maryland’s Chesapeake Dolphin Watch program (https://www.umces.edu/dolphinwatch) maps citizen dolphin sightings throughout the Chesapeake Bay. Figure 2 below displays the locations of dolphin sightings in 2017 (purple dots), 2018 (blue dots), and 2019 (orange dots). The figure also divides the bay into the upper bay, middle bay, and lower bay, with the lower bay closest to the Atlantic Ocean (Rodriguez et al., 2021). Within these divides, the majority of dolphin sightings are recorded in the upper bay, and overall more dolphins were sighted on the western side of the bay. The dolphin sighting distribution in the Chesapeake Bay in 2017-2019 resembles narwhal distribution in Scoresby Sound, Greenland. Both dolphins and narwhals appear to be found away from the mouth and instead in the tributaries.
Figure 2: Dolphin sightings in the Chesapeake Bay in 2017 (purple dots), 2018 (blue dots), and 2019 (orange dots). The bay is divided into upper, middle, and lower sections with the lower section being closest to the Atlantic Ocean (Rodriguez et al., 2021).
Because of my familiarity with the Chesapeake Bay, I know that fresh water enters the bay from the tributaries and meets with salty water that enters from the Atlantic Ocean, which can be confirmed with salinity data available from the Chesapeake Bay Program (Reynolds, 2019). Applying this understanding to the Scoresby Sound, salinity is lowest where fresh glacial melt enters the fjord from the tributaries, as marked by red arrows in Figure 1, and salinity is highest where salty ocean water at enters the fjord at the mouth. Because the distribution of dolphins in the Chesapeake and narwhals in Scoresby Sound appear similar, and the bay and fjord have a similar pattern of salinity, I hypothesize that narwhals and dolphins prefer low salinity water.
However, while the narwhals in Scoresby Sound were tracked using satellite-linked time-depth recorders, the dolphins in the Chesapeake are mapped from civilian sightings. In Maryland, most people that live along the Chesapeake Bay live in cities and suburbs along the western shore of the Bay (U.S. Census Data from 2020, https://www.census.gov/data.html). Of the approximate 986,305 people that live along the western shore, there were 90 dolphin sightings in 2017, or about 0.912 dolphins per 10,000 people. Fewer people live on the eastern shore of the Chesapeake Bay, and of the approximate 244,798 people, 29 dolphin sightings were reported in 2017, or about 1.18 dolphins per 10,000 people. From this data, more dolphin locations were recorded on the western shore of the Chesapeake Bay as a result of more people living there.
Due to sampling bias, this citizen sighting data from the Chesapeake DolphinWatch program cannot be used to support the hypothesis that dolphins and narwhals tend to stay away from incoming salty water from the ocean because they prefer low salinity water. To better test the hypothesis, more accurate data of dolphin positions in the Chesapeake Bay would need to found by using satellite tracking devices similar to the ones used on the narwhals in Scoresby Sound.
Editor’s Note: Ms. Eleanor Smith wrote this essay as an extra-curricular activity developed from a science communication assignment for MAST383 – Introduction to Ocean Sciences. The editor teaches this course at the University of Delaware and was assisted by Ms. Terri Gillespie in a final formal edit.
Heide-Jørgensen, MP, Blackwell, SB, Williams, TM, et al.: Some like it cold: Temperature-dependent habitat selection by narwhals. Ecol Evol. 2020; 10: 8073– 8090. https://doi.org/10.1002/ece3.6464, 2020.
Rodriguez LK, Fandel AD, Colbert BR, Testa JC, Bailey H.: Spatial and temporal variation in the occurrence of bottlenose dolphins in the Chesapeake Bay, USA, using citizen science sighting data. PLoS ONE 16(5): e0251637. https://doi.org/10.1371/journal.pone.0251637, 2021.
Elections are messy, but patterns emerge. Elections have consequences, but people learn. Elections make news, but do we all know how they work? I did not and thus decided to learn. I served as a sworn-in Election Clerk in the State of Delaware this week to collect first-hand experiences. I wanted to decide for myself rather than just “believe” or “dismiss” abundant disinformation propagated by Russian and American troll farms on social media. I wanted to answer for myself, if the American election system is safe, fair, and secure. My answer is a resounding yes for New Castle County, Delaware.
My badge for the Sept,-15, 2020 Closed Primary Election in New Castle County, DE, USA.
Any registered voter can apply to serve at a polling station as an Election Clerk, Judge, or Inspector:
The State of Delaware needs more than 4,500 registered voters to work in polling places for the General Election. This is a unique opportunity to serve your community by participating in the electoral process!
Pay comes to about $10 per hour for a 19 hour commitment. Students enrolled at a university in Delaware and local High School students older than 16 can apply as well. Within a week of mailing my application I was assigned a date and location for both a 4-hour training session and an election. I worried about the many, usually elderly election workers during our current Covid-19 pandemic. I took a calculated risk, but our democratic system by the People for the People requires the People to actually run the elections. Random citizens working the polls on Election Day are one check on State Governments who organize the elections.
Election Day started at 6 am to set-up computers, machines, and voter information in the gym of a local Elementary School. The first voter appeared at 7 am sharp while the last voter left shortly after 8pm. I left the school at 9 pm after votes were tallied, results were signed by each of poll workers and posted at the school. Multiple signed copies of votes and results were delivered by different people to different officials and offices. This includes both electronic and paper copies of each vote. I was home at 9:15 pm, exhausted, sore, and tired. A Samuel Smith’s Imperial Stout helped me to end the day happy, proud, content, and with many stories to share.
The best part was a wonderful, random, fun, and most diverse group of 11 poll workers. We ranged in age from 21 to 75 (or so), almost evenly split male/female, black/white, college/non-college, etc. and all with a refreshing sense of humor and purpose. One of us was a pastor, a postal worker, a home-maker, two professors, a school psychologist, a teacher, and we had at least three grand-parents. About 540 people came in to vote, only one person tried (and failed) to cheat by voting twice. He tried to vote in-person after he had mailed-in his absentee ballot which the State received already. He was politely told to leave which he did quietly. Perhaps he just tried to test the system, or he just forgot that he mailed his ballot, or he just listened to a paranoid and ignorant politician who told people to vote early by mail and then try to vote again in person. Either way, nobody voted twice.
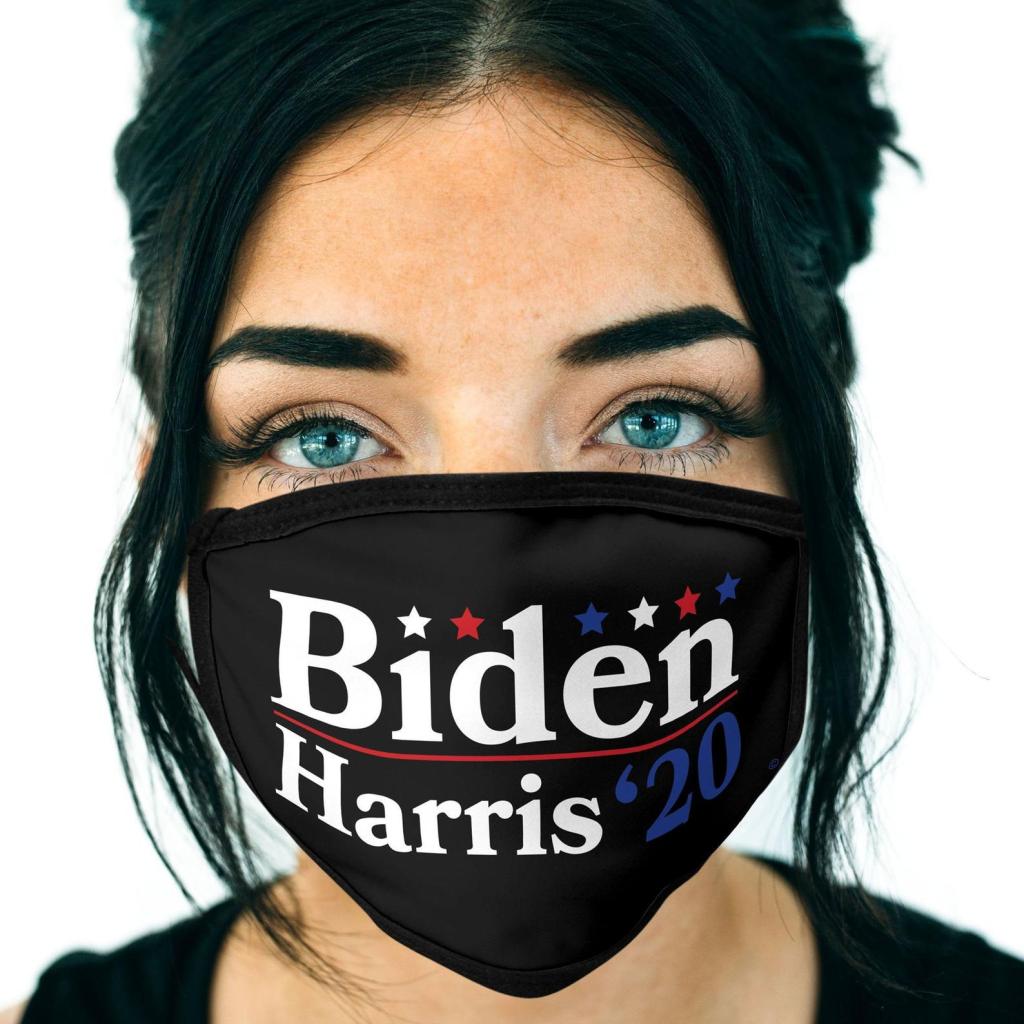
Example of a mask violating Delaware’s Electioneering Laws, if worn inside a polling place.
We only had 3-4 people who tried to violate State Electioneering Laws (Del. Code Ann. tit. 15, §4942(a); (d)) by displaying partisan buttons, masks, hats, or t-shirts inside the polling place. This is illegal in Delaware and elsewhere; so please do not bring Biden/Harris or Trump/Pence buttons or similar partisan apparel or clothing to the the polling place. The “Electioneering” link is from the bipartisan National Association of Secretaries of State. Interestingly, all three “electioneers” were angry, white, male, 45-60 years old, and affiliated with the same party. They represented less than 2% of that party, but the three men succeeded in causing drama, emotional turmoil, and disruptions both inside the polling place and afterwards. I will fight for them to express their views as guaranteed by the U.S. Constitution, but their freedom of speech is limited inside the 50 feet diameter of the polling place during the 13 hours that people vote there. Several U.S. Supreme Court decisions back this view.
Only one person did not wear a mask, but this was my fault. He entered with a mask that carried in large letters a partisan political statement not allowed inside the polling place. When called on this by an Election Clerk he got angry and started to argue, but he was happy when I told him that he did not have to wear as mask that he promptly took off. [It was my mistake to tell him that not wearing a mask does not disqualify him from voting.] I asked to handle this person and borrowed the crutches of our oldest poll worker (with her permission) to use as a “teaching prop” of the 6 feet distance that I needed. He co-operated nicely and I thanked him for his important participation in an important process.
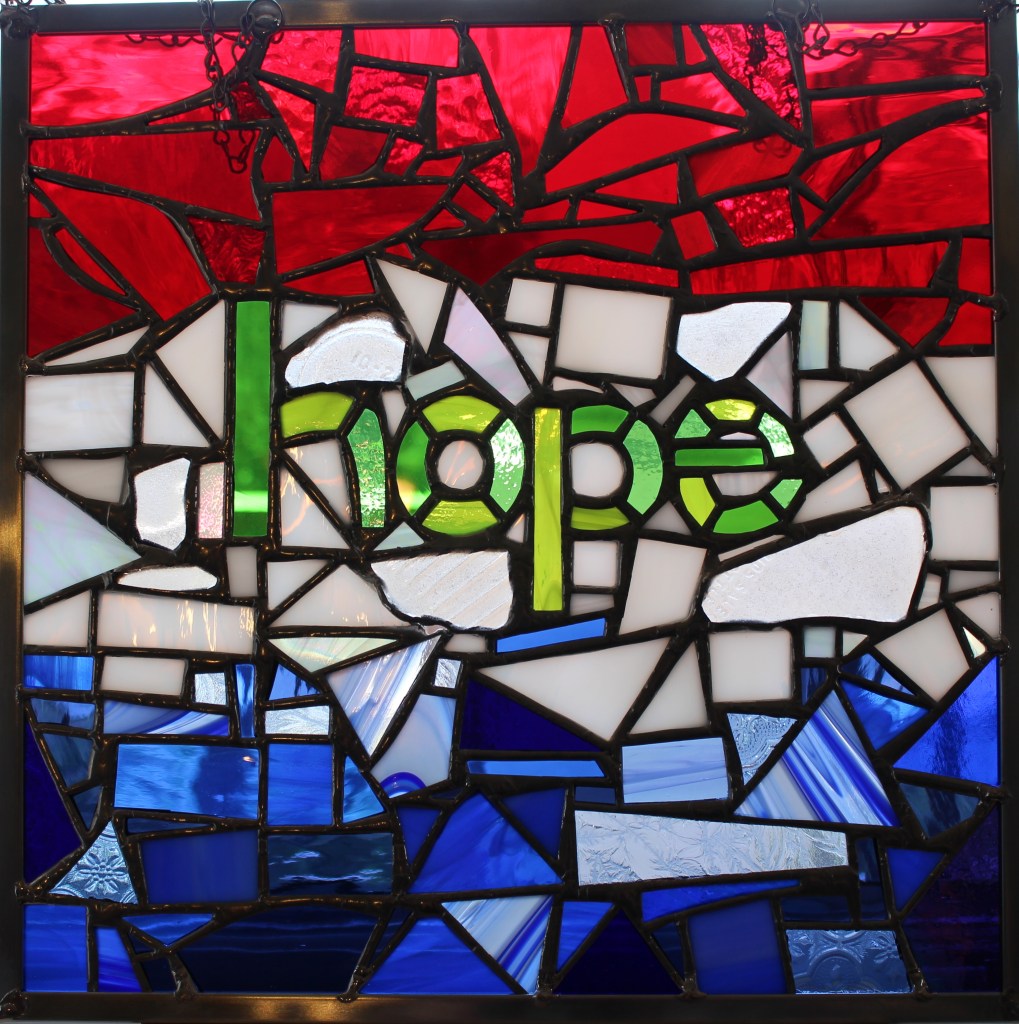
A more positive experience for me was to see how diverse my local community is. People of all colors, genders, ages, handicaps (both physical and mental) gave me a new perspective on who lives in the same town with me. I noticed an especially happy and celebratory atmosphere of the many black women of all ages who often came with their teenage sons and daughters to vote also. Many couples had different party affiliations and got along just fine. Kids came, too, as their parents voted and show them how its done. There is Hope and Strength in Diversity.
As a skilled physical scientist and computer geek, I conclude that it is almost impossible to “cheat” on the actual vote both for absentee (often called mail-in) or in-person ballots. I also conclude that Russian and American trolls and politicians try to suppress, manipulate, and disrupt the vote by spreading lies and disinformation to create doubt and confusion. The threat becomes real, if we the People believe and spread such lies. Our voting system has evolved over more than 200 years. It is secure as (a) both electronic and paper copies of each ballot exist; (b) all containers, machines, and access points are sealed, documented, and traced; (c) custody of all materials is transparent with multiple checks; and (d) it is random People like you and me who run the nitty-gritty of elections. The process is transparent and open to anyone willing to spent 4 hours of training and 14-15 hours on Election Day.
P.S.: I had myself tested for Covid-19 this morning. The sore throat and cough probably resulted from talking to more people than I have seen the last 7 months and breathing through a mask for 15 hours straight.