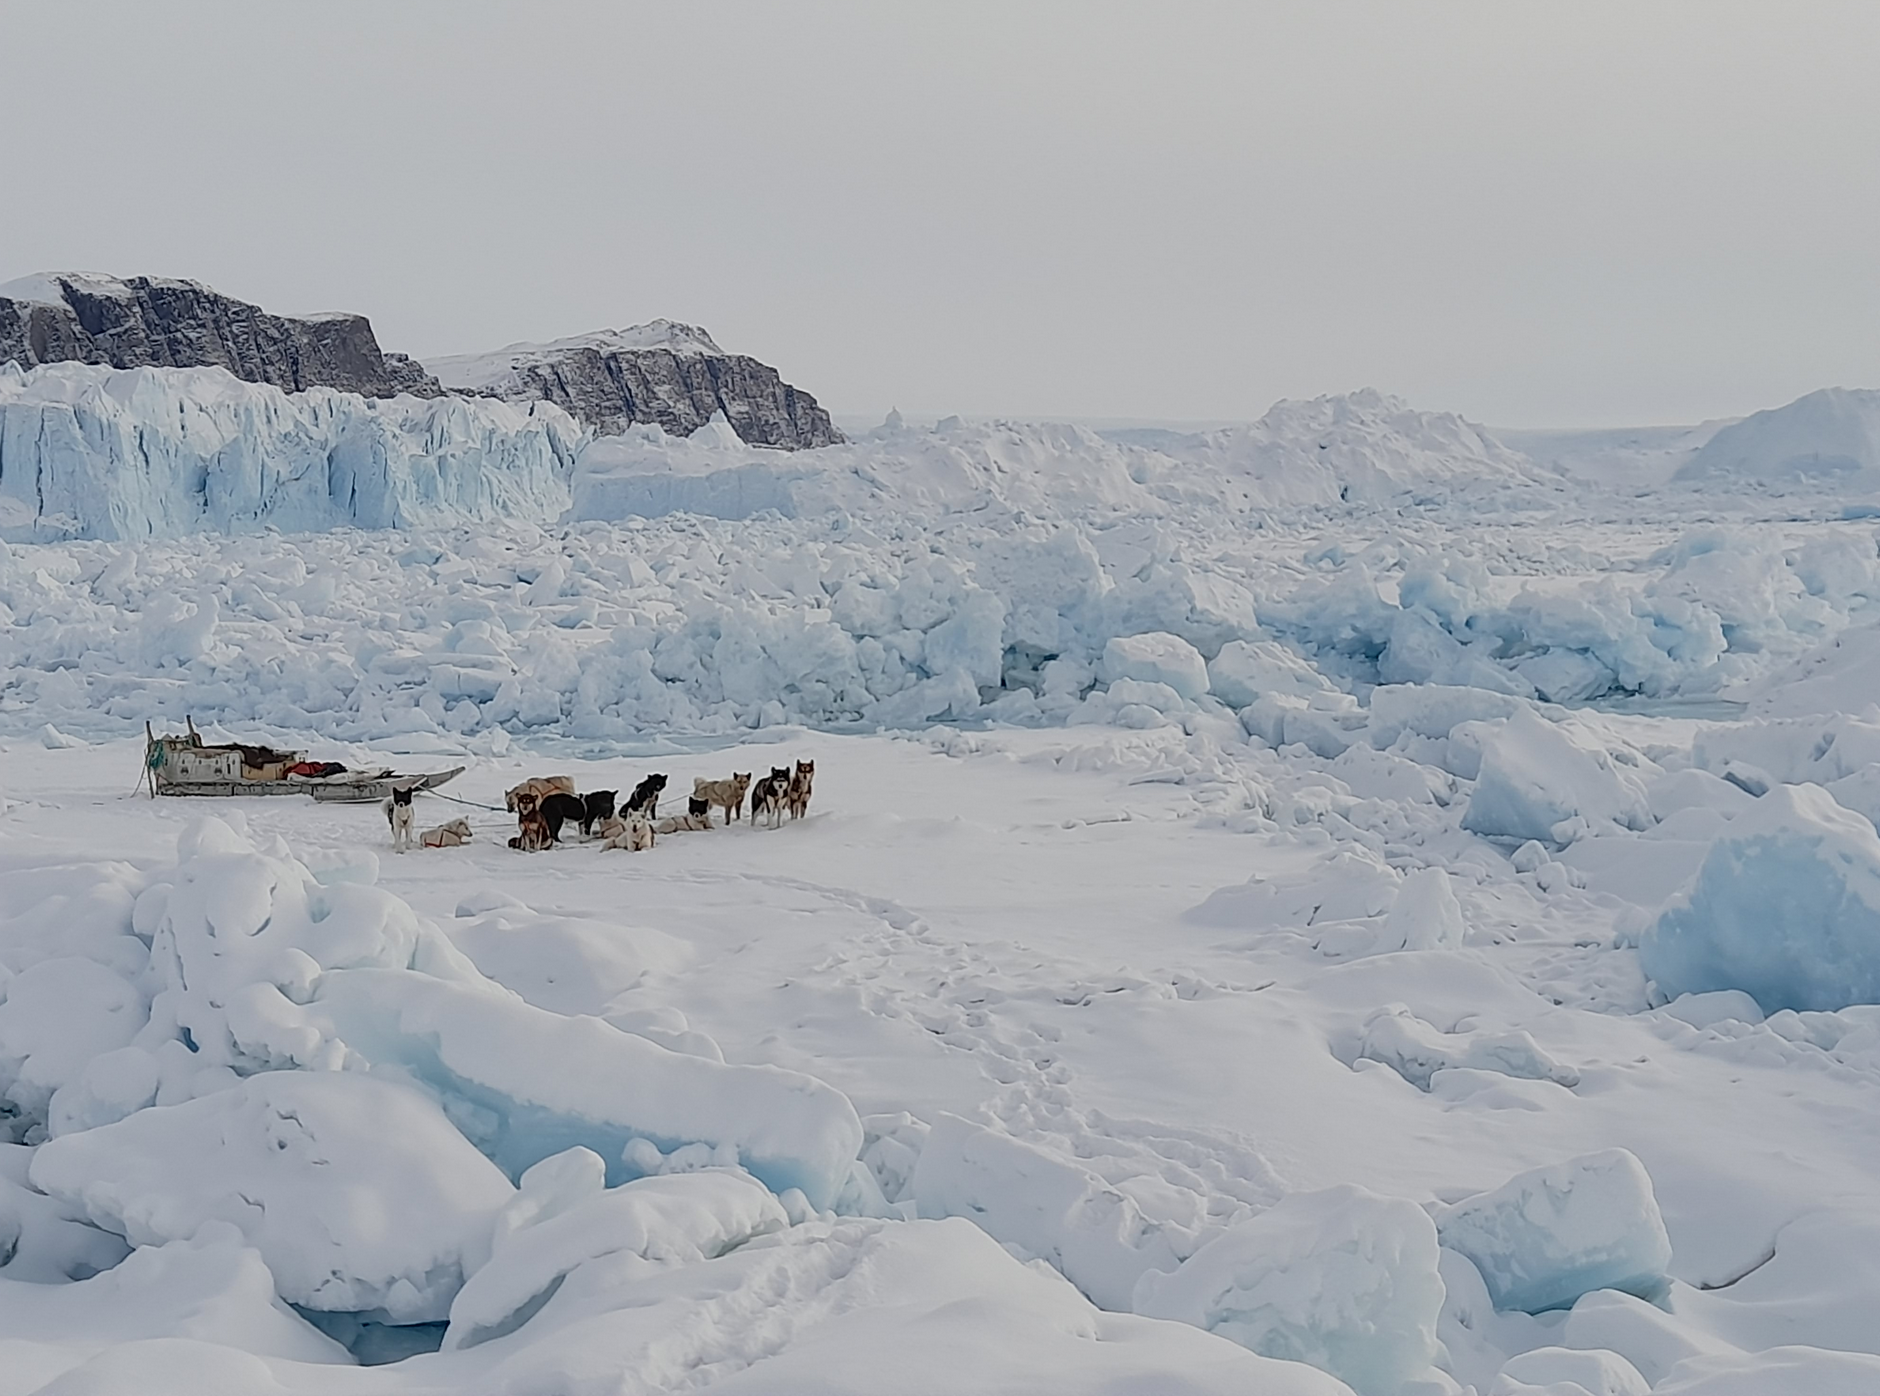
Greenland’s coastal glaciers melt, shrink, and add to globally rising sealevel. They also drive local ocean currents that move icebergs around unless they are stuck on the bottom. The glaciers’ melt is cold fresh water while the adjacent ocean is both salty and warm. Checking on what we may expect against observations, I here use data from NASA’s Ocean Melts Greenland initiative that dropped ocean probes from an airplane into the ice waters off coastal Greenland to measure ocean temperature and salinity.
For six years these data show how the coastal ocean off Greenland varies from location to location next to glaciers as well as from year to year. More specifically, I picked Melville Bay in North-West Greenland for both its many glaciers and many dropped NASA ocean sensors. The ocean data allow me to estimate ocean currents by using a 100 year old physics method. I just taught this to a small class of undergraduate science students at the University of Delaware. My students are strong in biology, but weak on ocean physics. This essay is for them.


Melville Bay is a coastal area off north-west Greenland between the town of Upernavik (Kalaallisut in Greenlandic) near 73 N latitude where 1100 people live and the village of Savissivik (Havighivik in Inuktun) at 76 N latitude where 60 Inuit live. There are no other towns or settlements between these two villages that are about as far apart as Boston is from Philadelphia, PA. Imagine there were no roads from Boston to New York to Philadelphia but only one large glacier next to another large glacier. This is Melville Bay.
Below I show an excellent set of photos of Savissivik by a French husband and wife team who visited in 2013/14. Their photographic gallery captures elements of contemporary subsistence living in remote Greenland where animals like seals, birds, fish, narwhal, and polar bears provide food, fuel, clothing, and income.

NASA dropped some 50 ocean sensors into Melville Bay froma plane during the short summer seasons each year 2016 through 2021. I met NASA pilots, engineers, and scientists doing their experiments when I was doing mine from a snowmobile in April of 2017 and again with Danish friends from a Navy ship in August of 2021, but these are stories for another day.
Let me start with a map of where NASA dropped their ocean profiling floats into Melville Bay and thus introduce the data. While the surface waters are usually near the freezing point, waters 300-400 meters deep down are much warmer. They originate from the Atlantic Ocean to the south and one of the goals of NASA’s “Ocean Melts Greenland” campaigns was to determine if and how these Atlantic waters reach the coastal glaciers. Most glaciers of Melville extend into this warm ocean layer and thus are melted by the ocean.


In the map above I paint the maximal temperatures in red and the bottom depths in blue tones. The profile on the right shows data for all depths at one station. As salinity increases uniformly (red curve) the temperature increases to a maximum near 300-m depth (black curve). It is this maximal subsurface temperature that I extract for each station and then put on the contour and station map on the left. The straight blue line connects Upernavik in the south with Sassivik in the north. It is an arbitrary line, coast-to-coast cutting across Melville Bay.
The warmest warm waters we find near Upernavik in the south and within a broad submarine canyon that brings even warmer waters from Baffin Bay towards the coast. Temperatures here exceed 2.4 or even 2.7 degrees Celsius. Most coastal waters along Melville Bay have a temperature maximum of about 1.5 to 1.8 degrees Celcius (about 35 Fahrenheit) and this “warm Atlantic” ocean water melts the coastal glaciers. The ocean melts the glaciers summer and winter while the warm air melts it only in summer.

There is more, because the glaciers’ melt also discharge fresh water into the ocean where it mixes to to form a layer of less dense or buoyant water. The buoyant waters create a local sealevel that is a little higher along the coast than farther offshore. The map above indicates that this “little higher sealevel” comes to about 4 cm or 2 inches. If this pressure difference across the shore is balanced by the Coriolis force, as it often does, then an along-shore coastal current results. This coastal current would move all icebergs from south to north unless they get stuck on the bottom. Along the northern coastline of Melville Bay the surface flow is from east to west. The coastal current is strongest near Savissivik where we find a (geostrophic) surface current larger than 40 cm/s. At that speed an iceberg would move more than 21 miles per day. Such strong surface flows are exceptional and diminish rapidly with depth. Hence a freely floating iceberg with a draft of several hundred meters would move much slower than the surface current.
I met a hunter from Savissivik in April of 2017 and for a fast-moving night we discussed the state of local fishing, hunting, living, traveling, and working on the sea ice next to the glaciers of Melville Bay. He invited me to become his apprentice. As such I would now ask him about the surface currents outside his home. Which way does he observe the icebergs to move in summer or winter? Has hunting on the sea ice in winter changed over his life time? When is it safe to travel there with a dog-sled? Could he and I perhaps work together during the spring to deploy ocean sensors through the sea ice? I am dreaming again …


