Tag Archives: physics

Rotations, Spin, and People

I hate to rotate. It makes me sick. And yet, every day I spin at 800 miles per hour, because living on a spinning earth does this to me. Why does the earth spin at all? [CalTech answer.] Did it always spin the way it does now? [No.] Could it spin in the other direction that would make the sun rise above the horizon in the West rather than the East? [No.] If not, why not? [Not sure yet.] I am pondering these questions as I will teach my first undergraduate class in ten days:

I plan to introduce how oceans and atmospheres circulate to distribute heat, water, and “stuff” like food and plastics across the globe. There is lots of rotation, lots of angular momentum, lots of torque and I am unsure, if a text book and lecture via Zoom will make much sense. So, today I discovered several fun and smart and insightful videos that I may even pose to my students as Homework or Exam questions 😉

The first set of videos I discovered today is Derek Muller’s Veritasium channel on YouTube. He covers a range of physics, math, and even biology topics, but I here focus on his wing nut problem. He entertains by explaining a strange and even bizarre observation made in space some 30 years ago. A Russian engineering astronaut noticed a rotating wing nut change its rotational axis repeatedly. Russia kept the observation top secret for over 10 years for reasons not entirely clear, but here is a modern attempt to explain what happened. It also applies to how tennis rackets rotate:

Now this reminded me of a problem that I encountered during my third year studying physics in Germany. I never solved or understood this so-called spinning-hard-boiled-egg problem that the Physics Girl describes so well. Her real name is Dianne Cowern and I use her videos in my graduate statistics class where her voice and physics shatters wine glasses via resonance. Today I discovered many more of her PBS Digital videos that all are filled with fun, beauty, and smart explanations. She plays with vortices in air and water and in between.

Now how does this relate to oceanography and meteorology? Well, we all live somewhere on the spinning top or egg or peanut that we call earth. Gravity keeps us grounded, but rotating objects can do strange things as the above two videos show. And when rotation becomes important we are not just dealing with linear momentum, but also angular momentum. When rotation becomes important, we must consider torques that generate angular momentum in ways similar to how forces generate linear momentum.

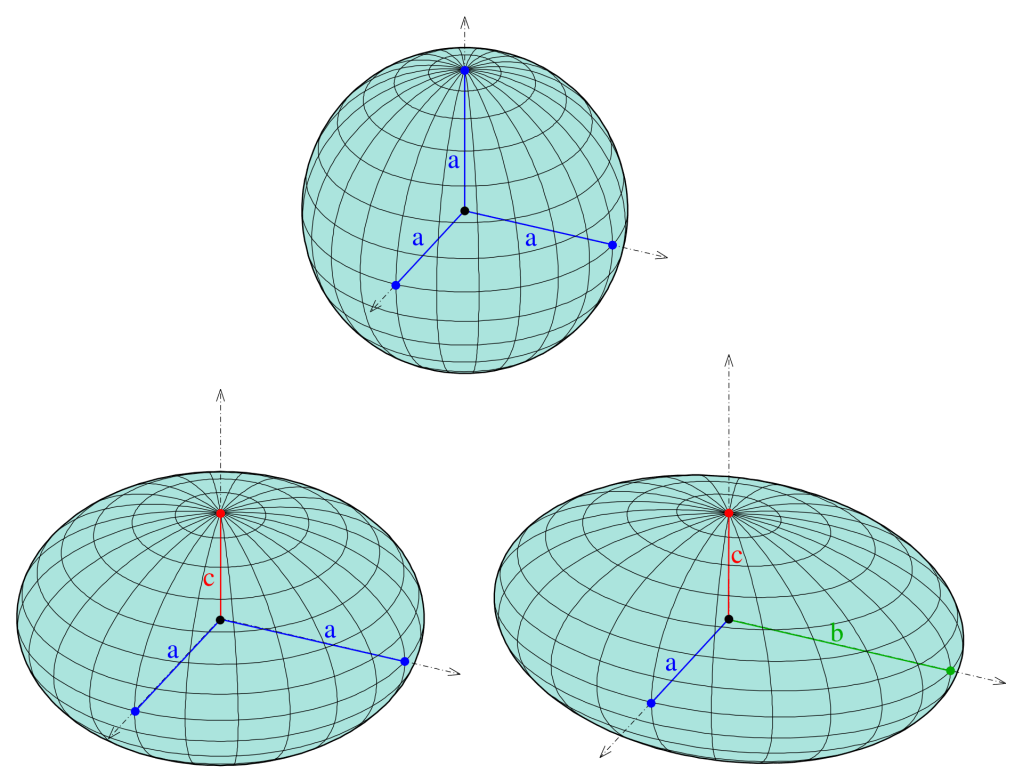
Rotation adds a strong and often counter-intuitive element because unlike a force that accelerates a car in the same direction that the force is applied, a force applied to a rotating system generates a torque perpendicular to both the force and the direction to the rotational axis. This can be confusing and one has to either watch the movies or go through advanced vector calculus. Furthermore, a rotating sphere acts differently than a rotating spheroid which acts differently from a rotating triaxial spheriod. Our peanut earth is the latter and thus has at least three axes of orientation (a and b and c) that all have different kinetic energy and angular momentum states. This makes for wobbly rotations which are sensitive to changes in both force balances and the distribution of masses like ice and water that can move to different locations at different times and stay there for a while.

For a perfect sphere three perpendicular lines from the center to the surface all have the same distance a (top) while for a spheriod only two of the three perpendicular lines have the same distance from the center (bottom right). If all three perpendiculars are different then we have something called a triaxial spheroid [Adapted from WikiPedia].

And how does this relate to climate science and my beloved glaciers in Greenland? Well, there is the “global wobbling” that caused ice ages and warm periods as the earth’s principal axis or rotation changes or wobbles. The “global wobble” was discussed in hilarious way a few years ago by the United States House of Representative’s “Committee on Science, Space, and Technology.” Closing this essay, I let Jon Steward of the Comedy Channel speak and hope you find his commentary and live experiment as funny as I do:

How to Power Modern Economies: Read Your Meter

Read you meter at home. This fun-filled advice was given by Sir David MacKay in a wonderful TEDx talk about how we heat our homes, get to work, run our computers, and how it all scales across countries and continents. The idea is really about how we run our lives while also trying to pass on a livable planet to our grand-children without the politically correct “greenwash” and self-righteous “claptraps”. Read your meter, do some algebra, and embrace the adventure to explore your home, your life, and the energy it all takes. If you read this far, watch the movie

David MacKay taught physics and information theory at the University of Cambridge in England. I learnt of him via Ruth Mottram in one of her many tweets. Dr. Mottram studies climate impacts of Greenland glaciers and works at the Danish Meteorological Institute. The tweet made me buy the book “Information Theory, Inference, and Learning Algorithm’s” that David MacKay wrote a few years back. It arrived today.

What piqued my interest was the advanced math that goes into designing networks that send and transform information such telephone calls via wireless, computer networks, and how to deal with imperfect channels of communication. My marriage comes to mind, too, because what I say is not always what I mean which is not always what my wife hears and vice versa, but I digress. Imperfect communication channels are one challenge we will face in an experiment to explore acoustic underwater data transmissions that hopefully will take place next year out of Thule Air Force Base, Greenland. Water and ice are imperfect communication channels that we need to use wisely to make our whispers carry far. Try to talk to a person across a busy street in Manhattan with all its hustle and bustle; you need to find something smarter and more effective than just simple shouting.

David MacKay wrote a second book that is close to his TEDx talk and is called “Sustainable Energy without the Hot Air.” Experimenting at home like any good physicist does, he discovers that “… the more often I read my meter, the less gas I use!”

There is so much more to this man, his work, and ideas as a physicist with a keen interest in the big picture without skipping the details. Sadly, he died yesterday of cancer too early only 48 years of age.

Preparing for Petermann One Day At a Time

Glaciers, Greenland, Adventure, Expedition, Ice, Polar Bears, Narwhales, oh the fun to go to Greenland.

Swedish icebreaker I/B Oden 22 July 2015 on its way to Thule. [Photo Credit: https://twitter.com/SjoV_isbrytning]

Swedish icebreaker I/B Oden 22 July 2015 on its way to Thule. [Photo Credit: https://twitter.com/SjoV_isbrytning%5D


This romantic notion is false and pretty pictures always lie. To prove my point, I just list what one scientist does 4 days before shipping out to Greenland for 5 weeks. [My wife left last week to visit our grown son in California. She knows the drill, focus, and strain that does not make good company. We have gone through such 4-8 weeks of separation many times during our 20+ years of marriage; her leaving a week before I do works rather well for us]:

04:45 Wake up
05:00 Check e-mail on iPhone in bed
05:05 Read Twitter feed: Canadian research ship diverted to break ice in Hudson Bay
05:10 Check references to outreach-related news
05:15 Read Wilson Quarterly article “The Race to the Arctic” on Arctic developments with global policy impacts
05:30 Shower and Dress
05:45 Check Iridium data collection to Oden, fix minor problem
06:00 Check Hans Island weather, winds still from the north at 10 kts
06:15 Clean up mess cat made, make coffee
06:30 Check latest satellite imagery on Nares Strait, beautiful Arctic lead (upwelling) and sediment plumes from streams and glaciers
07:00 Bicycling to work
07:15 Brief hallway meeting with new grant specialist
07:30 Checking news on Arctic Sea Ice Forums
07:35 Downloading and reading peer-reviewed papers for proposal writing
08:00 Distracted by Tamino’s post about Five signs of denial regarding climate change
08:00 NSF Proposal writing
08:30 Distracted, responding to international e-mails
09:00 Passing links and photos for future press release

My littered office with 2 (of 10) drums of cable to connect ocean sensors through 300 m thick ice to Iridium satellite phone at the surface.

My littered office with 2 (of 10) drums of cable to connect ocean sensors through 300 m thick ice to Iridium satellite phone at the surface.

I am falling behind and feel the tension to get this NSF proposal finished by saturday. NSF stands for National Science Foundation, the proposal is asking for $500,000 to conduct a 3-year experiment with German and Norwegian scientists in the summers of 2016 and 2017. If successful, it will support two graduate students full time for two (MS) and three (PhD) years as well as two technicians for five months total. Peer-review of these proposals is brutal with perhaps a 1:7 success rate on average.

09:15 NSF proposal writing
09:40 Respond to former collaborator on an underwater acoustic communication project
09:45 Back to NSF proposal writing
10:00 Studying Sutherland and Cenedese (2009) on dynamics of the East Greenland Current interacting with canyons as explored by laboratory study
10:30 Converting Latex files to .pdf for uploads to NSF server
11:00 Read and edit UDel Press Release
11:15 Giving university administrators full access to current version of NSF proposal after uploading files to NSF servers
11:20 Heading to coffee shop for short bicycle break
12:00 UNAVCO gear arrived at office
12:05 Re-design the mechanics of the surface mount of the automated weather station to be deployed on Petermann Glacier

UNAVCO GPS systems for deployment on Petermann Gletscher.

12:45 Checking ice and weather in Nares Strait, Arctic Forecast
13:00 Back to proposal, writing/thinking about buoyant coastal currents interacting with canyons
16:00 Meet with PhD student on physics of GPS
16:15 Back to proposal writing
17:30 Graphical layout of proposal
18:15 Bicycle to Main Street for steak + margarita dinner
19:30 Home; set-up overdue MODIS processing
19:45 Edit this list, add links, and photos
19:55 Check Nares Strait weather and DMI Greenland ice
20:15 Daily Iridium data download from Oden works (equipment testing)


20:30 Posting this post
20:45 Editing and updating this post
21:00 Finished processing and posting on my web serverNares Strait MODIS imagery for the week

Lab Notes of a Physical Oceanographer

I go to sea to learn about oceans, glaciers, weather, and climate. Despite dramatic photos of exciting field work, those action-packed scenes or serene nature shots of beauty and violence are misleading. Most of my time is spent sitting an a desk in a spacious office with books, papers, telephone, and most important of all, my computers.

Most of my time is spent writing. The writing is varied and ranges from illustrated essays on IcySeas.org to computer code. Add technical writing of research proposals, papers, and reviews for funding agencies and scientific journals. My screen rarely looks like what is shown above with the beautiful LandSat image of 79N Glacier as a screen-saver, it actually looks like this

Picture 2

The blog-writing window is open on the right while a Fortran computer code is in the top left. The code processes temperature, salinity, and pressure data from Petermann Glacier. When the code is run in the bottom-left window, it produces numbers. In this specific case, the numbers are from the only profile of temperature and salinity that exists from Petermann Glacier. Koni Steffen collected the data in 2002. Columns are depths that start at -68 (meters), salinity at 33.774 (no units, think of this as grams per kilogram), temperature at -1.885 (degrees centigrade), and the last column is the density anomaly These numbers are better presented as a graph:

Koni2002raw

Notice that temperature and salinity start only at -68 meters. This is because the ice at this location was about 68-m thick. The Big Ben clock in London is about 96-m high, but this piece if Petermann was chosen because it was less hard to drill through 2/3 of Big Ben’s height when compared to drilling through the glacier ice a mile away where the ice is thicker than the Empire State Building in New York; but I digress.

The profile above reveals a pattern we find almost anywhere in deeper Arctic Waters: Temperature increases with depth. Under the ice at 68-m depth, water is at its freezing point. As you move down the water towards the bottom, salinity increases and so does temperature. It is still cold, about +0.2 degrees Celsius, but this is heat from the North Atlantic Ocean that for perhaps 20-50 years circled all the way around the Arctic Ocean from northern Norway, past Siberia, past Alaska, past Canada to reach this spot of Greenland. While this appears marvelous, and it is, this is NOT what gets a physical oceanographer excited, but this does:

Koni2002Gade

It is the same data, but I did some reading, physics, algebra and code-writing in that order. First, instead of temperature, the blue line shows the difference between temperature T and the temperature Tf above the freezing. The difference T-Tf relates to the amount of heat available to melt the ice somewhere. The black line is the real killer, though. It combines salinity and temperature observations to reveal where the glacier water resides at this location that was melted somewhere else. Without going into the physical details, glacier meltwater is present where the black line touches zero (the so-called Gade-line, so named after a Swedish oceanographer who proposed its use in 1979). This happens at a depth from about 280-m to 500-m depth. This means that the glacier is NOT melting where it is as thin as Big Ben, but instead where it is as thick as the Empire State Building. So this is where we will need to place our instruments.

Proving my initial point, I spent two hours of fun writing this blog. I now will have to focus on more technical writing to pay the many bills of sea-going research. These “lab-notes” also serve as a document to raise $10,845 to install instruments this summer through Petermann Gletscher, have a look and give a little, if you can at

https://experiment.com/projects/ocean-warming-under-a-greenland-glacier

First sensors for future Petermann Gletscher Observatory, Greenland

Two ocean sensors arrived from Germany where I used them last in an experiment off the coast of Greenland last year. I bought them in 2002 and they have been in Arctic waters most of the time where they measure ocean temperature and conductivity very accurately a few times every second. Conductivity of seawater is what oceanographers measure when they want to talk about salinity and Arctic oceanographers must know salinity if they want to talk about ocean density. Water from cold melting ice and glaciers is less dense (because it is fresh) than the warm and salty water from the Atlantic Ocean that does the melting. You need heat to melt ice, but the heat that melts Greenland from below by the ocean comes from the Atlantic. The heat is at depth 200-400 meters deep, because of salt in the water that makes it dense and sink.

Oceanography and physics are fun, but here are the photos of what I work with over the weekend at home … maybe in my garden, too, to practice for the Arctic deployment, you may even watch me do it on the web-cam in my garden pointing towards the heated bird-bath. Geeks at play, science is fun:

Two SBE37sm with one set of 12 lithium batteries.

Two SBE37sm with one set of 12 lithium batteries.

The housing of these two instruments are rated for 7,000-m depth, I will have to install the lithium batteries ($4.80 for a single AA battery); each instrument needs 12 of those. Since 2003 we deployed a number of these in the Arctic where they collected data for over 3 years every 15 minutes. One of my students, Berit Rabe now works in Scotland and her dissertation and peer-reviewed publication was based on data from a single 2003-06 deployment of about 20 such instruments.

SBE37sm connect via RS-232 cable to the serial port of an old Dell computer.

SBE37sm connect via RS-232 cable to the serial port of an old Dell computer.

The instruments connect via a serial cable to the computers. In the past I had problems with instruments bought 12 years ago, because computers develop faster than oceanographic instrumentation. So, new is not always better, so I bought an old Dell Windows XP machine on e-Bay for $200 (actually I bought 2) to make sure that my sensors match software, CPU, and operating systems of the time that the instruments were bought. In order to “talk” to the sensors, I will need to put the lithium batteries into them. I am very much looking forward to do this over the weekend.

To be continued …

Note: This is a lab-note from my crowd-funding experiment at https://experiment.com/projects/ocean-warming-under-a-greenland-glacier.