Category Archives: Petermann Glacier

How oceans interact with Greenland’s last floating glaciers

Testifying before the US Congress back in 2010, I refused to endorse the view that a first large calving at Petermann Gletscher in North Greenland was caused by global warming. When a second Manhattan-sized iceberg broke off in 2012, I was not so sure anymore and looked closely at all available data. There was not much, but what little I found suggested that ocean temperatures were steadily increasing. Could it be that warm waters 1000 feet below the surface could melt the glacier at all times of the year? Did this melting from below thin the glacier? Did these changes increase the speed at which it moves ice from land into the ocean? These were the questions that motivated a number of projects that began in earnest in 2015 aboard the Swedish icebreaker I/B Oden. Professional videos of this expeditions are at https://icyseas.org/2019/07/04/petermann-glacier-videos-science/

Scientists and technicians from the British Antarctic Survey drilled three holes through the floating section of Petermann Gletscher to access the ocean and ocean sediments below it. The ocean temperature and salinity profile confirmed both the warming trend observed in the fjord and ocean adjacent to the glacier, but more importantly, we placed ocean sensors below the glacier ice to measure temperature and salinity every hour for as long as the sensors, cables, and satellite data transmission would work. This has never been done around Greenland, so our data would be the first to report in real time on ocean properties below 100 to 300 m thick glacier ice at all times. What we saw when the data started to come in after 2 weeks, a month, and half a year stunned us, because (a) the ocean waters under the glacier changed by a very large amount every two weeks. Nobody has ever seen such regular and large changes in tempertures (and salinity) under a glacier bathed in total darkness at air temperatures of -40 degrees Celsius and Fahrenheit, but then our station went offline after 6 months and did not report any data to us via satellite.
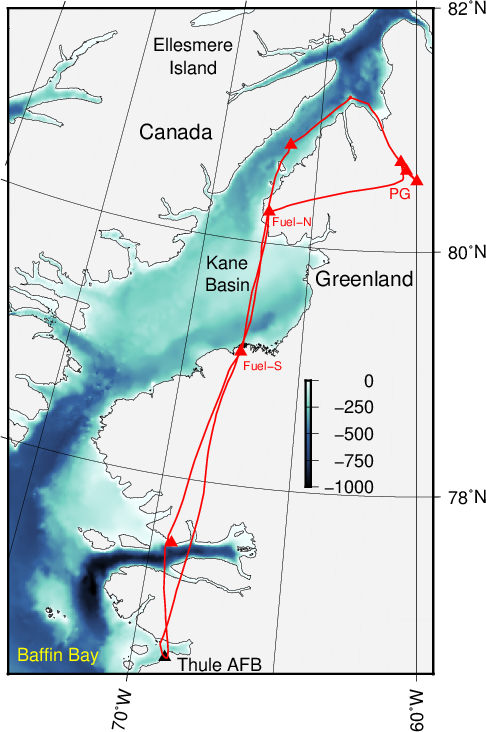
Helicopter flight path on 27/28 August 2016 to reach Petermann Gletscher (PG) via southern (Fuel-S) and northern (Fuel-N) fuel stops in northern Inglefield and southern Washington Land, respectively. Background color is ocean bottom depth in meters.

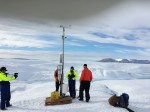
Refurbished Petermann Glacier Ocean Weather station on 28. August 2016 with Greenland Air helicopter and British Antarctic radar station in the background.

The first work on the grant was to visit our station by helicopter in 2016 using two fuel caches that we placed the year prior from the Swedish icebreaker. At this point Petermann Gletscher and our projects attracted the attention of journalists of the Washington Post who had read some of the blog articles at this site. The two journalists accompanied us for a week and produced a beautiful visual report of our work that is posted at

https://www.washingtonpost.com/sf/business/2016/12/30/with-enough-evidence-even-skepticism-will-thaw/

A detailed news report on our science and new findings appeared on page-1 of the Washington Post on January 1, 2017 [Broader Impacts]. I briefly summarize the results and findings of our subsequent data analyses of all data from August of 2015 through October of 2017 [Intellectual Merit]:

1a. Ocean temperatures increase at all five depths below the 100-m thick floating ice shelf of the glacier. These warmer waters are also saltier which demonstrates their Atlantic origin.

1b. Surface sensors indicate short, but intense pulses of meltwater passing our ocean array at spring-neap tidal cycles.

2a. Melt rate data reveal that these pulses occur during reduced tidal amplitudes and follow peaks in glacier melting that exceeded 30 feet per year.

2b. Statistical analyses indicate that the melt waters originate from a location near where the glacier sits on bed rock and that the melt water then moves seaward towards the ocean.

3a. Ocean melting below the glacier varies from summer (strong) to winter (weak) rising from a winter mean of 6 feet per year to a maximum of 240 feet per year during the summer.

3b. The large summer melting is caused by the increased discharge of subglacial runoff into the ocean near the grounding line.

3c. The larger discharge strengthens ocean currents under the floating glacier that drive ocean heat toward the glacier’s ice base.

The work formed one basis for the dissertation of PhD student Peter Washam who published the items #2 and #3 in the Journal of Physical Oceanography and Journal of Glaciology, respectively. He helped to drill holes and install sensors for the project that we first described at #1 in Oceanography. These three peer-reviewed journal articles are all published by not-for-profit professional organizations and societies dedicated to higher learning and public outreach. Furthermore we placed three separate data sets (1 | 2 | 3) at the Arctic Data Center that is funded by the National Science Foundation. More will come as we continue to work on the hard-won data from below Petermann Gletscher.

Look down the 0.3 meter wide drill hole. Yellow kevlar rope supports cable and ocean sensors.

Post Scriptum:
A modified version of the above was submitted the US National Science Foundation as part of the final reporting on grant 1604076 (“Glacier-Ocean interactions at a Greenland ice shelf at tidal to interannual time scales”) that funded this work with $360,400 at the University of Delaware from August 2016 through July 2019.

Petermann Glacier & Videos & Science

I just re-discovered four stunning science videos from the last expedition to reach Petermann Gletscher in Greenland. Each video is 3-6 minutes long and was made professionally by Saskia Madlener of 77th Parallel Productions with partial support from the US National Science Foundation. They were first posted at

https://petermannsglacialhistory.wordpress.com/videos/

and relate to a joint 2015 US-Swedish Expedition. The project involved diverse groups of geological, physical, biological, and chemical scientists from Sweden, England, Scotland, Denmark, Germany, Canada, and the USA who all worked together aboard the Swedish icebreaker Oden for 6 weeks. [For full resolution HD video click on the Vimeo icon in the video.]

Petermann Glacier 2015 – Overview from 77th Parallel on Vimeo.

Petermann Glacier 2015 – Ocean & Ice from 77th Parallel on Vimeo.

Petermann Glacier 2015 – Rocks & Shells from 77th Parallel on Vimeo.

Petermann Glacier 2015 – Expedition from 77th Parallel on Vimeo.

What’s happened at Petermann Gletscher since the Industrial Revolution 150 years ago?

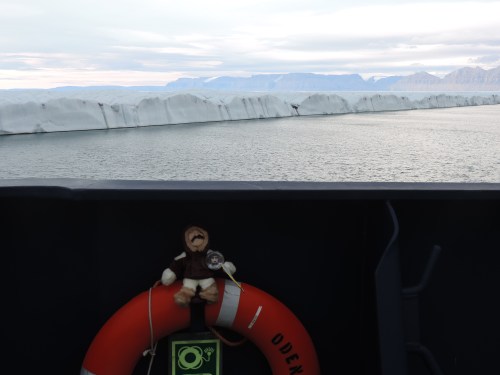
More than 15 years ago I first set sight on the floating Petermann Gletscher when the United States’ Coast Guard Cutter Healy visited north-west Greenland for the first time on 10th August of 2003. We only had to sail 20 km into the fjord to reach a flat expanse of glacier ice that stuck less than 5 m (15 feet) above the sea. In 2012 and 2015 we had to sail another 20 km, because two large calving events had shortened the glacier farther back than it has since first records were kept in 1876. The terminus was also much higher, almost 25 m (75 feet) above the sea:

DSCN4444

Terminus of Petermann Gletscher 5th August 2015 from aboard the Swedish icebreaker Oden. View is to the south-east. [Photo Credit: Andreas Muenchow]

I published more detailed results on observed glacier change and estimated melt rates with Drs. Laurie Padman and Helen Fricker in the Journal of Glaciology from which I take these two figures:

Muenchow2014_01

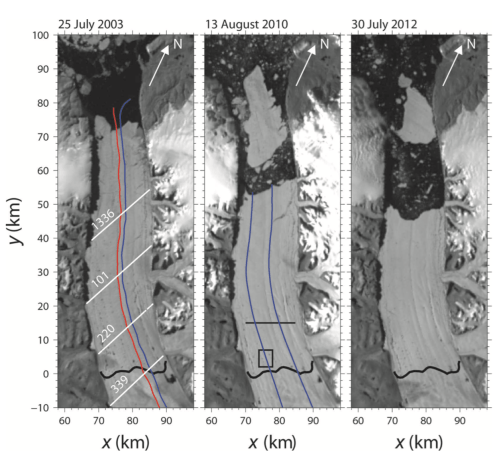
Petermann Gletscher’s two large calving events in 2010 and 2012 as seen from MODIS satellite. The glacier is floating on the ocean seaward of the grounding line indicated by the thick black line. Black areas are open ocean water, white is ice. Adapted from Muenchow et al., 2014.

Muenchow2014_02

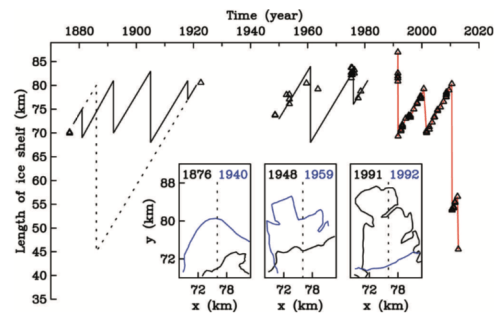
Time series from 1876 to 2014 of the length of Petermann Gletscher as measured from its grounding line at y=0 km. Triangles are observations while lines indicate a steady 1 km per year advance. The insert shows three maps of observed glacier shapes. From Muenchow et al., 2014.

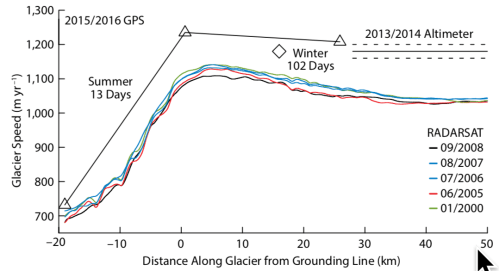
Back in 2003 the glacier advanced about 1 km each year and it does so still. Almost the same, but not exactly, because the removal of 6 “Manhattans” in 2010 and 2012 increased the forward speed some, that is, the glacier now moves faster forward than it did before. Many sensors placed on the glacier measured this speeding, but the glacier also gets thinner as it speeds up. It is stretched thin. I published this back in 2016 together with Drs. Laurie Padman, Keith Nicholls, and my PhD student Peter Washam in Oceanography:

Muenchow2016_03

Speed at which Petermann Gletscher moves out into the sea from many different measurements. The glacier moves more slowly over land (negative distances) than it does floating over the ocean (positive distances). Estimates made after 2012 are about 10-20 % higher than RADARSAT estimates before that date. From Muenchow et al., 2016.

With substantial help from the British Antarctic Survey we installed in 2015 a small ocean observing system under the floating glacier. It transmitted data from 800 meters (2400 feet) below the 100 m (300 feet) thick glacier ice via cables connected to a weather station. We sucessfully repaired the station (as well as a Danish weather station nearby) that stopped transmitting data via satellites in 2016. Two journalists of the Washington Post, Chris Mooney and Whitney Shefte joined Keith Nicholls and myself. Their outstanding and accurate reporting of our work includes video and graphics for a wider audience that you can find at this link:

Washington Post Video of 2016 Petermann Gletscher Site Visit

The ocean and glacier data were worked over carefully by Peter Washam who defended his dissertation last month. Dr. Washam moved to Georgia Tech in Atlanta to work with Dr. Britney Schmidt whose interests relate to the ice-covered oceans below some moons of Jupiter. Peter connected ocean temperature and salinity with ice radar and remote sensing data to estimate how much the glacier is melted by the ocean and how the ocean does this. His main result will be published later this year in the Journal of Glaciology [Added July-12, 2019: Published online as Washam et al., 2019 at the Journal of Glaciology.], that is

“… This increase in basal melt rates confirms the direct link between summer atmospheric warming around Greenland and enhanced ocean-forced melting of its remaining ice shelves. We attribute this enhanced melting to increased discharge of subglacial runoff into the ocean at the grounding line, which strengthens under-ice currents and drives a greater ocean heat flux toward the ice base…”

The next large calving will be no surprise: Large fractures cross much of the glacier. They are visible about 10-20 km behind the current terminus and are discussed and closely monitored almost every day at the excellent site of Greenland Enthusiasts from all walks of life who post at

https://forum.arctic-sea-ice.net/index.php/topic,53.600.html

Furthermore, a new sophisticated computer model of Petermann Gletscher reveals that the loss of this large “still attached” ice island is already gone from the glacier in terms of the friction that it provides along the sidewalls. Another way of putting this, all it takes is a little wiggle or bump and the separation will become visible. Dr. Martin Rueckamp just published this study in the Journal of Geophysical Research.

There is much more to be explored with regard to Petermann. Here are some of the readings and writings that I have done with many fellow sailors through uncertain climates:

Johnson, H.L., A. Muenchow, K.K. Falkner, and H. Melling: Ocean circulation and properties in Petermann Fjord, Greenland. Journal of Geophysical Research, 116, doi:10.1029/2010JC006519, 2011. .pdf

Muenchow, A., L. Padman, and H.A. Fricker: Interannual changes of the floating ice shelf of Petermann Gletscher, North Greenland, from 2000 to 2012 Journal of Glaciology, 60, doi:10.3189/2014JoG13J135, 2014. .pdf

Muenchow, A., L. Padman, P. Washam, and K.W. Nicholls, 2016: The ice shelf of Petermann Gletscher, North Greenland and its connection to the Arctic and Atlantic Oceans, Oceanography, 29, 84-95, 2016. .pdf

Rueckamp, M, N. Neckel, S. Berger, A. Humbert, and V. Helm: Calving induced speed-up of Petermann Glacier, Journal of Geophysical Research, 124, 216-228, 2019. .pdf

Shroyer, E., L. Padman, R. Samelson, A. Muenchow, and L. Stearns: Seasonal control of Petermann Gletscher ice-shelf melt by the ocean’s response to sea-ice cover in Nares Strait, Journal of Glaciology, 63, doi:10.1017/jog.2016.140, 2017. .pdf

Washam, P., A. Muenchow, and K.W. Nicholls: A decade of ocean changes impacting the ice shelf of Petermann Gletscher, Greenland, Journal of Physical Oceanography, 48, 2477-2493, 2018. source

Washam, P., K.W. Nicholls, A. Muenchow, and L. Padman: Summer surface melt thins Petermann Gletscher ice shelf by enhancing channelized basal melt, Journal of Glaciology, 65, doi:10.1017/jog.2019.43, 2019. .pdf

Two Years Ocean Observing Below Petermann Glacier Greenland

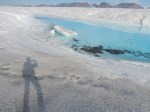
A year ago today I last set foot on Petermann’s floating ice shelf. The 28th of August 2016 was a drizzly, cloudy day with water running over the surface of the glacier in small streams emptying into larger streams to form small rivers that merged into larger channels carved into the ice. Two years ago Keith Nichols and I set-up a weather station atop the glacier. Many friends helped. We connected copper wires, ocean sensors, and a surface station to collect data from sensors 100-m below the ice in 800-m deep water. The small 2015 project of opportunity keeps giving us hourly ocean data. I am still stunned by our luck and technology.

My Petermann story started in 2010 when a first Manhattan-sized ice cube broke off the glacier. Two days after a University of Delaware press release, the US Congress asked me to appear before one of its inquiring committees. I humbly acknowledged how little I knew then, but everyone else knew even less. In 2012 another Manhattan-sized glacier piece broke off. While satellite a image shows what happens, only hard ocean data and modeling explains why it happens. Two research proposals were rejected, sadly, to probe ocean physics with carefully designed experiments, but in 2016 Alan Mix invited me to an expedition to Petermann aboard the Swedish icebreaker Oden. I gladly accepted, but I wanted to contribute something. That “something” became the Petermann Glacier Ocean Weather Observatory.

Alan needed holes drilled through the 100-m to 400-m thick glacier. Actually, he needed mud from 800 meters below the glacier. Keith Nichols of the British Antarctic Survey drilled those holes for Alan and collected the mud. My plan was to recycle the hole, that is, we dropped kevlar line, copper wire, and ocean sensors into the ocean and connected all to a weather station. David Huntley and I designed the system that included an Iridium satellite phone. Iridium phone calls ceased in February 2016, but a “service call,” that is, a helicopter site visit fixed the station. Chris Mooney and Whitney Shefte told the story for the Washington Post on 30 December 2016.

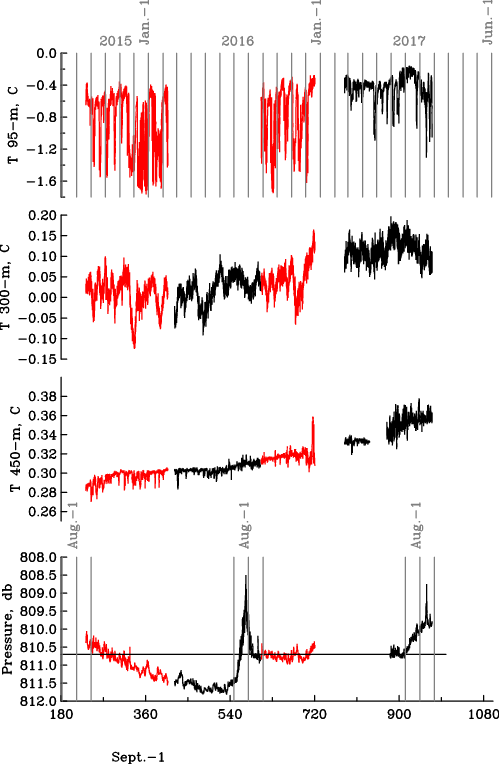
Ocean temperature at 95-m, 300-m, and 450-m below the sea surface as well as pressure at the bottom sensor near 810-m depth (~810 dbar pressure) updated through 27 August 2017.

The graph shows the entire 2-year long data record. Each gray vertical bar indicates a month between July 2015 and December 2017. The top record shows ocean temperatures just below the floating glacier ice. It was a surprise to see the data change from -0.3 Celsius to -1.6 degrees Celsius. The latter is close to the freezing point of salt water. Hence I interpret low-temperature events as meltwater pulse that swoosh past our sensor.

At 300-m we find a smaller range of temperatures near +0.1 degrees Celsius. Note the steady increase of temperature. Fluctuations are similar, but their absolute values increase with time. The linear warming trend becomes clear at 450-m depth, because the fluctuations diminish, but the warming does not. Temperatures at all depths increased over the entire two years of hourly observations.

The pressure record of the bottom-most sensor on the kevlar line perplexes me: During the first year the sensor slides into deeper water, because the kevlar stretches as all lines do when weighted down. In July 2016 the sensor sharply rises by almost 3 meters from 810.5 to 808.5 dbar to just as rapidly drop again to the 810.5 dbar value. The same feature occurs in the summer of 2017 also. It relates to the summer melt season, but how? I do not know.

The 2-year record is not perfect as the many gaps indicate. These result from electronic and mechanical failures that, I feel, are caused by long and harsh winters when temperatures dropped below -40 degrees Celsius or Fahrenheit. These cold temperatures challenge the best batteries during the 4-5 months of total darkness. On 20. December 2016 our batteries ran out and shut down the station. The sun revived our data gathering when the solar panels recharged batteries in March 2017.

The glacier also melts about 1-2 meters at the surface each summer. This surface melt tilted and almost crashed the station that we repaired last year today. In 2015 we had 2-m of pipe to fix into the glacier ice. In 2016 we replaced this with a 4-m pole that should survive two year’s of surface melt, I hope.

There are many, many people who all contributed in ways both small and large. It takes a village to raise a station on Greenland:

Is Petermann Gletscher Breaking Apart this Summer?

I am disturbed by new ocean data from Greenland every morning before breakfast these days. In 2015 we built a station that probes the ocean below Petermann Gletscher every hour. Data travels from the deep ocean via copper cables to the glacier surface, passes through a weather station, jumps the first satellite overhead, hops from satellite to satellite, falls back to earth hitting an antenna in my garden, and fills an old computer.

A 7-minute Washington Post video describes a helicopter repair mission of the Petermann data machine. The Post also reported first result that deep ocean waters under the glacier are heating up.

Sketch of Petermann Gletscher’s ice shelf with ocean sensor stations. The central station supports five cabled sensors that are reporting hourly ocean temperatures once every day. Graphics made by Dani Johnson and Laris Karklis for the Washington Post.

After two years I am stunned that the fancy technology still works, but the new data I received the last 3 weeks does worry me. The graph below compares ocean temperatures from May-24 through June-16 in 2017 (red) and 2016 (black). Ignore the salinity measurements in the top panel, they just tell me that the sensors are working extremely well:

Ocean temperature (bottom) and salinity (top) at 450-m depth below Petermann Gletscher from May-25 through June-16 2017 (red) and 2016 (black). Notice the much larger day-to-day temperature ups and downs in 2017 as compared to 2016. This “change of character” worries me more than anything else at Petermann right now.

The red temperature line in the bottom panel is always above the black line. The 2017 temperatures indicate waters that are warmer in 2017 than in 2016. We observed such warming for the last 15 years, but the year to year warming now exceeds the year to year warming that we observed 10 years ago. This worries me, but three features suggest a new ice island to form soon:

First, a new crack in the ice shelf developed near the center of the glacier the last 12 months. Dr. Stef Lhermitte of Delft University of Technology in the Netherlands discovered the new crack two months ago. The new rupture is small, but unusual for its location. Again, the Washington Post reported the new discovery:

New 2016/17 crack near the center of Petermann Gletscher’s ice shelf as reported by Washington Post on Apr.-14, 2017.

Second, most Petermann cracks develop from the sides at regular spaced intervals and emanate from a shear zone at the edge. Some cracks grow towards the center, but most do not. In both 2010 and 2012 Manhattan-sized ice islands formed when a lateral crack grew and reached the central channel. The LandSat image shows such a crack that keeps growing towards the center.

Segment of Petermann Gletscher from 31 May 2017 LandSat image. Terminus of glacier and sea ice are at top left.

And finally, let’s go back to the ocean temperature record that I show above. Notice the up and down of temperature that in 2017 exceeds the 2016 up and down range. Scientists call this property “variance” which measures how much temperature varies from day-to-day and from hour-to-hour. The average temperature may change in an “orderly” or “stable” or “predictable” ocean along a trend, but the variance stays the same. What I see in 2017 temperatures before breakfast each morning is different. The new state appears more “chaotic” and “unstable.” I do not know what will come next, but such disorderly behavior often happens, when something breaks.

I fear that Petermann is about to break apart … again.