A year ago today I last set foot on Petermann’s floating ice shelf. The 28th of August 2016 was a drizzly, cloudy day with water running over the surface of the glacier in small streams emptying into larger streams to form small rivers that merged into larger channels carved into the ice. Two years ago Keith Nichols and I set-up a weather station atop the glacier. Many friends helped. We connected copper wires, ocean sensors, and a surface station to collect data from sensors 100-m below the ice in 800-m deep water. The small 2015 project of opportunity keeps giving us hourly ocean data. I am still stunned by our luck and technology.
-
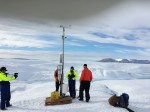
- Petermann Glacier Ocean Weather station on 27 August 2015 after it was established the week prior during the US-Sweden expedition to Petermann Fjord.
-
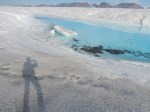
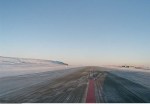
- Central channel at the end of the melt season in August 2015. Shadow of photographer for scale.
-
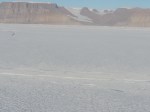
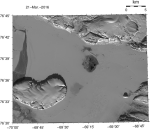
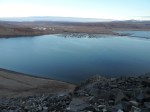
- View to the north-east across Petermann Gletscher from helicopter in August 2015. The growing crack is barely visible emanating from the shear zone near the 1000-m high cliff.
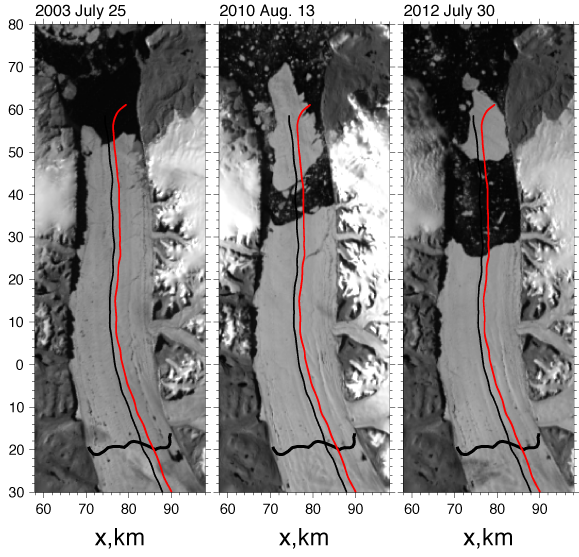
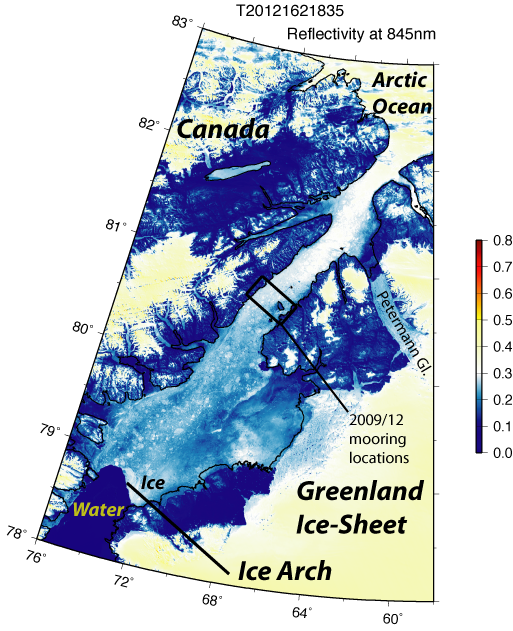
My Petermann story started in 2010 when a first Manhattan-sized ice cube broke off the glacier. Two days after a University of Delaware press release, the US Congress asked me to appear before one of its inquiring committees. I humbly acknowledged how little I knew then, but everyone else knew even less. In 2012 another Manhattan-sized glacier piece broke off. While satellite a image shows what happens, only hard ocean data and modeling explains why it happens. Two research proposals were rejected, sadly, to probe ocean physics with carefully designed experiments, but in 2016 Alan Mix invited me to an expedition to Petermann aboard the Swedish icebreaker Oden. I gladly accepted, but I wanted to contribute something. That “something” became the Petermann Glacier Ocean Weather Observatory.
-

- The Petermann data machine with batteries (yellow box), solar panels, electronics (white box), antenna, wind vane, and cables to ocean sensors on ground as last seen Aug.-2016.
-

- Keith Nichols among the rubble of science gear during our refurbishment of Petermann Glacier Ocean Weather and Radar stations on near midnight on 27/28 August 2016.
-

- Refurbished Petermann Glacier Ocean Weather station on 28. August 2016 with Greenland Air helicopter and British Antarctic radar station in the background.
Alan needed holes drilled through the 100-m to 400-m thick glacier. Actually, he needed mud from 800 meters below the glacier. Keith Nichols of the British Antarctic Survey drilled those holes for Alan and collected the mud. My plan was to recycle the hole, that is, we dropped kevlar line, copper wire, and ocean sensors into the ocean and connected all to a weather station. David Huntley and I designed the system that included an Iridium satellite phone. Iridium phone calls ceased in February 2016, but a “service call,” that is, a helicopter site visit fixed the station. Chris Mooney and Whitney Shefte told the story for the Washington Post on 30 December 2016.
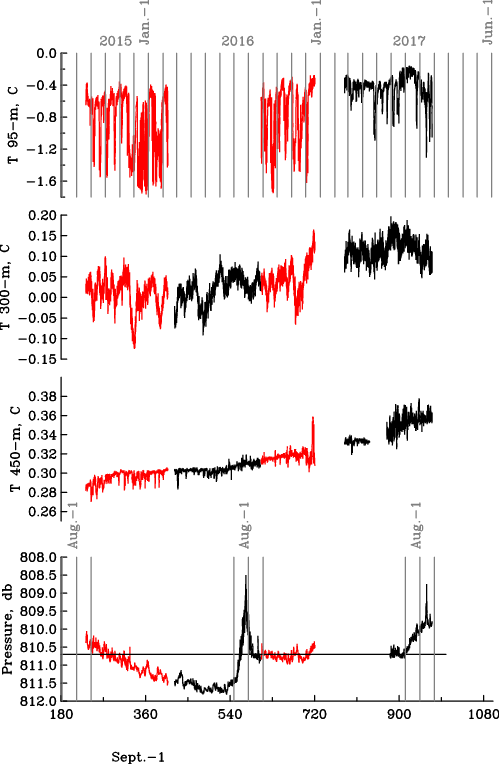
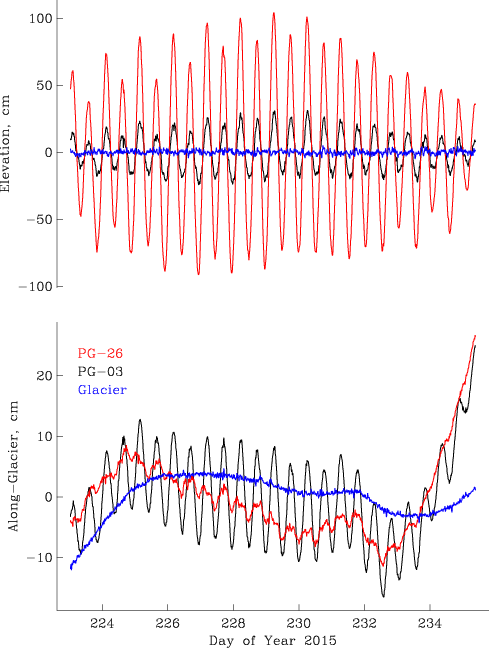
Ocean temperature at 95-m, 300-m, and 450-m below the sea surface as well as pressure at the bottom sensor near 810-m depth (~810 dbar pressure) updated through 27 August 2017.
The graph shows the entire 2-year long data record. Each gray vertical bar indicates a month between July 2015 and December 2017. The top record shows ocean temperatures just below the floating glacier ice. It was a surprise to see the data change from -0.3 Celsius to -1.6 degrees Celsius. The latter is close to the freezing point of salt water. Hence I interpret low-temperature events as meltwater pulse that swoosh past our sensor.
At 300-m we find a smaller range of temperatures near +0.1 degrees Celsius. Note the steady increase of temperature. Fluctuations are similar, but their absolute values increase with time. The linear warming trend becomes clear at 450-m depth, because the fluctuations diminish, but the warming does not. Temperatures at all depths increased over the entire two years of hourly observations.
The pressure record of the bottom-most sensor on the kevlar line perplexes me: During the first year the sensor slides into deeper water, because the kevlar stretches as all lines do when weighted down. In July 2016 the sensor sharply rises by almost 3 meters from 810.5 to 808.5 dbar to just as rapidly drop again to the 810.5 dbar value. The same feature occurs in the summer of 2017 also. It relates to the summer melt season, but how? I do not know.
The 2-year record is not perfect as the many gaps indicate. These result from electronic and mechanical failures that, I feel, are caused by long and harsh winters when temperatures dropped below -40 degrees Celsius or Fahrenheit. These cold temperatures challenge the best batteries during the 4-5 months of total darkness. On 20. December 2016 our batteries ran out and shut down the station. The sun revived our data gathering when the solar panels recharged batteries in March 2017.
The glacier also melts about 1-2 meters at the surface each summer. This surface melt tilted and almost crashed the station that we repaired last year today. In 2015 we had 2-m of pipe to fix into the glacier ice. In 2016 we replaced this with a 4-m pole that should survive two year’s of surface melt, I hope.
There are many, many people who all contributed in ways both small and large. It takes a village to raise a station on Greenland:
-

- Chief Scientist Alan Mix briefing the science party aboard I/B Oden in July 2015 during transit to Petermann Fjord.
-

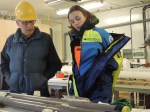
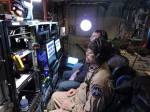
- PhD student Peter Washam programming ocean sensors at the University of Delaware in February 2015.
-

- David Huntley testing components at the University of Delaware in February 2015.
-
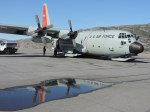
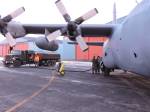
- United States Air Force C-130 flying us from Schenactady, New York to Thule, Greenland in July 2015.
-

- Keith Nichols (right) with helicopter pilot Johan Baalack on 10 Aug. 2015 after a test deployment of the weather station on Petermann Glacier.
-
- Alan Mix and Kelly Hogan with sediment cores recovered from ocean sediments below Petermann Glacier on 9. August 2015.


![An F-102 jet of the 332d Fighter-Interceptor Squadron at Thule AFB in 1960. [Credit: United States Air Force]](https://icyseas.org/wp-content/uploads/2013/06/332d_fighter-interceptor_squadron_-_f-102_-_thule_ab.jpg)
![Petermann Ice Island of 2012 at the entrance of Petermann Fjord. The view is to the north-west with Ellesmere Island, Canada in the background. [Photo Credit: Jonathan Poole, CCGS Henry Larsen]](https://icyseas.org/wp-content/uploads/2012/09/pg-iceisland-aug2012_0480.jpg)