Tag Archives: weather

Only in Thule Greenland

… do you find a machinist working metal to take photos while I do oceanography the old-fashioned way by pulling up 100 meters of kevlar line to recover an ocean probe.

Wolstenholme Fjord March-26, 2017. [Photo by Mogens Werth Christensen]

The data were subsequently used by ocean acousticians to test speed of sound propagation as part of an NSF project on testing an underwater communication system to move data from A to B via C or D. The automated weather station reports ocean temperature and saltiness as well at

http://ows.udel.edu/ice

Web-site is low-bandwidth to be used operationally by Air Force personnel in Greenland and local communities where internet access and speeds are severely limited.

Greenland Oceanography by Sled and Snowmobile

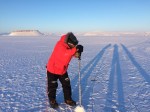
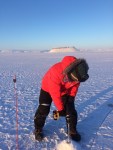
Wind chill matters in Greenland because one must see and breath. This implies exposed skin that will hurt and sting at first. Ignoring this sting for a few minutes, I notice that the pain goes away, because the flesh has frozen which kills nerves and skin tissue. The problem becomes worse as one drives by snowmobile to work on the sea ice which I do these days almost every day.

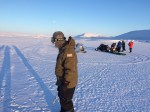
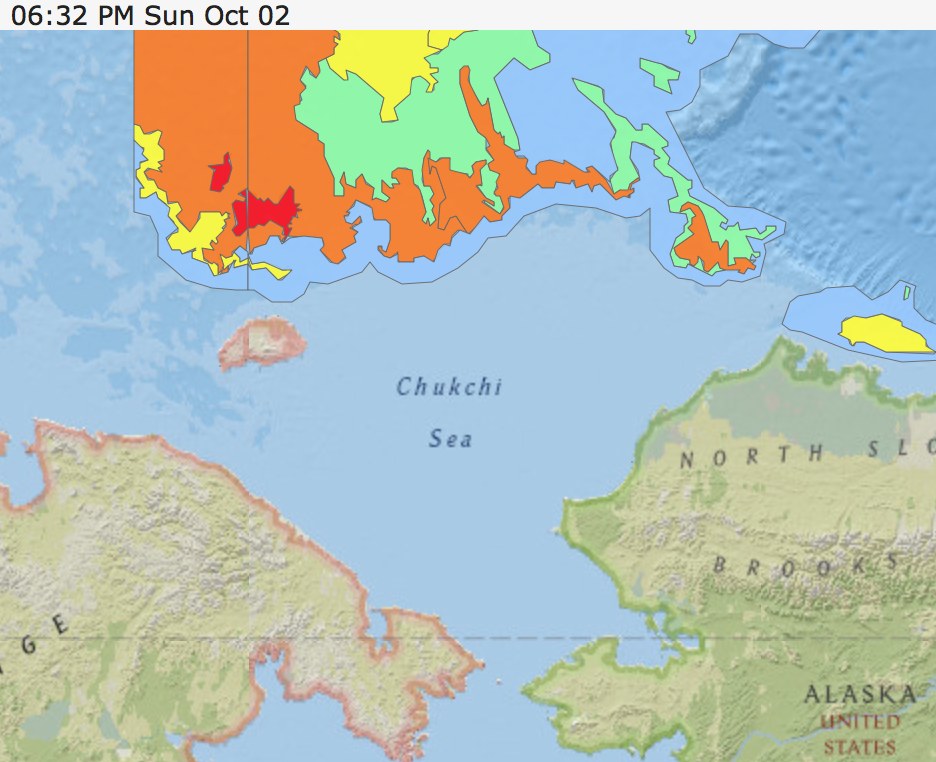
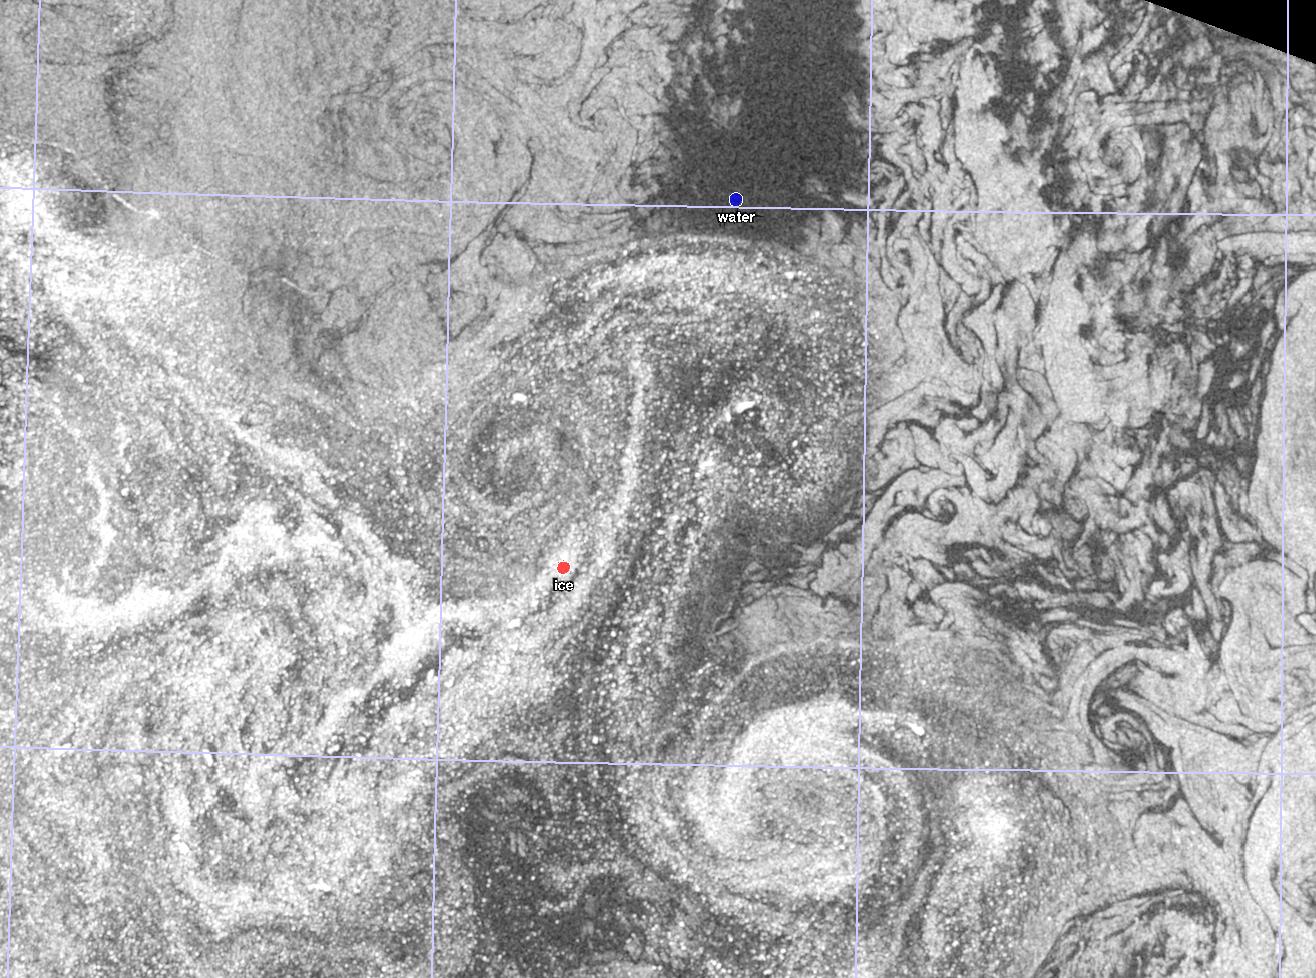
Navigating on the sea ice by identifying ice bergs with LandSat imagery. The imagery also shows polynyas and thin ice in the area. [Photo Credit: Sonny Jacobsen]

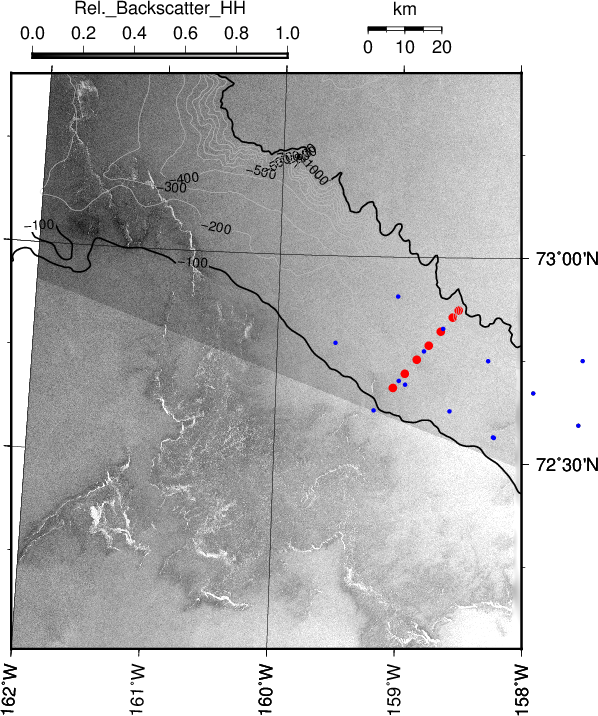
Mar.-22, 2017 LandSat image of study area with Thule Air Base near bottom right, Saunders Island in the center. Large red dots are stations A, B, and C with Camp-B containing weather station, shelter, and first ocean mooring. My PhD student Pat Ryan prepared this at the University of Delaware.

My companion on the ice is Sonny Jacobsen who knows and reads the land, ice, and everything living on and below it. He teaches me how to drive the snowmobile, how to watch for tracks in the snow, how to pack a sled, and demonstrates ingenuity to apply tools and materials on-hand to fix a problem good enough to get home and devise a new and better way to get a challenging task done. Here he is designing and rigging what is to become our “Research Sled” R/S Peter Freuchen, but I am a little ahead of my story:

Sonny Jacobsen on Mar.-27, 2017 on Thule Air Base building a self-contained sled for ocean profiling.

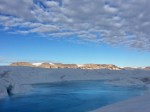
First we set up a shelter in the center of what will hopefully soon become an array of ocean sensors and acoustic modems to move data wirelessly through the water from point A in the north-west via point B to point C. Point C will become the pier at Thule Air Base while the tent is at B that I call Camp-B:

Ice Fishing shelter to the north-east of Saunders Island seen to the left in the background.

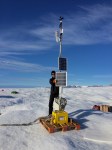
Next, we set up an automated weather station (AWS) next to this site, because winds and temperatures on land next to hills, glaciers, and ice sheets are not always the same 10 or 20 km offshore in the fjord. It is a risk-mitigating safety factor to know the weather in the study area BEFORE driving there for 30-60 minutes to spend the day out on the ice. It does not hurt, that this AWS is also collecting most useful scientific data, but again, I am slightly ahead of my story:

Weather station with shelter at Camp-B with the northern shores of Wolstenholme Fjord in the background. Iridium antenna appears just above the iceberg on the sidebar of the station. Winds are measured at 3.2 m above the ground.

With shelter and weather station established and working well, we decided to drill a 10” hole through 0.6 m thin ice to deploy a string of ocean instruments from just below the ice bottom to the sea floor 110 m below. Preparing for this all friday (Mar.-24), we deploy 22 sensors on a kevlar line of which 20 record internally and must be recovered while 2 connect via cables to the weather station to report ocean temperature and salinity along with winds and air temperatures. It feels a little like building with pieces of Lego as I did as a kid. Engineers and scientists, perhaps, are trained early in this sort of thing.

Weather station with ocean mooring (bottom right) attached with eastern Saunders Island in the background on Sunday Mar.-26, 2017.

Sadly, only the ocean sensor at the surface works while the one at the bottom does not talk to me. I can only suspect that I bend a pin on the connector trying to connect very stiff rubber sealing copper pins from the cable with terminations equally stiff in the cold, however, there are other ways to get at the bottom properties albeit with a lot more effort … which brings me to R/S Peter Freuchen shown here during its maiden voyage yesterday:

R/S Peter Freuchen in front of 10” hole (bottom right) for deployment of a profiling ocean sensor. The long pipes looking like an A-frame on a ship become a tripod centered over the hole with the electrical winch to drive rope and with sensors (not shown) over a block into the ocean. This was yesterday Mar.-28, 2017 on the way from Camp-B back to Thule Air Base.

The trial of this research sled was successful, however, as all good trials, it revealed several weaknesses and unanticipated problems that all have solutions that we will make today and tomorrow. The design has to be simple to be workable in -25 C with some wind and we will strip away layers of complexities that are “nice to have” but not essential such as a line counter and the speed at which the line goes into the water. There can not be too many cables or lines or attachments, because any exposure to the elements becomes hard labor. This becomes challenging with any gear leaving the ocean (rope, sensors) and splattering water on other components. Recall that ocean water is VERY hot at -1.7 C relative to -25 C air temperatures. This means that ANYTHING from the ocean will freezes instantly when in contact with air. Efficiency and economy matter … as does body heat to keep critical sensors and batteries warm.

A big Thank-You to Operation IceBridge’s John Woods for something related to this post that I wish not to advertise 😉

Travels to Greenland in Winter

Waking up after 5 hours on a plane from Baltimore, Maryland to Thule, Greenland large white Pitugfik Gletscher distinguishes itself from the white sea ice by its ragged snout as the plane approaches my new home for the next 6 weeks. I am traveling with 9 midshipmen of the US Naval Academy of which two are women, their 4 professors, and bear guard from Alaska. We will be working and living together for the next 7 days.

Pitugfik Glacier during the early morning hours of Mar.-9, 2017.

A little further along the coast we enter Wolstenholme Fjord where from the plane wide cracks of open water stand out as black against the bluish white horizon. This will be the outer margin of where I plan to work the ice and ocean underneath the next 6 weeks. We need to stay on the shore side of this transition of land-fast to mobile sea ice. I have watched this boundary for the last 4 months with satellite imagery, but seeing with my own eyes is an entire different and humbling experience.

Sea ice near Kap Atholl with heads of open water that separate land-fast ice that does not move from mobile ice.

We land safely at the airport, get our passport stamped by Danish officials, pick up our luggage, and are received by wonderful people working for both NASA and the National Science Foundation. After a hearty lunch of dark rye bread and my beloved pickled herrings christmas arrives in the form of many carefully wrapped packages: I try to find my Arctic clothing that I shipped months before. It is much-needed as the -33 C take your breadth away. I also find the 2,500 lbs of science gear, some of which had arrived directly from Canada after it was ordered Dec.-10, 2016: Without this $22,000 electrical winch, I would be hard pressed to send sensors to the bottom of the ocean and back. Everything appears to be in place and fine, but some acoustic gear is still missing as its large lithium batteries need diplomatic clearances which takes a little longer. Perhaps they will be on the plane that is about to land. There is only 1 flight per week that connects Thule to the US. Hence advance planing is needed and those lithium batteries are not needed until April 6 when Lee and Taylor arrive from Massachusetts.

Where in this pile are my snow boots? Palletized gear on arrival in Thule Greenland.

The next day we put some of our gear out to measure how thick the sea ice is near the coast. While drilling a hole requires power tools, the ice is actually cut by a razor-sharp drill bit that is sensitive to damage when it refuses to cut the ice and no amount of force available can force it through the 3-4 feet of ice we find. We all learn the hard way when we accidentally drill into the frozen sea bed without finding any water. One drill bit down, we only got 2 more and are much, much more careful with it. The remaining drill bits have to last for the next 6 weeks … actually, they do not, because I can change the blades should one bit become dull. [I did not tell this the Naval Academy guys who were doing much of this drilling to support NASA’s Operation IceBridge.]

And on this note, I am heading out to sea at 7:59 am to drill one more hole to prepare for a first mooring deployment. A wooden stick without sensors attached will simulate a mooring that I want to recover after it is frozen in. More later …

P.S.: More photos and stories on this week’s adventures can be found at

https://www.facebook.com/USNAPolarScienceProgram/

Sea Ice, Oceanography, and Nature’s Way to Paint

I am going to sea next week boarding the R/V Sikuliaq in Nome, Alaska to sail for 3 days north into the Arctic Ocean. When we arrive in our study area after all this traveling, then we have perhaps 18 days to deploy 20 ocean moorings. I worry that storms and ice will make our lives at sea miserable. So what does a good data scientist do to prepare him or herself? S/he dives into data:

Map northern Chukchi Sea with mooring locations (red and blue symbols), contours of bottom topography, and radar backscatter from space.

Map northern Chukchi Sea with mooring locations (red and blue symbols), contours of bottom topography, and radar backscatter from space. Slightly darker shades especially in the bottom segment are interpreted as sea ice. The offset in grey scale between top and bottom is caused by me using different numbers for two different data segments to bring the data into a range that varies between 0 and 1.

The image above is my first attempt to determine, if our planned mooring deployment locations are free of sea ice or not. The darker tones of gray are sea ice with the white spots probably thicker or piled-up ridges of rougher sea ice. The speckled gray surface to the north is probably caused by surface waves and other “noise” that are pretty random. There is a data point ever 40 meters in this image. It also helps to compare these very high-resolution ice data with products that the US National Ice Center (NIC) and the National Weather Service provide:

Ice Chart of the Alaska office of the National Weather Service (link)

Ice Chart of the Alaska office of the National Weather Service

The above is a wonderful map for general orientation, but it is not good or detailed enough to navigate a ship through the ice. The two maps agree, however, my patch of ice to the south of the moorings are represented as the orange/green patch on the top right (north-east). The orange means that 70-80% of the area is covered by ice and this ice is thicker than 1.2 meters and thus too thick for our ship to break through, but there are always pathways through ice and those can be found with the 40-m resolution maps.

In summary, on Sept.-29, 2016 all our moorings are in open water, but this can change, if the wind moves this math northward. So we are also watching the winds and here I like the analyses of Government Canada

Surface weather analysis from Government Canada for Oct.-2, 2016.

Surface weather analysis from Government Canada for Oct.-2, 2016. The map of surface pressure is centered on the north pole with Alaska at the bottom, Europe on the top, Greenland on the right, and Siberia on the left.

It shows a very low pressure center over Siberia to the south-west and a high pressure center over Arctic Canada to our north-east. This implies a strong wind to the north in our study area. So the ice edge will move north into our study area. If the High moves westward, we would be golden, but the general circulation at these latitudes are from west to east, that is, the Low over Siberia will win and move eastward strengthening the northward flow. That’s the bad news for us, but we still have almost 2 weeks before we should be in the area to start placing our fancy ocean moorings carefully into the water below the ice.

While this “operational” stuff motivated me to dive into the satellite radar data that can “see” through clouds and fog, I am most excited about the discovery that the radar data from the European Space Agency are easy to use with a little clever ingenuity and a powerful laptop (2.5 MHz Mac PowerBook). For example, this hidden gems appeared in the Chukchi Sea a few days earlier:

Close-up of the ice edge in the northern Chukchi Sea on Sept.-23, 2016. The mushroom cloud traced by sea ice and associated eddies are about 10-20 km across.

Close-up of the ice edge in the northern Chukchi Sea on Sept.-23, 2016. The mushroom cloud traced by sea ice and associated eddies are about 10-20 km across.

It is a piece of art, nature’s way to paint the surface of the earth only to destroy this painting the next minute or hour or day to make it all anew. It reminds me of the sand-paintings of some Native American tribes in the South-West of the USA that are washed away the moment they are finished. Here the art is in the painting, just as the pudding is in the eating, and the science is the thinking.

Sun Sets over Petermann Gletscher

Lights are out. Our ocean weather station on a floating glacier of northern Greenland confirms what the U.S. Naval Observatory reports for location 60 degrees and 30 minutes West longitude and 80 degrees and 40 minutes North latitude: As of today the sun is no longer above the horizon and will not rise until 23 February 2016. Total darkness means no solar power for the station that will have to survive on a fancy car battery temperatures as low as -50 degrees centigrade. Last week with the sun still up our station recorded -30.4 degrees celsius about 4 feet above the ice. How long will the station survive on that car battery?

Petermann Gletscher at dawn on 5 Oct. 2015 as captured by NASA Operation IceBridge. Our Ocean Weather Station is in the corner bottom left.

Petermann Gletscher at dawn on 5 Oct. 2015 as captured by NASA Operation IceBridge. Our Ocean Weather Station is in the corner bottom left.

Without power the station does not function, because each sensor, each computer, and each telephone call via the Iridium satellite system requires electricity. Without power I am in the dark about what the station does or what ocean or air temperatures are. Since I do have power at the moment, well, I got new data. For example, there is a voltage that the station sends me …

Voltage at Ocean Weather Station on Petermann Gletscher.

Voltage at Ocean Weather Station on Petermann Gletscher.

… whenever the sun is up, the solar panels recharge the battery and the voltage goes up. As I use electricity, the voltage goes down. Lets ignore a small temperature effect and details on how much electricity we draw at what “amperage.” Instead, lets focus on the regular up and down of voltage for the last 60 days and how it suddenly went flat. The flat line at 12.5 Volts tells me that the sun is down. The station now uses the car battery, but how long will this last? Quick answer is … a day, if I am dumb. Or 150 days, if I am smart. Time will tell, if I made a mistake in either my power budget or my computer code that gives and takes power to a range of sensors. Scary stuff, and my little sister Christina Parsons can attest, how nervous I was, when I uploaded new power-saving software that I wrote from my attic at home to the station in Greenland. The station did take the new software, restarted itself, and works making one data call each day instead of three. Data are still collected every hour, but I save 20% of total power.

Power is something in Watts (40 W Light bulb anyone?) and you have to multiply voltage by current draw (0.5 Amps anyone?) to estimate the power needs of the device drawing 0.5 Amp current at 12 Volts. Incidentally, 0.5 Amps is what the Iridium satellite phone draws when it calls me with new data. Let me check my power budget, if this is true … nope, it only takes 0.365 Amps, so it takes 12 volts times 0.365 Amps equal 4.4 Watts which is about 1/10 of that 40 W light bulb you are looking at, perhaps, or the station we put up: the yellow box is the car battery powering all the gadgets you see and many more you do not:

What I just showed you is the beginning of a power budget that I had to make to get my station through the night, now that there is no more sun for the next 4-5 months. My car batteries are rated to give 110 Watts for an hour, so if I run my 4.4 W satellite phone all the time, I would be out of battery juice after 110 Watt-Hours divided by 4.4 Watts equals 25 hours. That’s bad, real bad, especially since one should not run a car battery to zero and the battery at -30 degrees Celsius may only give me half the power than it would at the more usual 15 degrees Celsius we got outside. The solution to this problem is to use the phone only for a few minutes each day, say 5 minutes. So, since I am using the phone only 5 minutes out of the 1440 minutes that each day has, it takes about 1440 minutes divided by 5 minutes times 25 hours equals 300 days for the phone running 5 minutes each day to run down the battery. Magic this math is not, but it shows how important it is to use resources (electricity) wisely. There are times and places where it is not possible to plug your iPhone into a power outlet. You get the picture … well, here are some that University of Delaware PhD student Peter Washam took who was part of the ice drilling team during last summer’s deployment of the ocean weather station:

So, as of this morning at 4 am Delaware time, the station now in total darkness tells me that the ocean temperatures 700 meters below the 100 meter thick glacier are +0.3 degrees Celsius while air temperatures 2 meters above the ice are -11.1 degrees Celsius. Now what that means to the melting of the glacier by the ocean, I will have to tell you at another time in more detail. These data are the ONLY data from below any glacier to the north of the equator. We are really breaking new ground and are making new discoveries as we go along … as long as there is power. Hopefully there is no dumb mistake in my power budget.

Sun over the horizon of Greenland as seen during NASA's Operation IceBridge Flight in October 2015.

Sun over the horizon of Greenland as seen during NASA’s Operation IceBridge Flight in October 2015.