I want to build a cell phone system under water. I want it to send me a text messages every 30 minutes from 200 feet below the ocean that is covered by sea ice next to a glacier in northern Greenland where polar bears roam to catch seals for food at -40 Fahrenheit. Why would I want to do this and is this is even possible?

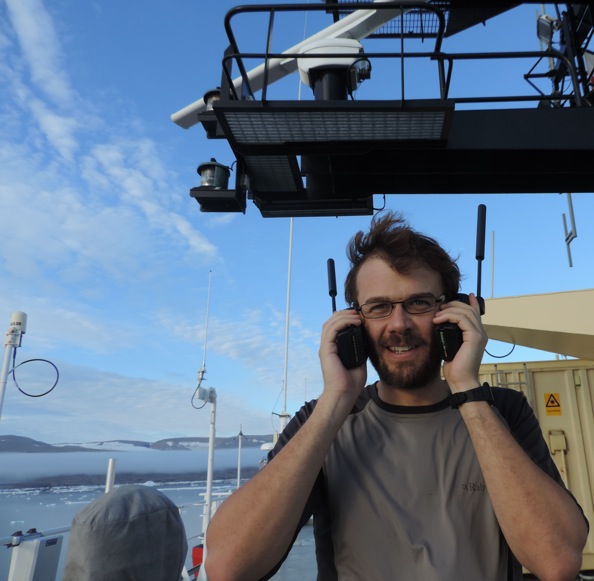
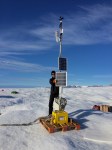
The author measuring sea ice thickness in Wolstenholme Fjord, Greenland April-17, 2017.
Our project successfully showed that it is possible to move data as text messages from a computer in the ocean to another and on to another and then via a cable to a weather station and then on to a satellite and then on to my laptop at home somewhere, anywhere, really [Intellectual Merit]. The ocean data that we moved by whispering from modem to modem (my acoustic cell phone towers) under water can be anything that any scientist may want to study. It could, for example, detect pollutants in the water that seep out of the sediment like gas or oil or radioactive materials burried accidentally [Broader Impacts] such as a nuclear-tipped B-52 bomber that crashed into Wolstenholme Fjord on January-21, 1968 at the height of the Cold War. The propagation of sound under ice also has military applications, because our communication network operates in both ways, that is, if I can receive a text message, I can also send one [Broader Impacts].

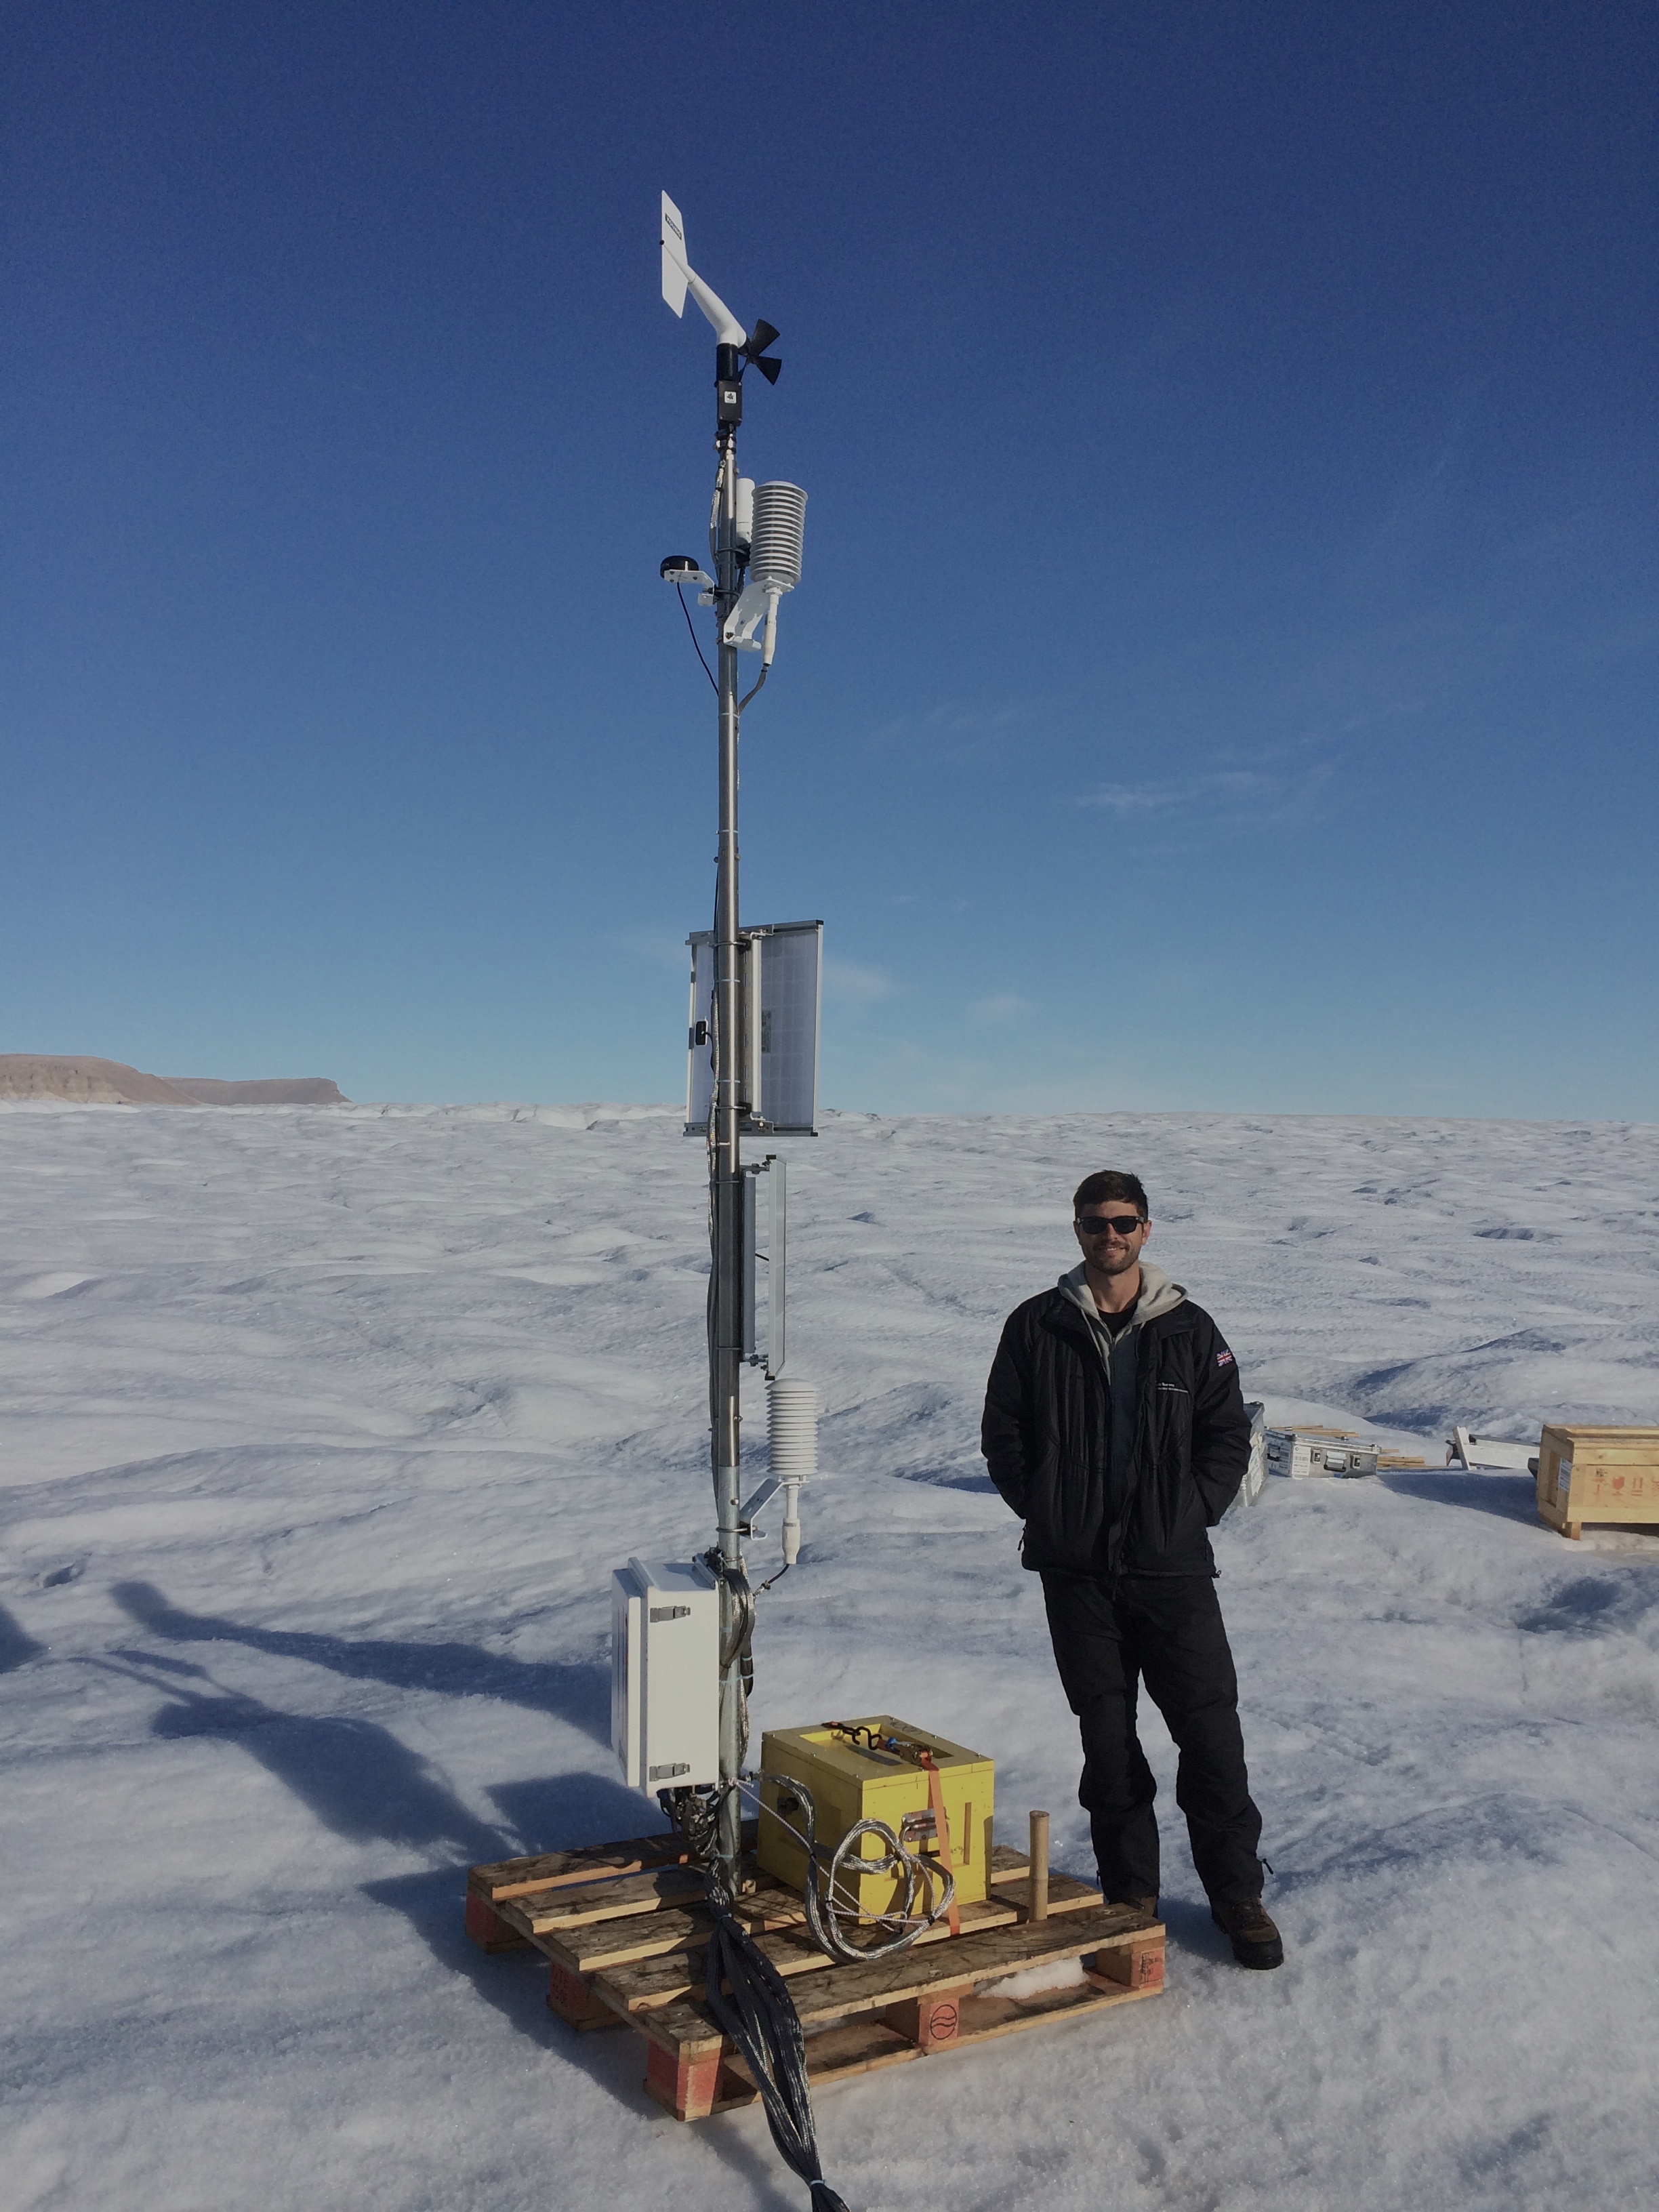
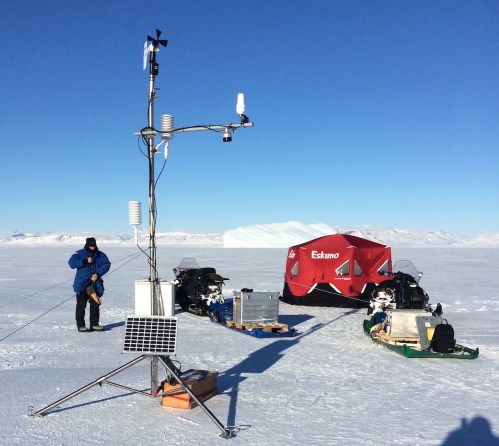
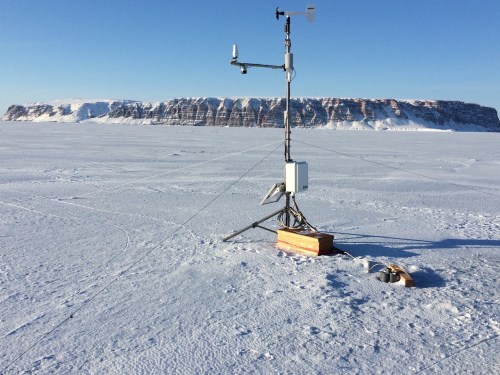
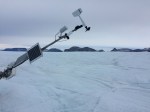
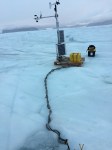
Installation of Automated Weather Station on Mar.-23, 2017 near Thule, Greenland via snowmobile. The station includes a satellite connection to the internet and a cable to the ocean.
While the problem sounds simple enough, it is hard, real hard, because it requires many different people with very different skill sets. Our project included mechanical, electrical, and computer engineers but also scientists who know about acoustics, oceanography, and sea ice, as well as technicians with common sense and practical abilities to keep machines and people moving and running safely. This includes guns that we had to carry while working on the sea ice via snowmobile to protect from polar bears and medically trained personnel who could spot frostbites before they bite. All of this has to come together in just the right way and right time. Good and successful science is more than just engineering and machines, there is a strong human element in all polar field work such as ours.
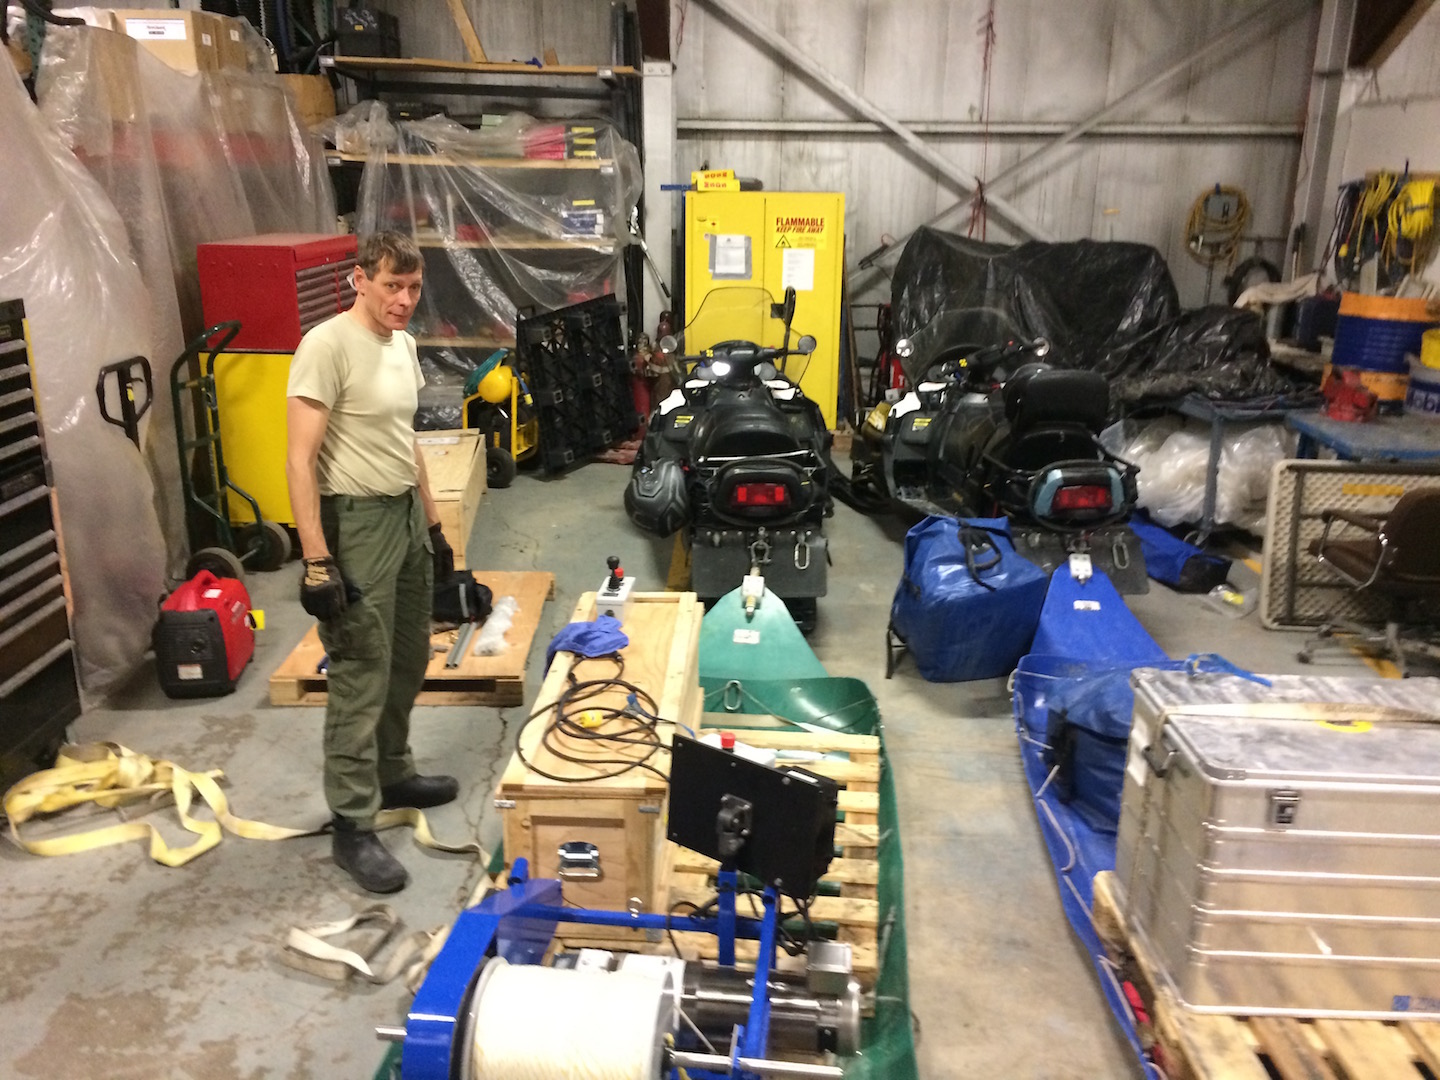
A local volunteer is designing, building, and rigging the Research Sled R/S Peter Freuchen for profiling the ocean below the sea ice in March 2017 on Thule Air Base.
The first step in our project involved the design of the acoustic modems that Lee Freitag of Woods Hole Oceanographic Institution did many years back. It took us about 2 years to select this design that Lee then modified for this application in 2014-15). The second step involved the selection of a study site where our small group of 6 people could work and experiment and learn by some trial and error without incurring extra-ordinary costs (2015-16). It helped that I was in and out of Thule Air Base on unrelated projects in 2015 and 2016 when we settled for the final experiment to take place in March and April of 2017. Satellite remote sensing tools where then developed to quantify sea ice conditions for safe operation and navigation traveling on the ice. We uncovered a barely visible area of thin ice to the south of Manson Island that recurs at the same location every year. We stayed clear of this area.
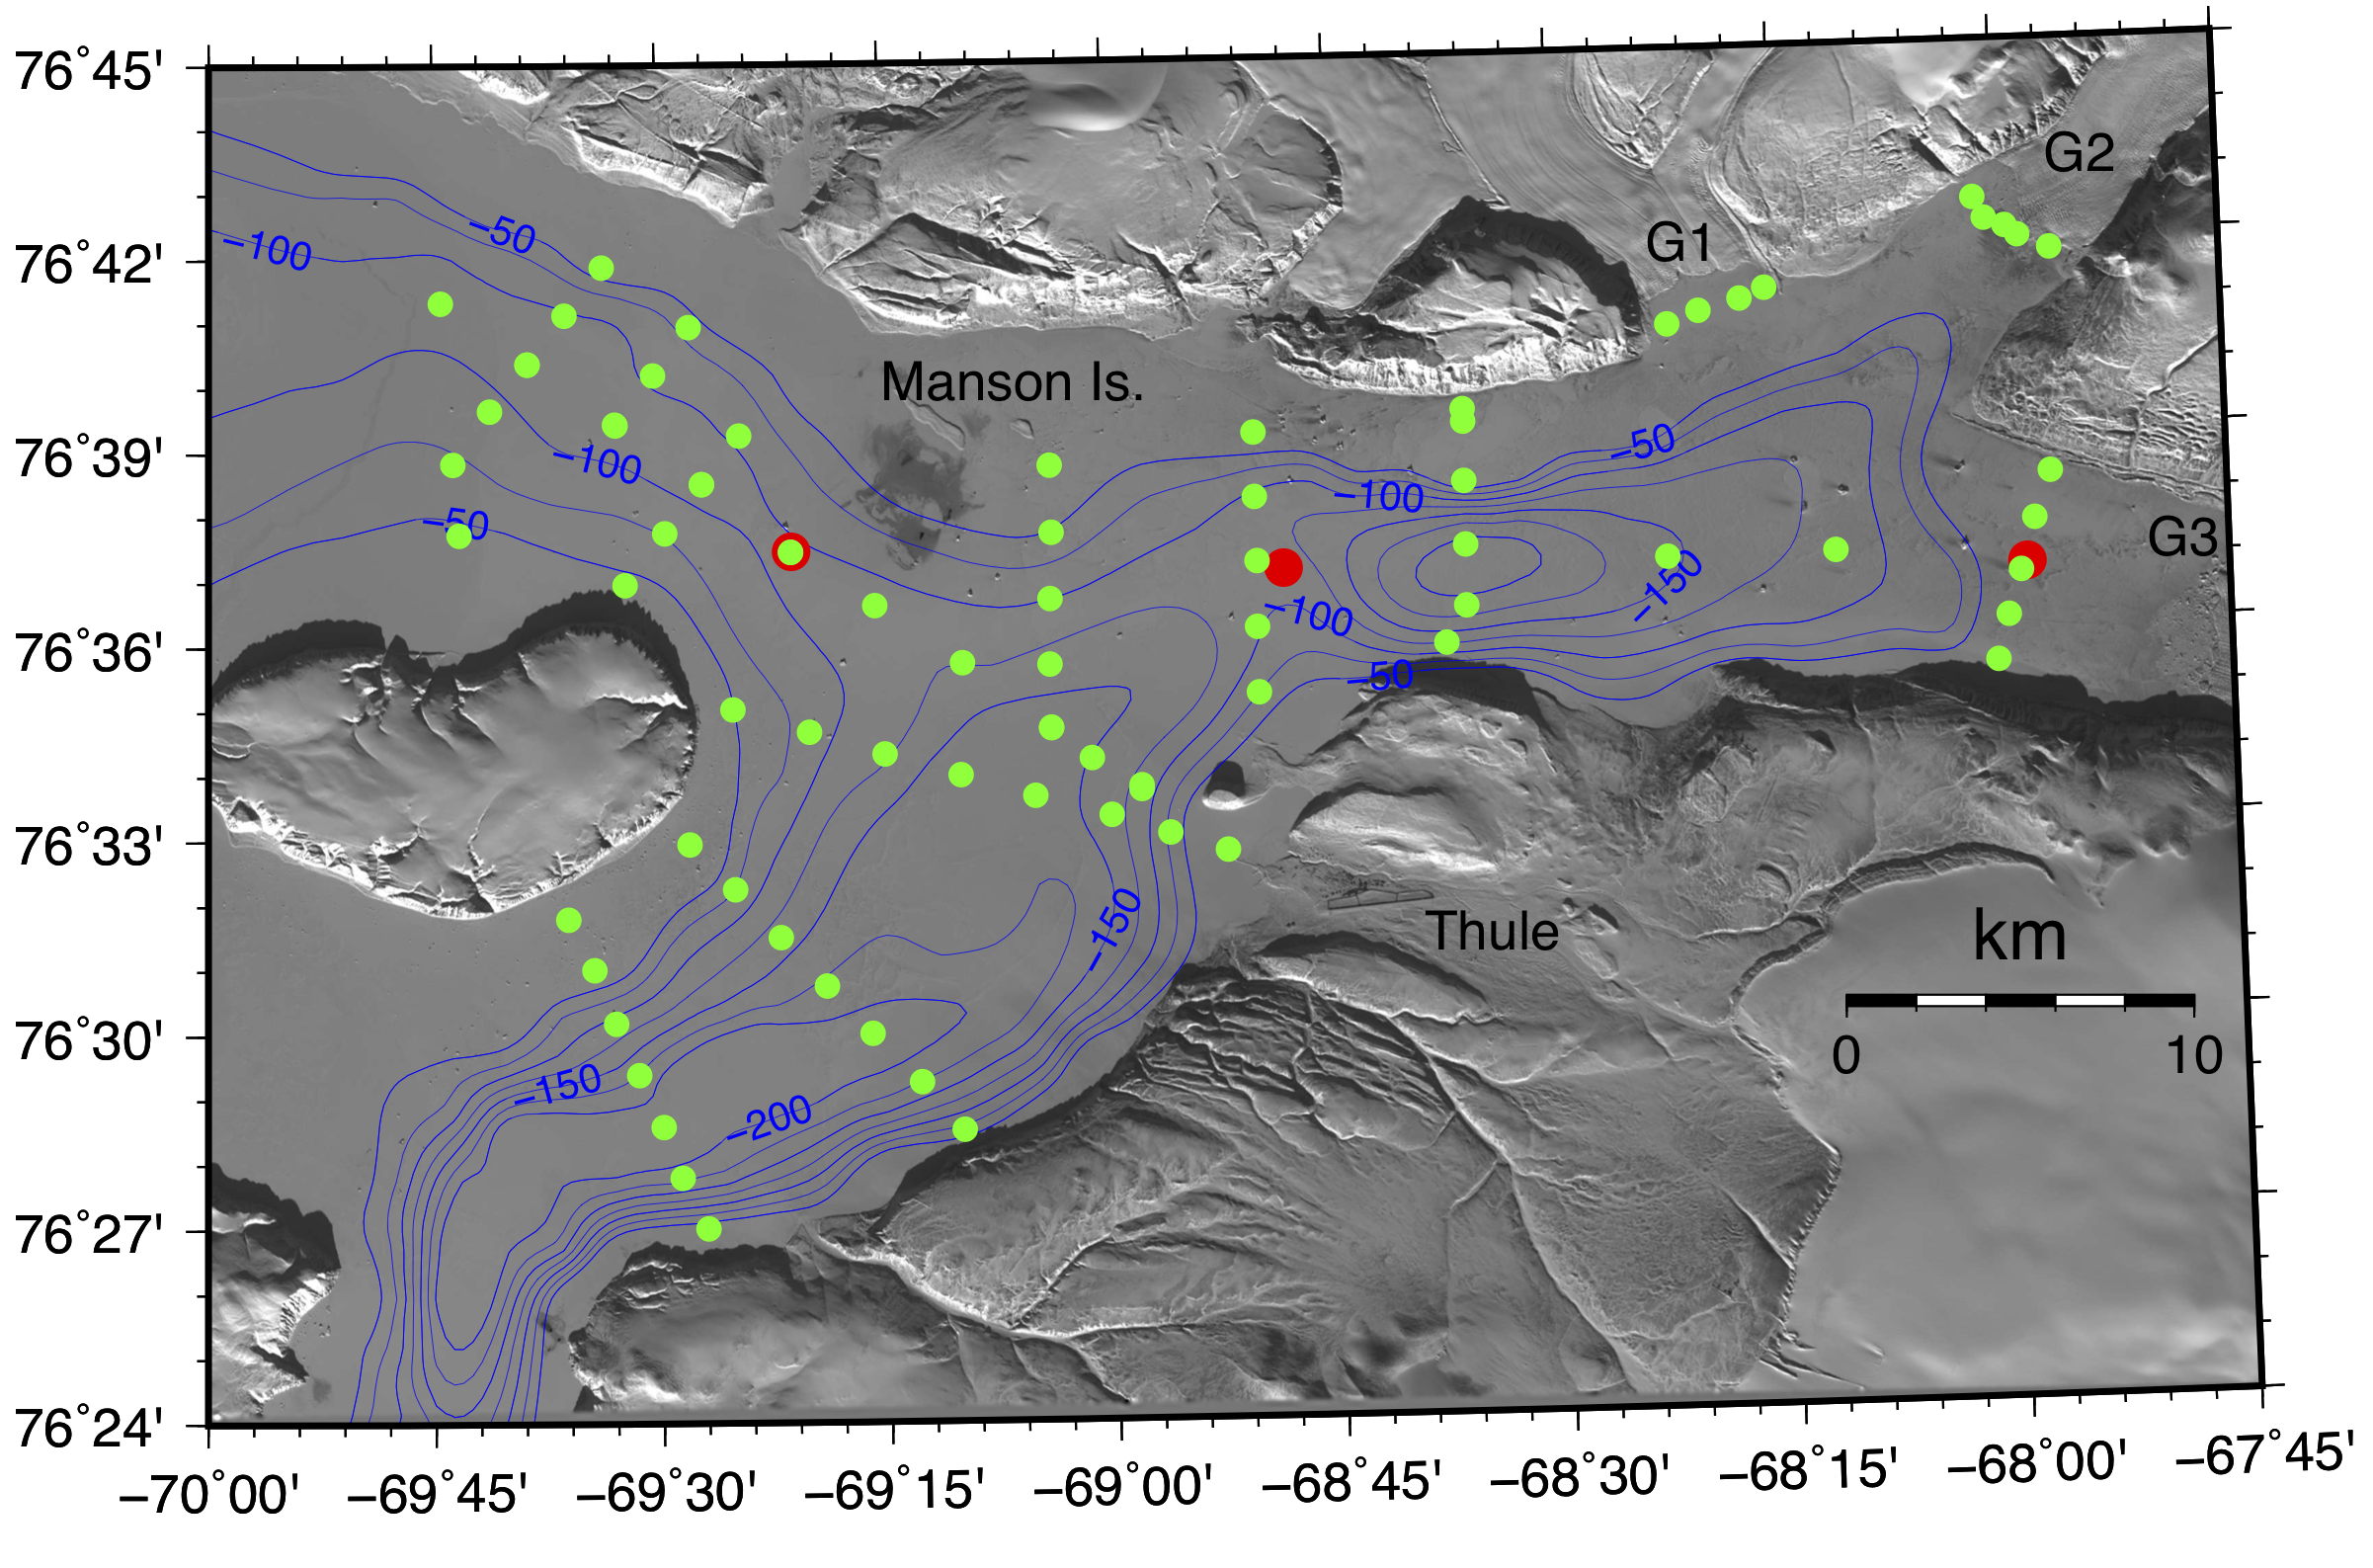
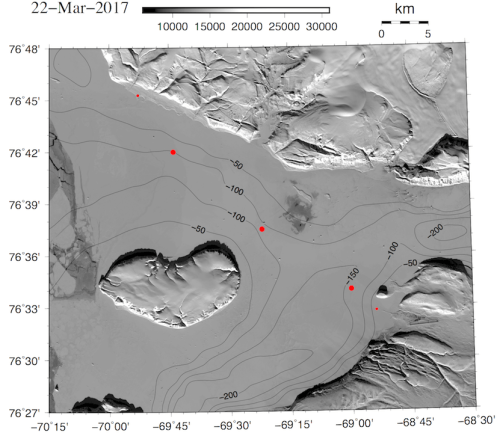
Satellite image of ice-covered Wolstenholme Fjord, Greenland with water column profiling station (green dots) and acoustic modems (red dots). Blue lines are water depths in meters. Labels G1, G2, and G3 indicate three tide-water glaciers while Thule refers to Thule Air Base. Saunders Island is near the center left while the weather station is the red dot halfway between Saunders and Manson Islands.
Field work started with a survey of sea ice thickness on Mar. 18/19, 2017 by drilling 2” holes through the sea ice that varied in measured thickness from 0.12 m (4 inches) near Manson Island to 1.25 m (4 feet) near Thule Air Base. On Mar.-23, 2017 we deployed the weather station along with a tent and survival gear at the center of our study area. An ocean temperature mooring was deployed to complement in time a spatial survey of ocean sound speed profiles estimated from conductivity, temperature, depth (CTD) measurements. We drilled 10” holes through the sea ice for our profiling CTD operated via an electrical winch. Our CTD survey spanned the entire fjord from three tidewater glaciers in the east to the edge of the sea ice in the west. Concurrently ocean testing of acoustic communication between modems commenced Apr.-8, 2017 and the final array was deployed Apr.-14/15 to be fully operational Apr.-16/18. All gear was recovered and stored at Thule Air Base Apr.-18/19, 2017 before our departure Apr.-20, 2017.
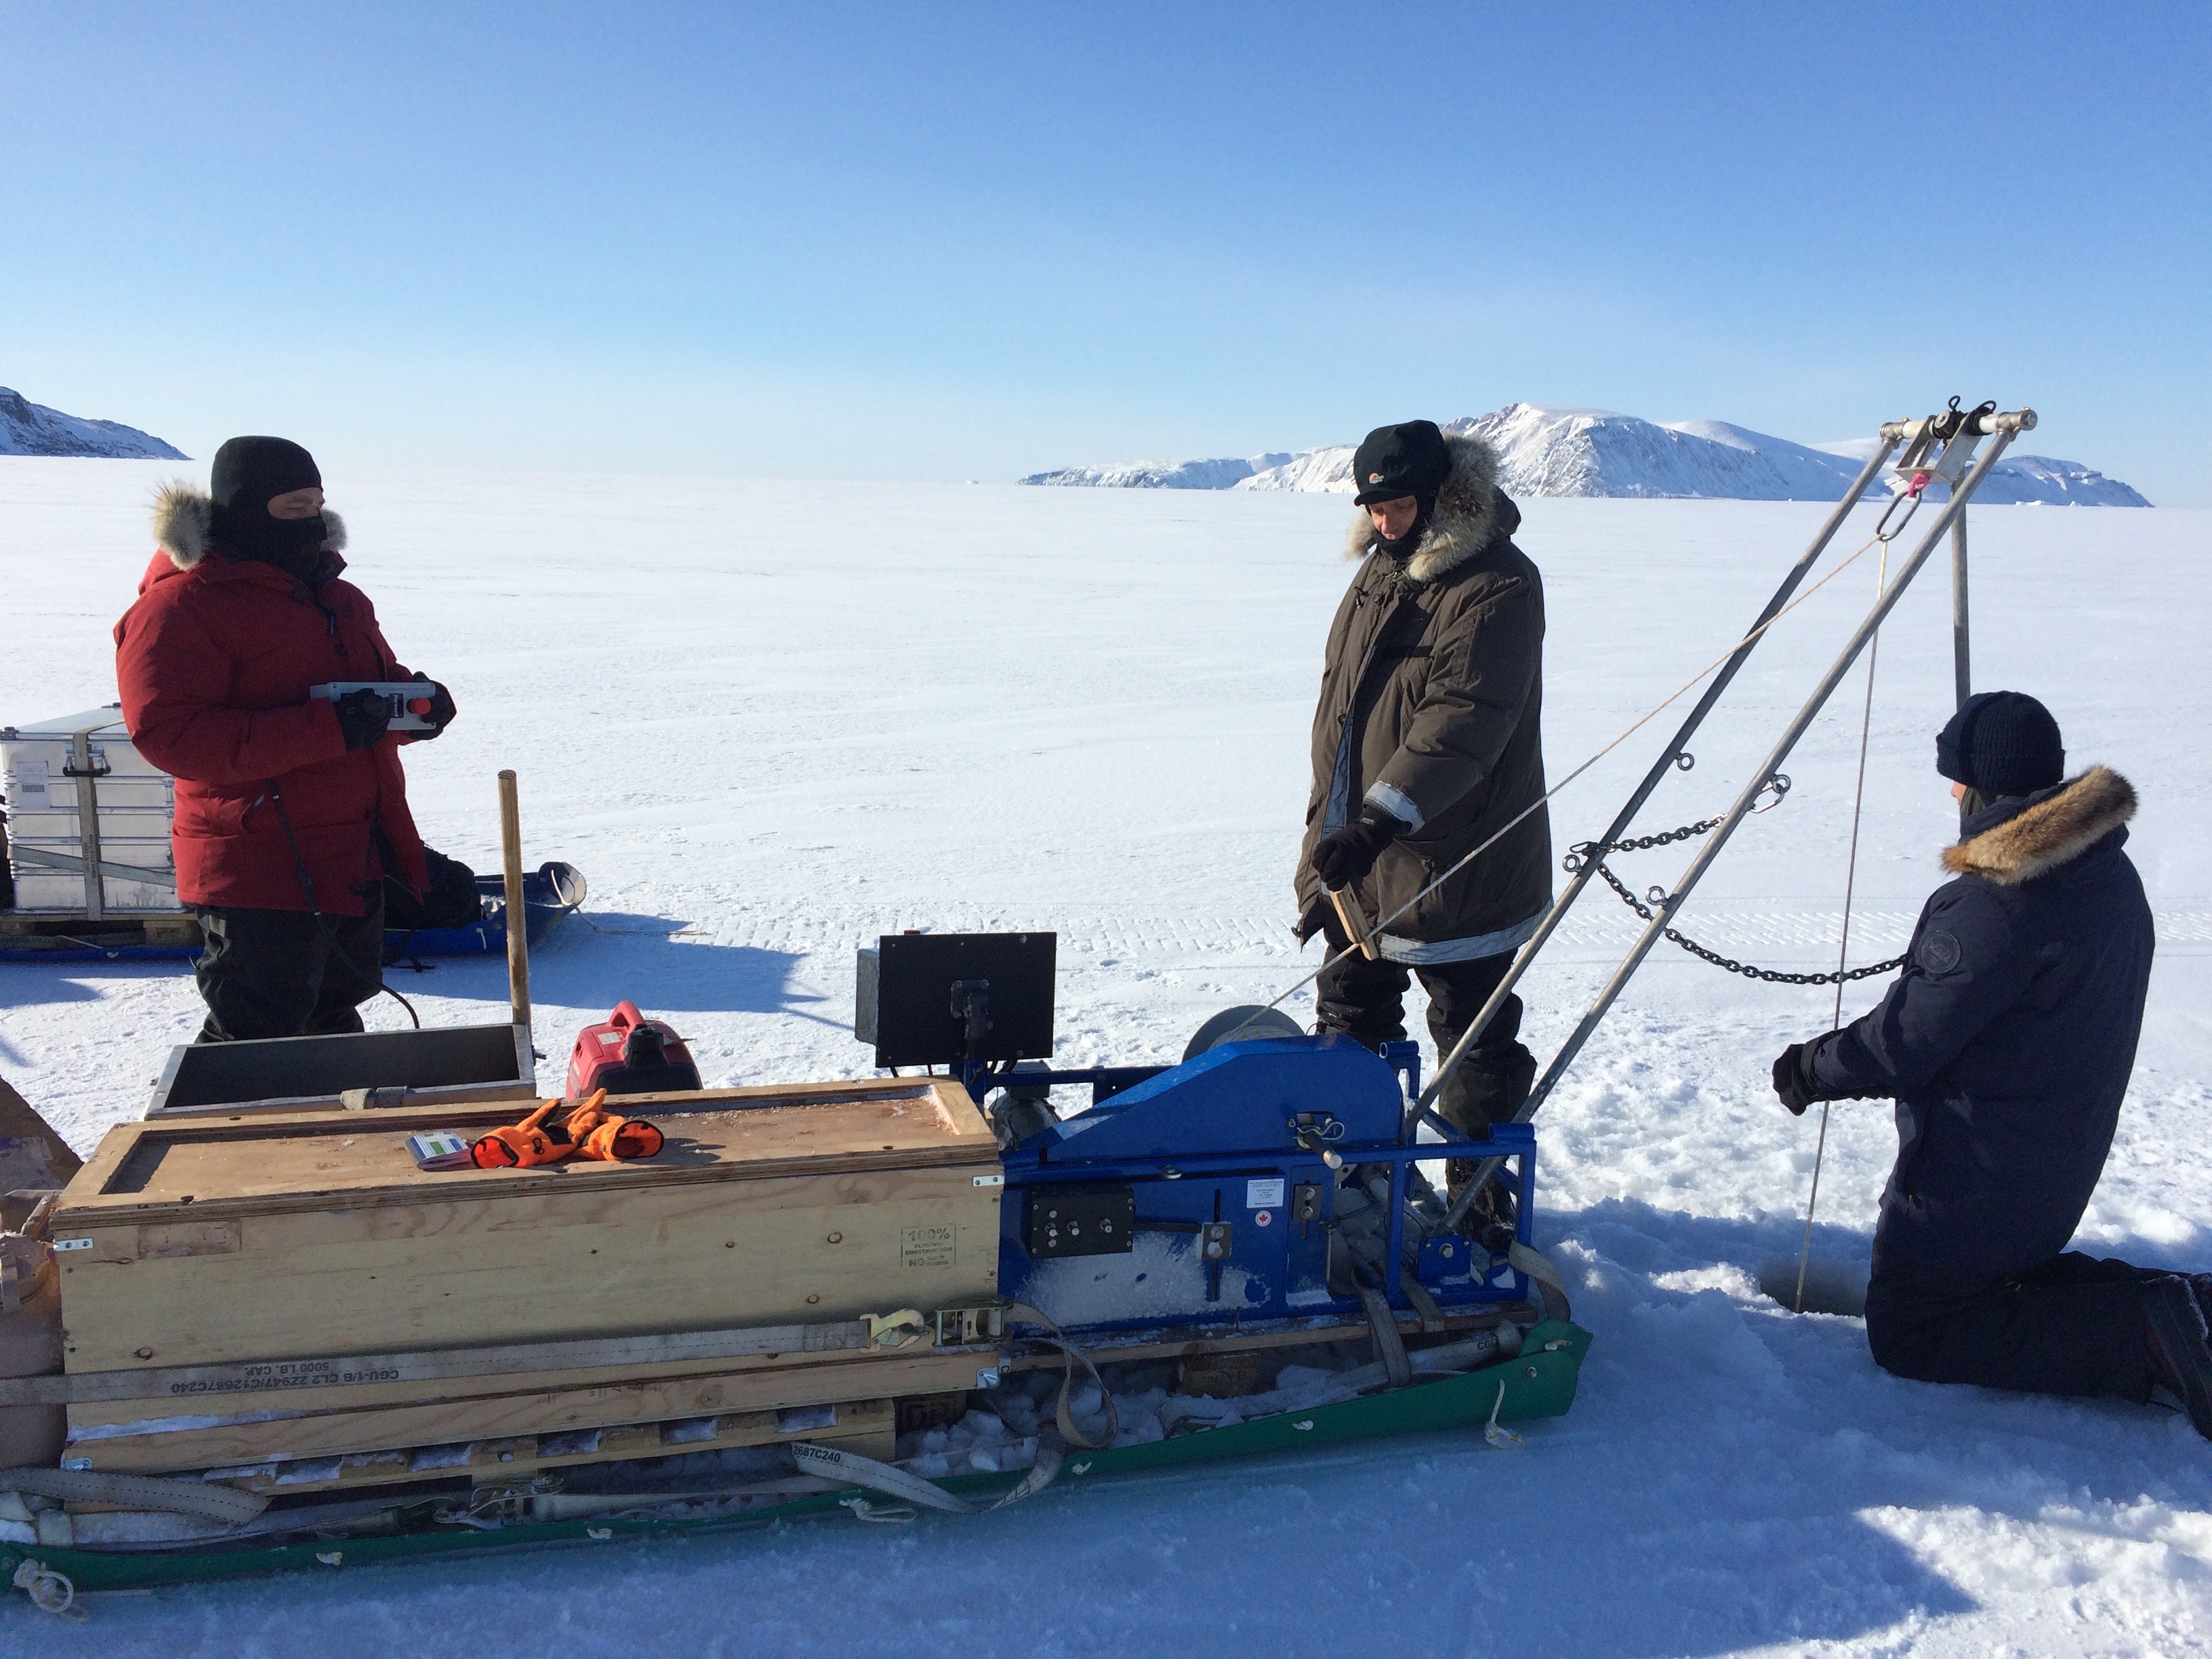
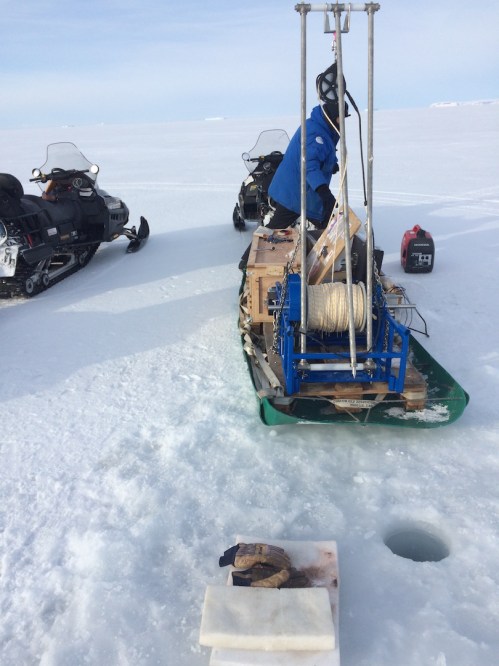
Research Sled “Peter Freuchen” with wooden CTD storage box, electrical winch, tripod, and electrical motor during deployment on Apr.-7, 2017. View is to the west with Cape Atholl on the left and Wolstenholme Island on the right background. University of Delaware technician operates the winch via joy stick while a student monitors the instrument’s descent through water column visually at the 10” hole and acoustically via a commercial Fish-Finding sonar.
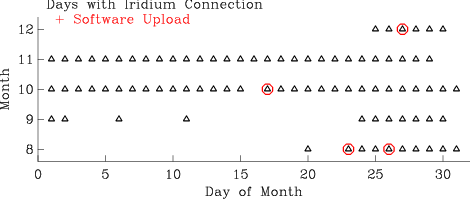
Subsequent analysis in 2017/18 revealed a successful experiment as data from ocean sensors traveled along multiple paths to the weather station and on to the internet. All data were submitted to the NSF Arctic Data Center where after review they will become public at
https://arcticdata.io/catalog/view/urn:uuid:d2775281-3231-47d0-ab79-b2e506ea8d04
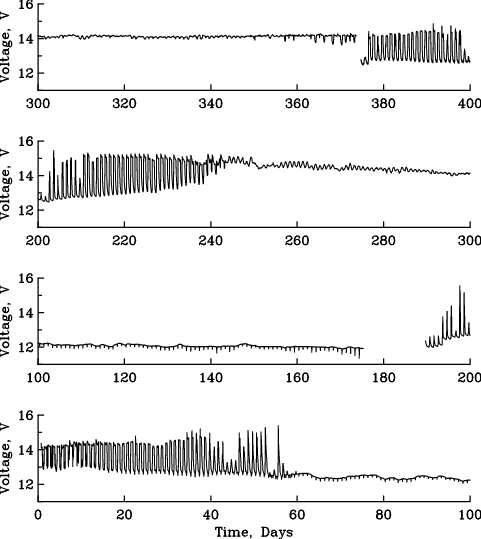
This graph is just one of many in desperate need of a proper peer-reviewed publication. There is always more work to do …

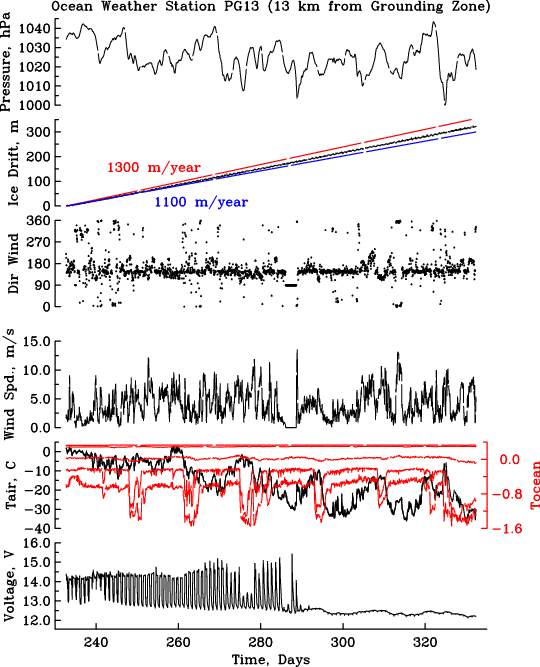
Time series of ocean temperature at the weather station from 10-m (top) to 100-m (bottom below the sea ice. The red line gives the -1.7 Celsius for reference. The temperature field dominates the speed of sound field. Note the presence and absence of tidal oscillations.


![Time series of salinity (top) and potential temperature (bottom) from four ocean sensors deployed under the ice shelf of Petermann Gletscher from 20th of August 2015 through 11th of February 2016. Temperature and salinity scales are inverted to emphasize the vertical arrangements of sensors deployed at 95m (black), 115 (red), 300 m, and 450 m (blue) below sea level. Note the large fortnightly oscillations under the ice shelf at 95 and 115 m depth in the first half of the record. [From Muenchow et al., 2016]](https://icyseas.org/wp-content/uploads/2016/09/tos-f07.png)