
Ocean data from 810 meters below sea level under one of Greenland’s last remaining ice shelves arrives every 3 hours at my laptop via a 3-conductor copper cable that passes through 100 meter thick ice to connect to a weather station that via a satellite phone system connects to the rest of the world. This Ocean-Weather station on the floating section of Petermann Gletscher has reported for 400 days today. I am still amazed, stunned, and in awe that this works.
-
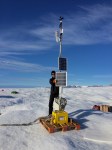
- University of Delaware Ocean Weather Station 13 km seaward from the grounding zone of Petermann Gletscher [Credit: Peter Washam]
-
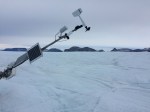
- Top section of the University of Delaware weather station on Petermann Gletscher on 27 August 2016. View is to the north-east.
-
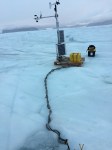
- Cabled ocean observatory linked to a University of Delaware weather station on Petermann Gletscher, Greenland on 28 August 2016. View is to the north.
The station started 20th August of 2015 as a small part of a larger joint US-Swedish expedition to North Greenland after friends at the British Antarctic Survey drilled holes through the Empire-State-Building thick ice shelf. It is powered by two 12 Volt car batteries that are recharged by two solar panels. When the sun is down, the car batteries run the station as in winter when temperatures reached -46 C. When the sun is up, the solar cells run the station and top off the batteries. The voltage during the last 400 days shows the “health” of the station:
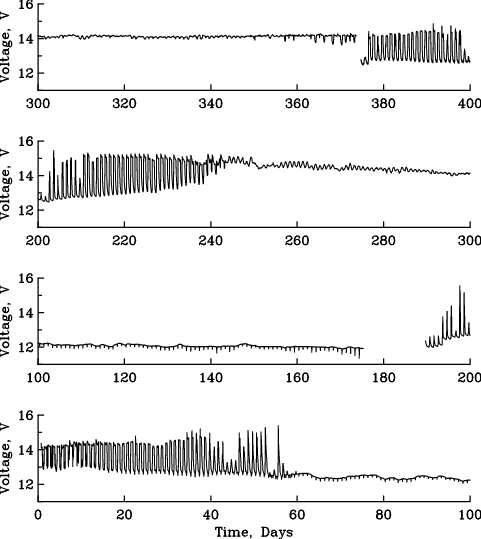
Battery voltage at the Petermann Ocean-Weather Station from Aug.-20, 2015 through Sept.-23, 2016. The polar night is indicated by slowly declining voltage near 12 V while during the polar day voltage is near 14 V with oscillations in spring and fall during the transition from 24 hours of darkness to 24 hours of sun light.
There is an unexplained outage without data from February 12-25 (Day 175-189) which happened a day after the first data logger shut down completely without ever recovering. Our station has 2 data loggers: A primary unit controls 2 ocean sensors, atmospheric sensors, and the Iridium satellite communication. The secondary unit controls 3 ocean sensors and the GPS that records the moving glacier. Remote access to the secondary logger is via the primary, however, each logger has its own processors, computer code, and back-up memory card.
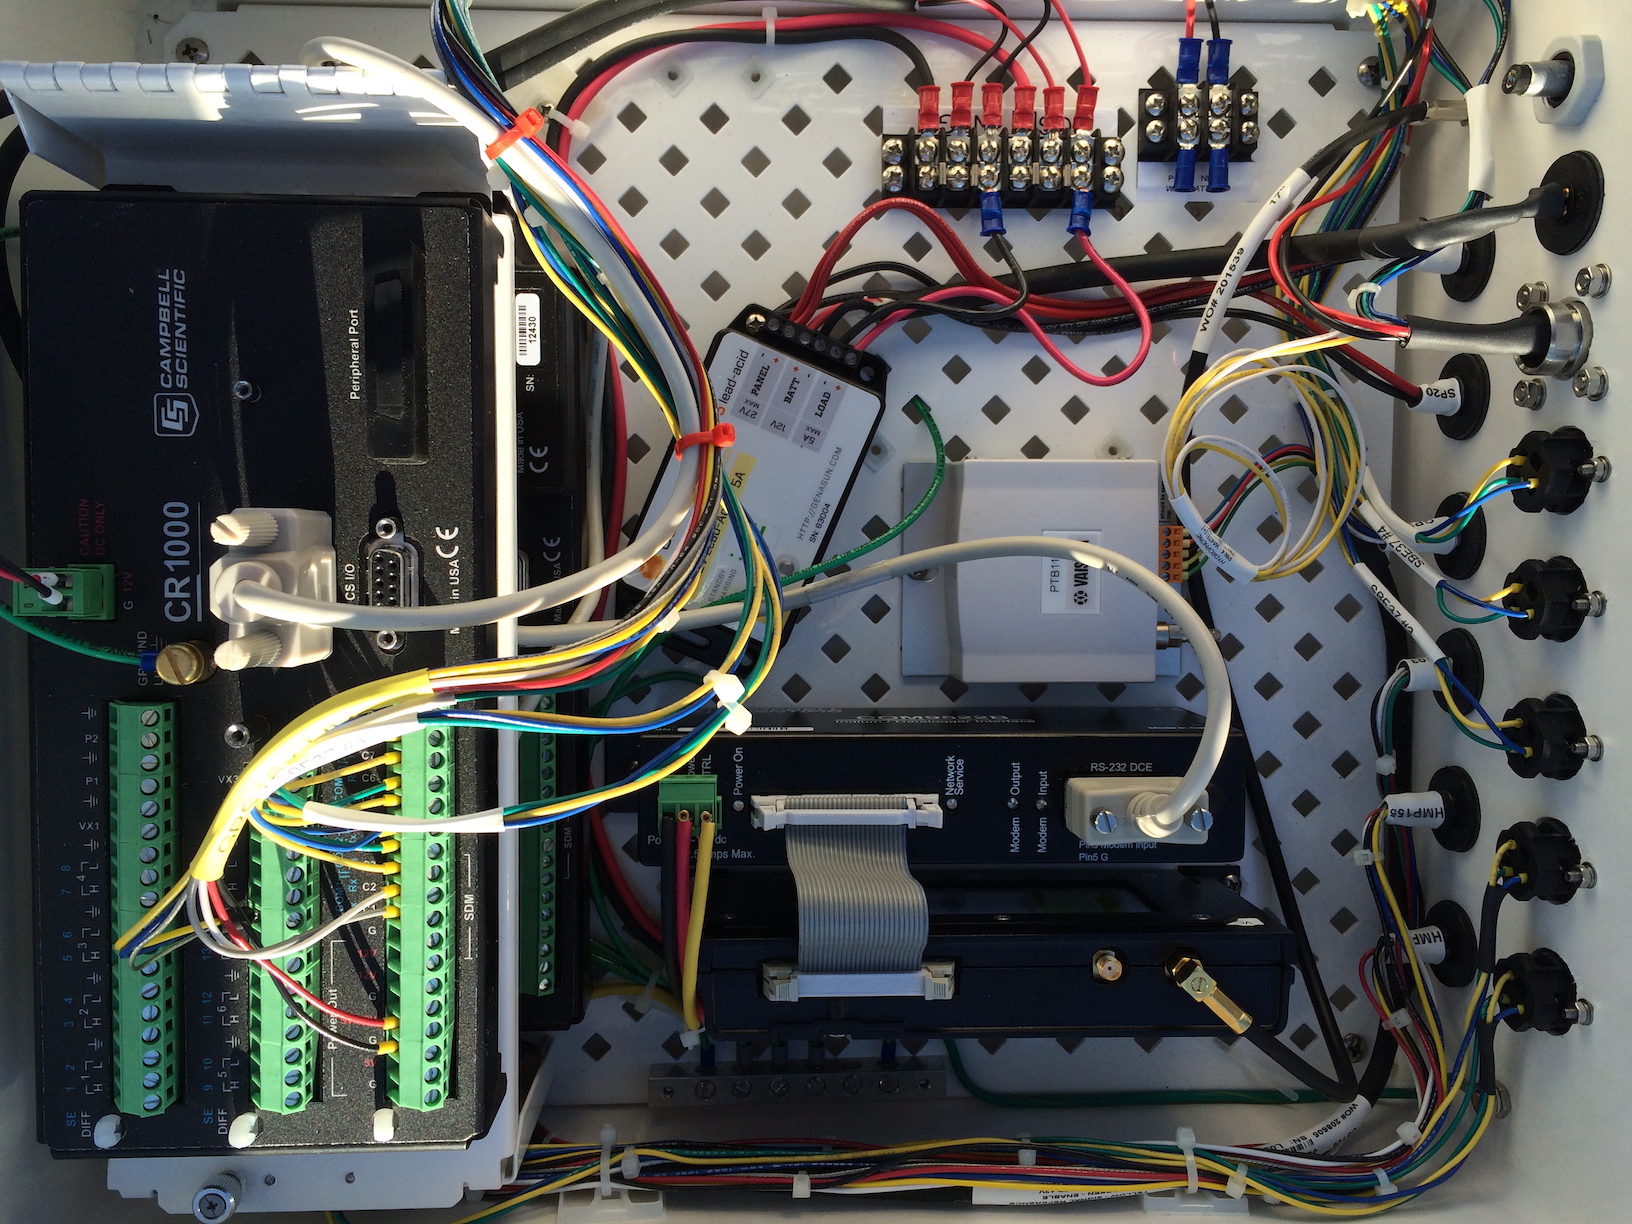
Inside of University of Delaware command and control of five ocean sensors and surface weather station. Two data loggers are stacked above each other on the left.
The primary logger failed 11th February 2016 when we received our last data via Iridium satellites until Keith Nicholls and I visited the station 27th and 28th August 2016 via helicopter from Thule, Greenland. Since I could not figure out what went wrong sitting on the ice with the helicopter waiting, I spent a long night without sleep to swap the data logger with a new and tested unit. I rewired sensors to new data logger, switched the Iridium modem, transceiver, and antenna, changed the two car batteries, and now both data loggers with all five ocean sensors have since reported faithfully every 3 hours as scheduled as seen at
Lets hope that the station will keep going like as it does now.
The major discovery we made with the ocean data are large and pronounced pulses of fresher and colder melt waters that swosh past our sensors about 5 and 25 meters under the glacier ice. These pulses arrive about every 14 days and this time period provides a clue on what may cause them – tides. A first descriptive report will appear in December in the peer-reviewed journal Oceanography. Our deeper sensors also record increasingly warmer waters, that is, we now see warm (and salty) waters under the glacier that in 2015 we saw more than 100 km to the west in Nares Strait. This suggests that the ocean under the glacier is strongly coupled to the ambient ocean outside the fjord and vice versa. More on this in a separate future posting.
![Time series of salinity (top) and potential temperature (bottom) from four ocean sensors deployed under the ice shelf of Petermann Gletscher from 20th of August 2015 through 11th of February 2016. Temperature and salinity scales are inverted to emphasize the vertical arrangements of sensors deployed at 95m (black), 115 (red), 300 m, and 450 m (blue) below sea level. Note the large fortnightly oscillations under the ice shelf at 95 and 115 m depth in the first half of the record. [From Muenchow et al., 2016]](https://icyseas.org/wp-content/uploads/2016/09/tos-f07.png)
Time series of salinity (top) and potential temperature (bottom) from four ocean sensors deployed under the ice shelf of Petermann Gletscher from 20th of August 2015 through 11th of February 2016. Temperature and salinity scales are inverted in order to emphasize the vertical arrangements of sensors deployed at 95m (black), 115 (red), 300 m, and 450 m (blue) below sea level. Note the large fortnightly oscillations under the ice shelf at 95 and 115 m depth in the first half of the record. [From Muenchow et al., 2016]
P.S.: The installation and year-1 analyses were supported by a grants from NASA and the Jet Propulsion Laboratory, respectively, while the current work is supported by NSF for the next 3 years. Views and opinions are mine and do not reflect those of the funding agencies.


