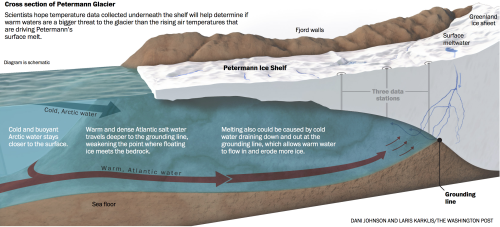
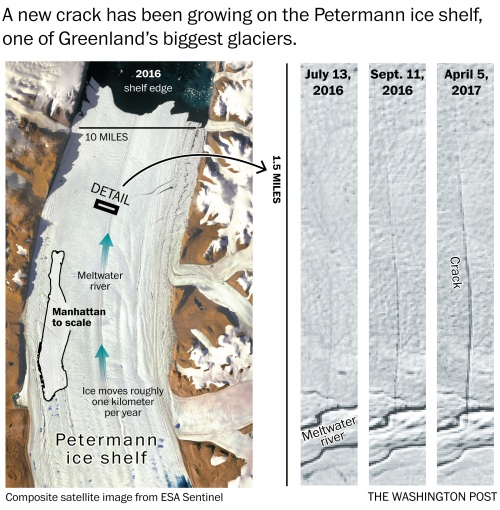
Testifying before the US Congress back in 2010, I refused to endorse the view that a first large calving at Petermann Gletscher in North Greenland was caused by global warming. When a second Manhattan-sized iceberg broke off in 2012, I was not so sure anymore and looked closely at all available data. There was not much, but what little I found suggested that ocean temperatures were steadily increasing. Could it be that warm waters 1000 feet below the surface could melt the glacier at all times of the year? Did this melting from below thin the glacier? Did these changes increase the speed at which it moves ice from land into the ocean? These were the questions that motivated a number of projects that began in earnest in 2015 aboard the Swedish icebreaker I/B Oden. Professional videos of this expeditions are at https://icyseas.org/2019/07/04/petermann-glacier-videos-science/

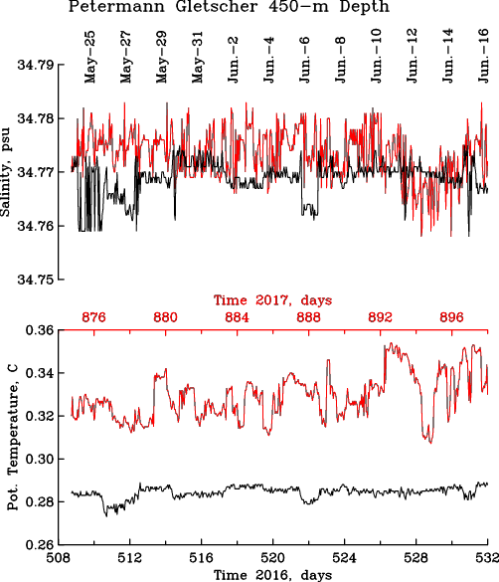
Scientists and technicians from the British Antarctic Survey drilled three holes through the floating section of Petermann Gletscher to access the ocean and ocean sediments below it. The ocean temperature and salinity profile confirmed both the warming trend observed in the fjord and ocean adjacent to the glacier, but more importantly, we placed ocean sensors below the glacier ice to measure temperature and salinity every hour for as long as the sensors, cables, and satellite data transmission would work. This has never been done around Greenland, so our data would be the first to report in real time on ocean properties below 100 to 300 m thick glacier ice at all times. What we saw when the data started to come in after 2 weeks, a month, and half a year stunned us, because (a) the ocean waters under the glacier changed by a very large amount every two weeks. Nobody has ever seen such regular and large changes in tempertures (and salinity) under a glacier bathed in total darkness at air temperatures of -40 degrees Celsius and Fahrenheit, but then our station went offline after 6 months and did not report any data to us via satellite.

Helicopter flight path on 27/28 August 2016 to reach Petermann Gletscher (PG) via southern (Fuel-S) and northern (Fuel-N) fuel stops in northern Inglefield and southern Washington Land, respectively. Background color is ocean bottom depth in meters.

Refurbished Petermann Glacier Ocean Weather station on 28. August 2016 with Greenland Air helicopter and British Antarctic radar station in the background.
The first work on the grant was to visit our station by helicopter in 2016 using two fuel caches that we placed the year prior from the Swedish icebreaker. At this point Petermann Gletscher and our projects attracted the attention of journalists of the Washington Post who had read some of the blog articles at this site. The two journalists accompanied us for a week and produced a beautiful visual report of our work that is posted at
A detailed news report on our science and new findings appeared on page-1 of the Washington Post on January 1, 2017 [Broader Impacts]. I briefly summarize the results and findings of our subsequent data analyses of all data from August of 2015 through October of 2017 [Intellectual Merit]:
1a. Ocean temperatures increase at all five depths below the 100-m thick floating ice shelf of the glacier. These warmer waters are also saltier which demonstrates their Atlantic origin.
1b. Surface sensors indicate short, but intense pulses of meltwater passing our ocean array at spring-neap tidal cycles.
2a. Melt rate data reveal that these pulses occur during reduced tidal amplitudes and follow peaks in glacier melting that exceeded 30 feet per year.
2b. Statistical analyses indicate that the melt waters originate from a location near where the glacier sits on bed rock and that the melt water then moves seaward towards the ocean.
3a. Ocean melting below the glacier varies from summer (strong) to winter (weak) rising from a winter mean of 6 feet per year to a maximum of 240 feet per year during the summer.
3b. The large summer melting is caused by the increased discharge of subglacial runoff into the ocean near the grounding line.
3c. The larger discharge strengthens ocean currents under the floating glacier that drive ocean heat toward the glacier’s ice base.

The work formed one basis for the dissertation of PhD student Peter Washam who published the items #2 and #3 in the Journal of Physical Oceanography and Journal of Glaciology, respectively. He helped to drill holes and install sensors for the project that we first described at #1 in Oceanography. These three peer-reviewed journal articles are all published by not-for-profit professional organizations and societies dedicated to higher learning and public outreach. Furthermore we placed three separate data sets (1 | 2 | 3) at the Arctic Data Center that is funded by the National Science Foundation. More will come as we continue to work on the hard-won data from below Petermann Gletscher.

Look down the 0.3 meter wide drill hole. Yellow kevlar rope supports cable and ocean sensors.
Post Scriptum:
A modified version of the above was submitted the US National Science Foundation as part of the final reporting on grant 1604076 (“Glacier-Ocean interactions at a Greenland ice shelf at tidal to interannual time scales”) that funded this work with $360,400 at the University of Delaware from August 2016 through July 2019.


