
I am disturbed by new ocean data from Greenland every morning before breakfast these days. In 2015 we built a station that probes the ocean below Petermann Gletscher every hour. Data travels from the deep ocean via copper cables to the glacier surface, passes through a weather station, jumps the first satellite overhead, hops from satellite to satellite, falls back to earth hitting an antenna in my garden, and fills an old computer.
-

- The Petermann data machine with batteries (yellow box), solar panels, electronics (white box), antenna, wind vane, and cables to ocean sensors on ground as last seen Aug.-2016.
-
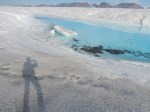
- Central channel at the end of the melt season in August 2015. Shadow of photographer for scale.
-
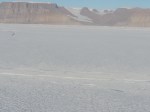
- View to the north-east across Petermann Gletscher from helicopter in August 2015. The growing crack is barely visible emanating from the shear zone near the 1000-m high cliff.
A 7-minute Washington Post video describes a helicopter repair mission of the Petermann data machine. The Post also reported first result that deep ocean waters under the glacier are heating up.

Sketch of Petermann Gletscher’s ice shelf with ocean sensor stations. The central station supports five cabled sensors that are reporting hourly ocean temperatures once every day. Graphics made by Dani Johnson and Laris Karklis for the Washington Post.
After two years I am stunned that the fancy technology still works, but the new data I received the last 3 weeks does worry me. The graph below compares ocean temperatures from May-24 through June-16 in 2017 (red) and 2016 (black). Ignore the salinity measurements in the top panel, they just tell me that the sensors are working extremely well:

Ocean temperature (bottom) and salinity (top) at 450-m depth below Petermann Gletscher from May-25 through June-16 2017 (red) and 2016 (black). Notice the much larger day-to-day temperature ups and downs in 2017 as compared to 2016. This “change of character” worries me more than anything else at Petermann right now.
The red temperature line in the bottom panel is always above the black line. The 2017 temperatures indicate waters that are warmer in 2017 than in 2016. We observed such warming for the last 15 years, but the year to year warming now exceeds the year to year warming that we observed 10 years ago. This worries me, but three features suggest a new ice island to form soon:
First, a new crack in the ice shelf developed near the center of the glacier the last 12 months. Dr. Stef Lhermitte of Delft University of Technology in the Netherlands discovered the new crack two months ago. The new rupture is small, but unusual for its location. Again, the Washington Post reported the new discovery:

New 2016/17 crack near the center of Petermann Gletscher’s ice shelf as reported by Washington Post on Apr.-14, 2017.
Second, most Petermann cracks develop from the sides at regular spaced intervals and emanate from a shear zone at the edge. Some cracks grow towards the center, but most do not. In both 2010 and 2012 Manhattan-sized ice islands formed when a lateral crack grew and reached the central channel. The LandSat image shows such a crack that keeps growing towards the center.

Segment of Petermann Gletscher from 31 May 2017 LandSat image. Terminus of glacier and sea ice are at top left.
And finally, let’s go back to the ocean temperature record that I show above. Notice the up and down of temperature that in 2017 exceeds the 2016 up and down range. Scientists call this property “variance” which measures how much temperature varies from day-to-day and from hour-to-hour. The average temperature may change in an “orderly” or “stable” or “predictable” ocean along a trend, but the variance stays the same. What I see in 2017 temperatures before breakfast each morning is different. The new state appears more “chaotic” and “unstable.” I do not know what will come next, but such disorderly behavior often happens, when something breaks.
I fear that Petermann is about to break apart … again.


Thanks for the info, Andreas. Truly amazing that we have this temperature data. I’ve re-blogged this on the ASIB.
Any idea if the recent earthquake (4.0?) had any impact on Petermann?
The weak earthquake triggered a landslide that forced a tsunami near 71.5 N latitude. This was a local event that did not propagate far. No tsunami signals reached Thule at 76.5 N latitude which is a far way from Petermann at 81 N latitude. I posted the graph at Neven’s Arctic Sea ice Forum, that is http://forum.arctic-sea-ice.net/index.php/topic,2080.msg117477.html#msg117477
Welcome back, Neven, to the excitement of Arctic science … and thank you for the re-post 😉
We indeed live through crazy time in a crazy world with eyes and sensors everywhere including 800-m below a floating glacier. The automatic daily data download at 08:15 London or 04:15 my time gets me out of bed in the morning and I cannot stop watching this now almost 2-year time series unfold.
Hi Andreas,
There is nothing to fear only something to expect
Andreas,
Wonderful work, your long standing commitment to learning more about the process and cause of the continuing breakup are to be commended. However, as some will already know, I remain convinced that the illustrations provided do not give an accurate picture of what must be a truly massive flow of kinetically heated melt water, emanating from the underside of the grounding line, at the centreline; that must be causing the creation of the central channel.
Is there any way we can get at accurate flow rates at the central channel and to each side of the channel?
Yes, one needs ocean current meters that could connect to the surface via cables the same way that temperature and salinity sensors do right now. It then becomes mostly a question of cost and preparation that we did not have in 2015 as our efforts were funded at $65,000 only after everything had been shipped to Greenland.
The system we have under Petermann Gletscher now was an after-thought of a stubborn scientist who refused to walk away from a good idea after being told three times that his ideas were no good or too expensive.
The costs to install current measuring devices are prohibitive, because they require a ship and helicopters to move the hot water drilling gear into place. [Sweden’s I/B Oden was $150,000/day for >30 days in 2015, but this was excessive.] Helicopters alone will not work, because they need refuelling twice (each way) from the closest airport at Qaanaaq to reach Petermann, but those refuelling station in transit do not exist. If you got a ship or a C-130 military plane to spare, I could put it to good use 😉
The problem here is logistics, not technology.
Thank you, as always, it is the funding that limits our imaginations. However, if another project of mine reaches fulfillment; I just might be able to help; but do not hold your breath.
How do the tides compare with the temperatures. In-flowing water hot (rising tide), out flowing cold (falling tide) is what I would expect. If not roughly correlated then that is very interesting,
Thank you for the fascinating, but disturbing, information and discussion! If the crack does create an iceberg, would it be fair / accurate to say it would be about 50 square miles in size? What would the be cubic volume be? (I started wondering after the Larsen C iceberg broke free on the other side of the world!)?
The ice shelf is about 200-m thick seaward of the large crack.
Despite the admonition to ignore the salinity data, i think there may be something there. For both years, a dip in salinity is often accompanied by a dip in temperature, as one might naively expect. Towand the end of the 2017 data, there is a pronounced dip in both T and salinity. Was that event associated with a meltpond drainage event perhaps ?
There are two water “types” below the ice shelf of Petermann that have characteristic temperature/salinity pairings. Warmer waters are saltier while cooler waters are fresher. The warmer/saltier water contains water of Atlantic origin while the cooler/fresher water contains some meltwater (most likely NOT from surface draining, but circulation below the ice shelf). This is particular clear within about 30-m below the ice shelf, because signal to noise ratios are large there. For more detail on these water mass “flavors,” have a look at
Click to access 29-4_munchow.pdf
Thanks for the reply and the reference. In that paper reference is made to Polar Water. What is the origin of Polar water ?
After consulting Rudels(2002) doi:10.1006/jmsc.2002.1284 I suspect that Polar Water in you paper is Polar Surface water in Rudels ?
Pingback: A major glacier in Greenland might be breaking apart. - MotherNature
Pingback: A major glacier in Greenland might be breaking apart. - Green Products Living.com
Pingback: Antarctic Berg gets News, but Look to Greenland for Real Iceberg Impacts | Climate Denial Crock of the Week
Pingback: What’s happened at Petermann Gletscher since the Industrial Revolution 150 years ago? | Icy Seas