Living off the land, Greenland’s early explorers ate their dogs, fungi, and roots of plants a few inches high to not starve to death. There is nothing romantic in the detailed reports of Knud Rasmussen, Peter Freuchen, and Lauge Koch that mapped in much detail coastlines, glaciers, and fjords of North Greenland between Thule in the west and Independence Fjord in the east. These Danes worked and lived closely with Inuit hunters and their families at what still is the northern edge of where a small number of people can survive by hunting seals, walrus, whales, and polar bears on the ice and musk ox, reindeer, and rabbits on land. Most people did not live as long and as well as we do now, because life and food were always in short supply.

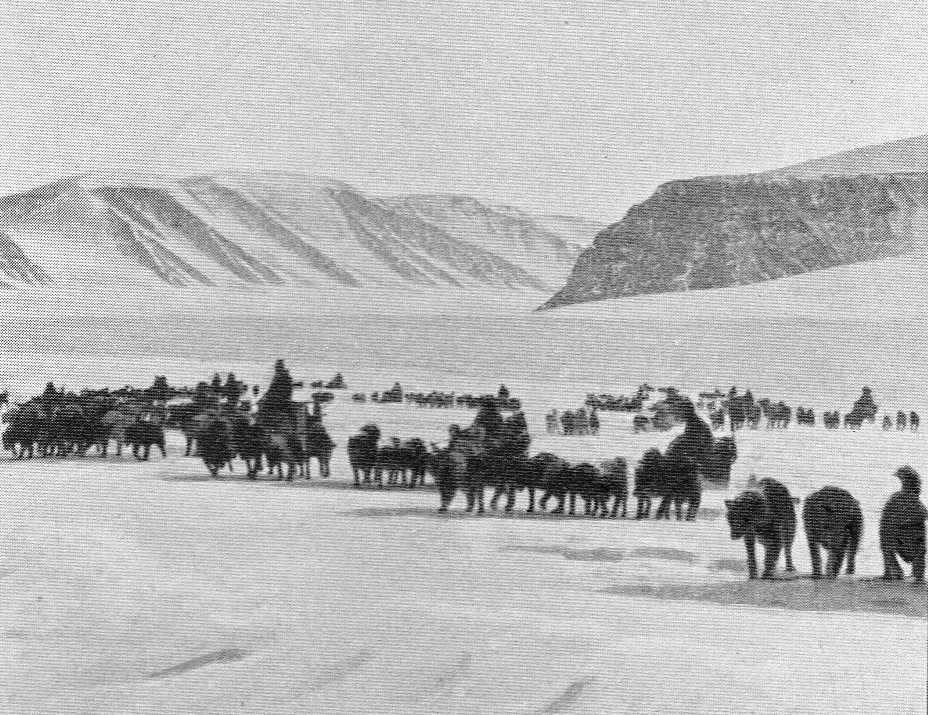
Ascent of the Inland ice in April 1912 as the First Thule Expedition starts from Clemens Markham’s Glacier to Independence Fjord. All 4 explorers returned, but only 8 of the 54 dogs did.
I am reading the reports of the First Thule Expedition of 1912 (4 people), the Second Thule Expedition of 1917 (7 people), and the Bicentenary Jubilee Expedition of 1921 (4 people). Each person had its own dog sled team with 10-14 dogs per team. Knud Rasmussen and Peter Freuchen with Uvdloriaq and Inukitsoq successfully crossed the ice sheet in 1912 from east to west and back. Only 5 of the 7 members of the Second Thule Expedition returned, because Greenlander Hendrik Olsen disappeared while hunting wolves which may have killed him and the Swedish scientist Dr. Thorild Wulff starved to death when he gave up walking as witnessed by Lauge Koch and Inuit Nasaitsordluarsuk and Inukitsoq.

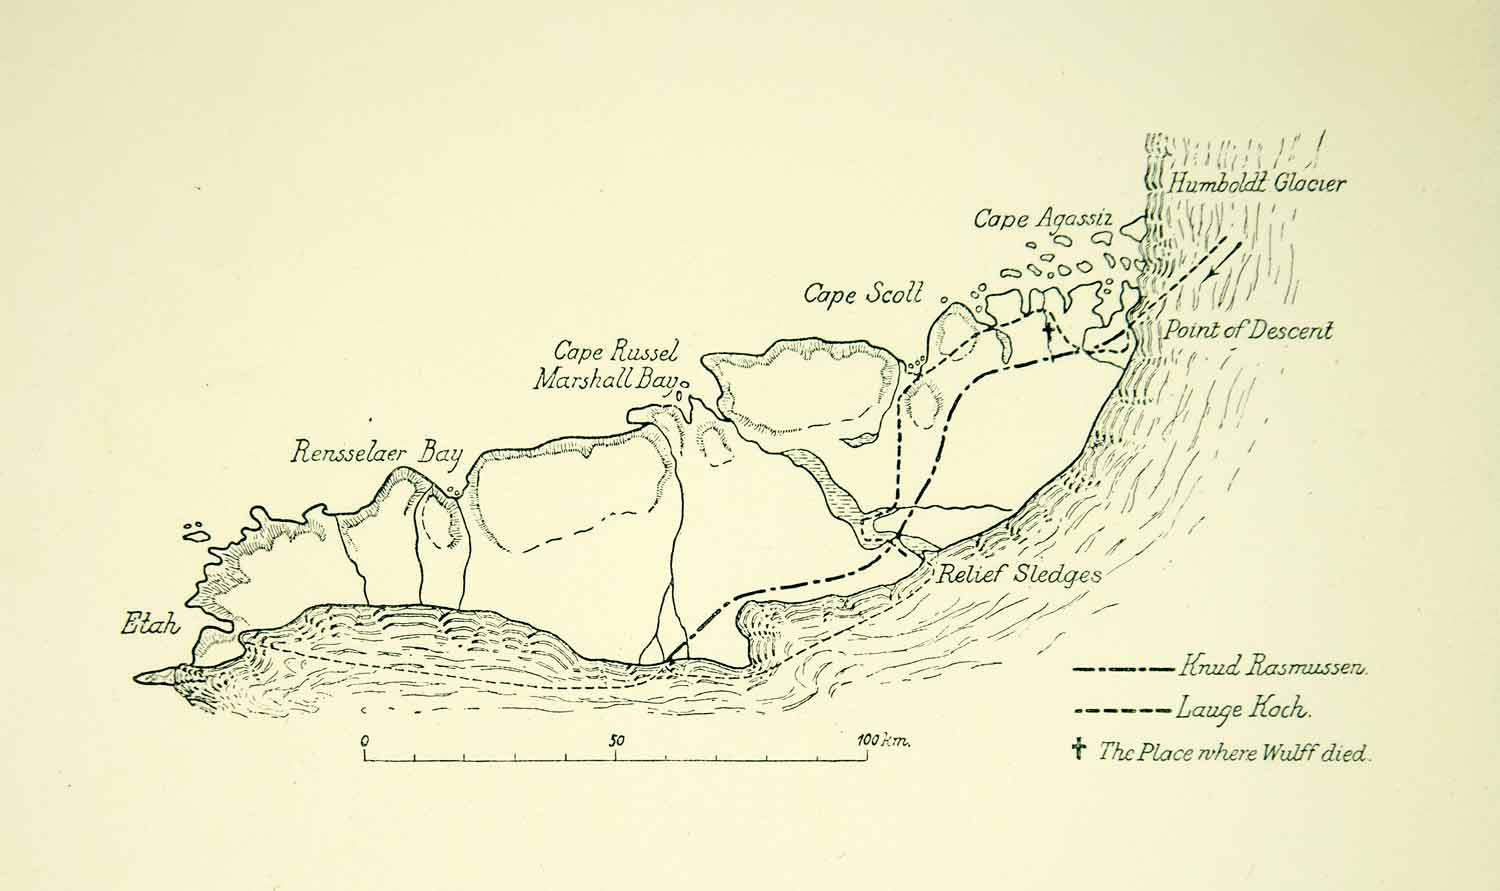
Map detail of northern Inglefield Land with tracks from Second Thule Expedition after leaving the ice sheet with the location of Dr. Wulff’s death. Humboldt Glacier is on the right with Kane Basin to the top. From Rasmussen (1923).
This last death cast a life-long spell on Lauge Koch who never forgave Knud Rasmussen and Peter Freuchen for insisting on a formal Court of Inquiry in local Greenland and not remote Denmark to clear Lauge Koch of any wrong-doing. Both believed that Koch had acted properly when he choose to live and walk and not starve with Wulff, but they felt that local Inuit witnesses and local knowledge in Greenland would make the legal task to clear Koch easier sooner than a more removed Court in Denmark.
![The Freuchen family on a visit to Denmark: Naravana, Pipaluk, Peter, and Mequsaq [Source: Freuchen, P., 1953: Vagrant Viking. Julian Messner Inc., NY, 312 pp.]](https://icyseas.org/wp-content/uploads/2012/07/freuchenfamily.jpg?w=500&h=336)
The Freuchen family on a visit to Denmark: Naravana, Pipaluk, Peter, and Mequsaq [Source: Freuchen, P., 1953: Vagrant Viking. Julian Messner Inc., NY, 312 pp.]
These Danish expeditions represent the second phase of exploration of North Greenland after the quest of national glory to reach the farthest north by British and Americans was settled when Robert Peary claimed to have reached the North Pole in 1909. The many American and English expeditions through Nares Strait from about 1853 (Elisha Kane) had relied on native guides, hunters, and polar skills, but the sheer number of whites and their massive material wealth change both local cultures and wildlife. For example, the early Europeans and American explorers provided guns and new technologies which were traded for furs, clothing, and local knowledge of survival. In return Inuit families provided food, clothing, and native polar technologies. These often proved crucial for survival as demonstrated by Joe Eberling and Hans Hendrik with their families who kept 18 people alive for 6 months in 1873 when their party of British and German men was stranded on an ice floe drifting more than 1800 miles to the south until they were picked up by a whaling ship off Labrador.
After the “Imperial” expeditions ended with the “conquest of the North Pole” in 1909, the local Inuit were left without contact to southern material goods such ammunition for their guns until Knud Rasmussen and Peter Freuchen privately founded the Thule Trading Post in Westenholme Fjord. Their goal was to set up a base to support their aspiration to explore and map northern Greenland via small expeditions and to show a link between Denmark and the people living in what was then called the Thule district of Greenland. Their choice of location was excellent and even today, Thule is still the hub to get to northern Greenland by ship or by air. I traveled through Thule in 2003, 2006, 2007, 2009, 2012, and 2015 as I boarded US, Canadian, or Swedish icebreaker at this only deep water north of the polar circle outside Scandinavia.

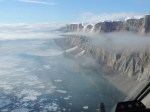
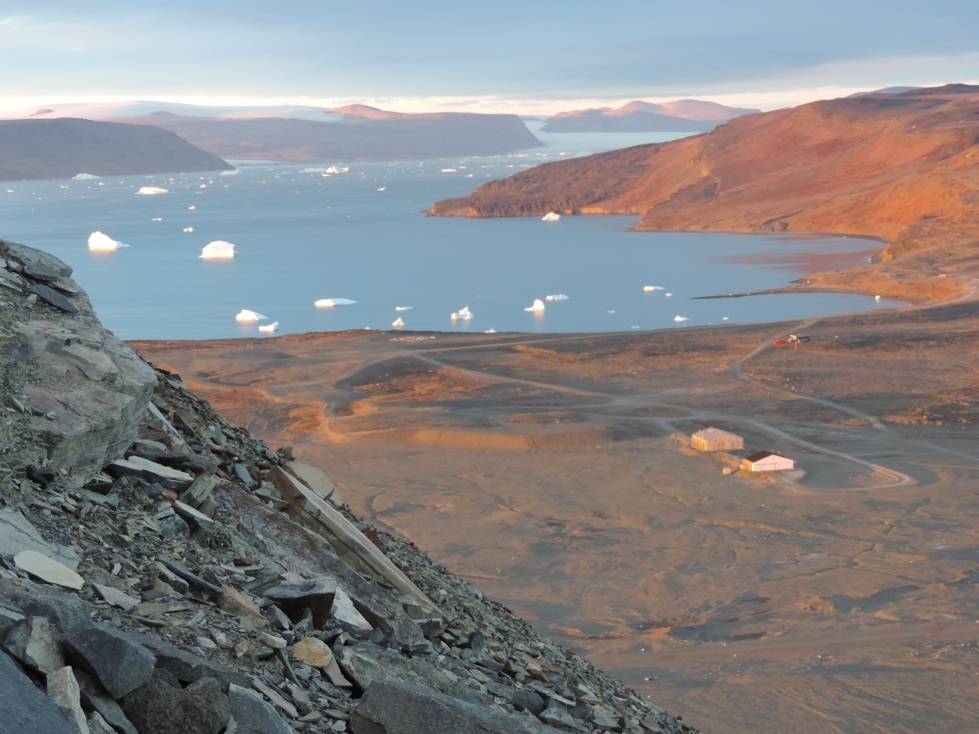
Inner section of Westenholme Fjord to the north-east of Thule AFB as seen on the descent from Dundas Mountain during sunset on Sept.-2, 2015,
Peter Freuchen, Lauge Koch, and Knud Rasmussen were all in their 20ies and 30ies when they traveled across a harsh, unvisited, and at times beautiful landscape. Despite local help, skill, and knowledge to adapt to this environment, Greenland almost killed them by starvation or accident as it did to some of their companions. They all were excellent writers and communicators who found the moneys to pay for their adventures in creative ways. Knud died young in 1933 at age 54 in Copenhagen while Peter buried his Inuit wife Navarana in 1921 when he was only 35 years old, but lived another 36 years. Lauge Koch became an international academic authority on the geology and geography of Greenland until he died at age 72 in 1964. They all lived rich, admired, and controversial lives with their writing, their maps, their loves, and above all their frail humanity.

Maps of North Greenland before (top) and after (bottom) the First and Second Thule Expeditions from Rasmussen (1923).
Freuchen, P., 1953: Vagrant viking, my life and adventures, Julian Messner, Inc. New York, NY, 312 pp.
Hendrik, H, 1878: Memoirs of Hans Hendrik, the Arctic traveler serving under Kane, Hayes, Hall, and Nares 1853-1876, reprinted in Cambridge University Press, Cambridge, UK, 100 pp.
Koch, L., 1926: Report on the Danish Bicentenary Jubilee Expedition north of Greenland 1920-23, 232 pp.
Rasmussen, K., 1912: Report of the First Thule Expedition 1912.
Rasmussen, K., 1923: Greenland by the Polar Sea: The story of the Thule Expedition from Melville Bay to Cape Morris Jesup, Frederick A. Stokes Company, New York, NY, 328 pp.

![Location of Kee Bird and other landing sites in North Greenland near Petermann Gletscher. [From Forum]](https://icyseas.org/wp-content/uploads/2016/09/2014_washingtonland_map.jpg)


![The Freuchen family on a visit to Denmark: Naravana, Pipaluk, Peter, and Mequsaq [Source: Freuchen, P., 1953: Vagrant Viking. Julian Messner Inc., NY, 312 pp.]](https://icyseas.org/wp-content/uploads/2012/07/freuchenfamily.jpg)

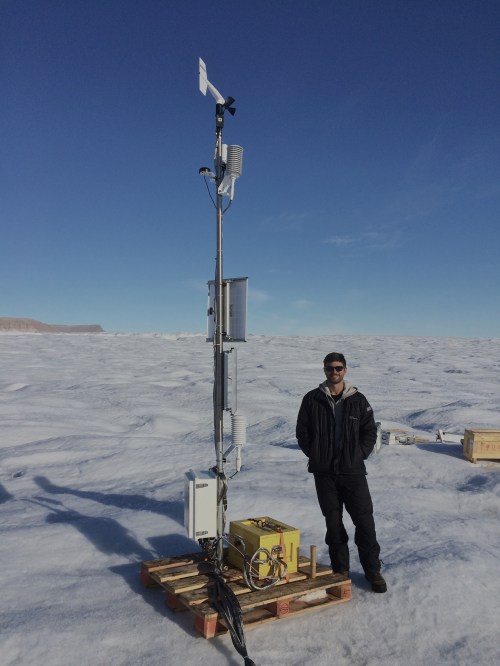


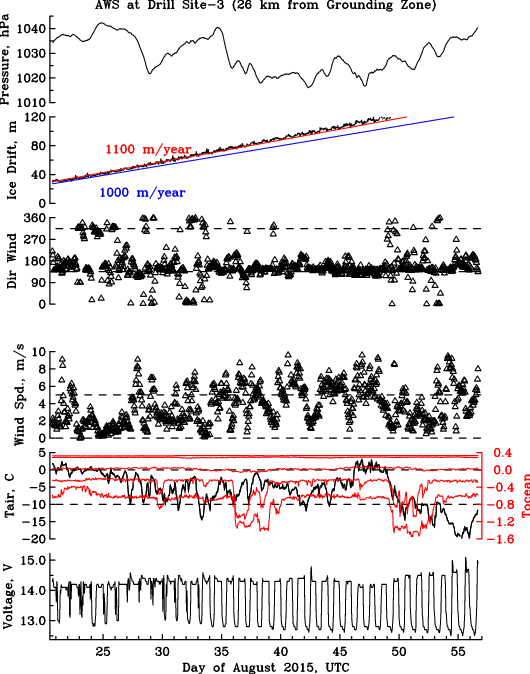
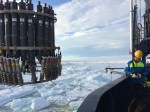
![University of Delaware Ocean-Weather station on Petermann Glacier with the hot-water drilling team UDel and British Antarctic Survey after deployment Aug.-20, 2015 [Credit: Peter Washam, UDel]](https://icyseas.org/wp-content/uploads/2015/09/udel-aows_3052.jpg)