A journalist asked me an unexpected question today:
It seems like you go out on a lot of ships to remote places. Why is that the kind of science that appealed to you?
As a physical oceanographer I indeed spend a lot of time away from home, about 18 months total the last 20 years or so, but here is how I answered the question quickly without too much reflections:
-
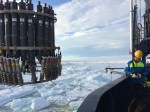
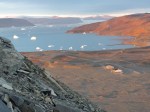
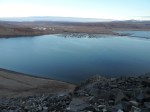
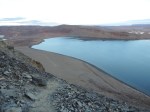
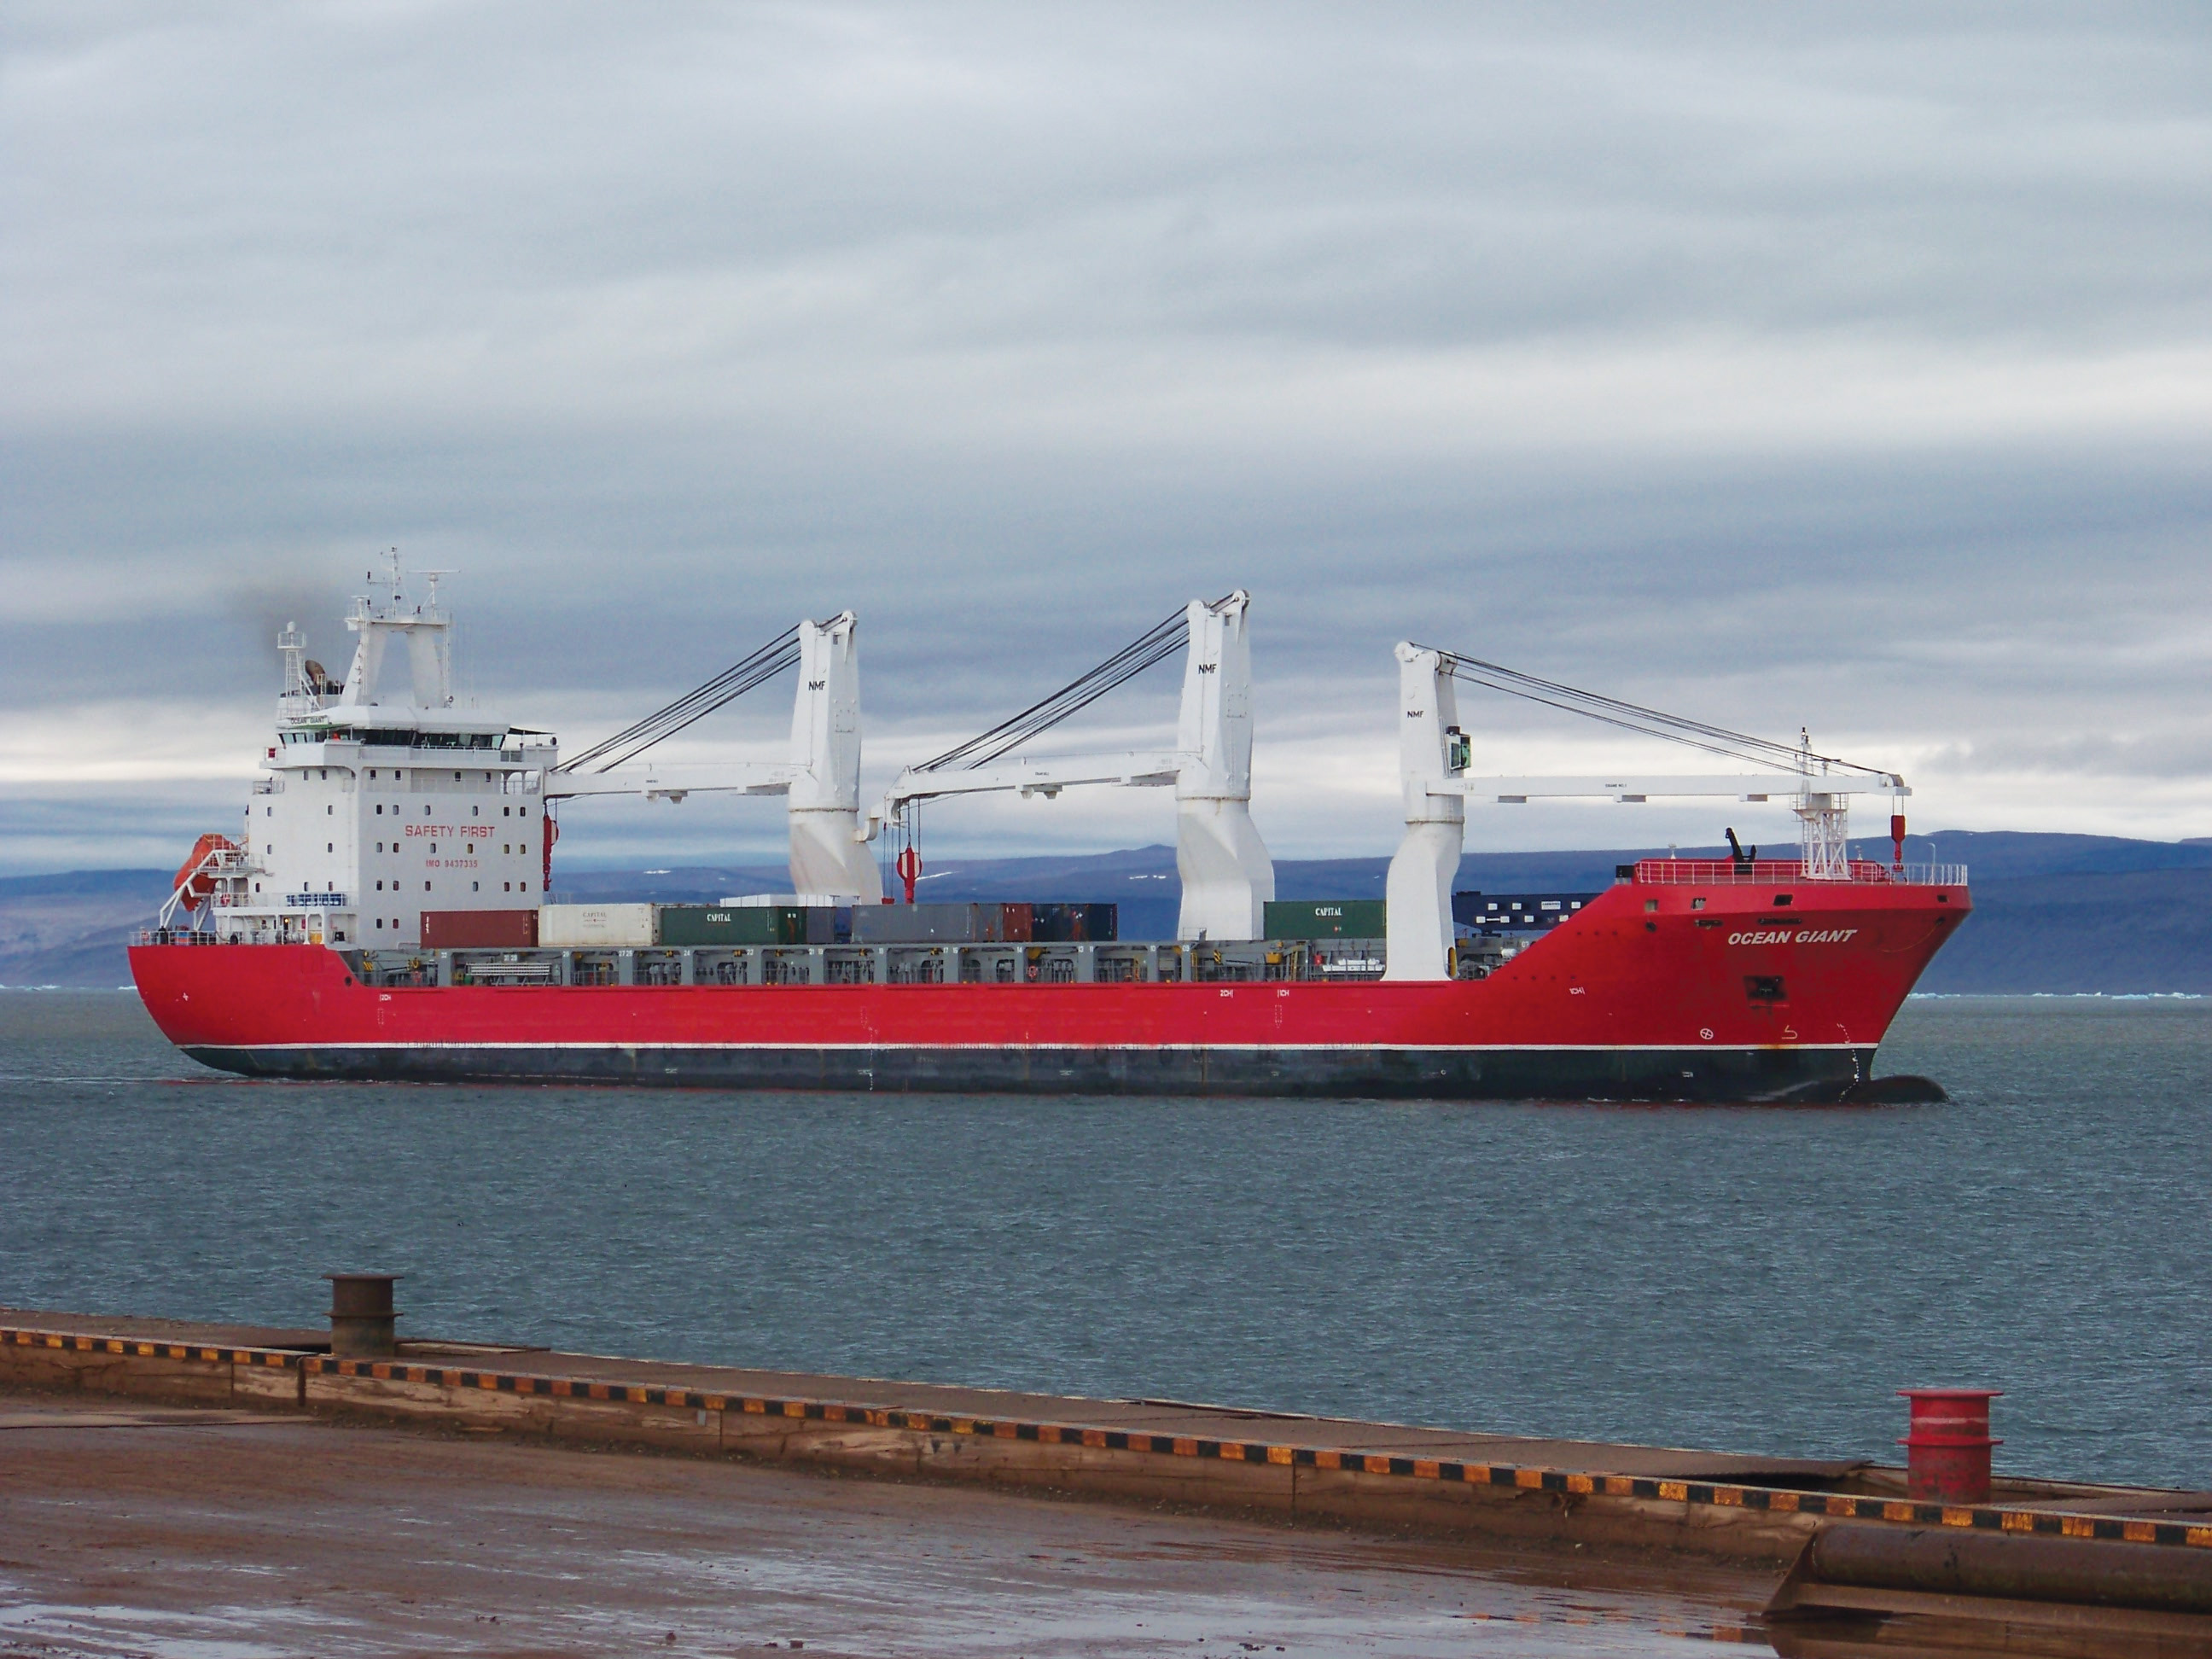
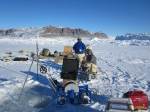
- Calibration of ocean sensors in Hall Basin, North Greenland in 2015 from the Swedish icebreaker I/B Oden.
-
- Working on the sea ice off northern Greenland [Photo credit, Steffen Olsen]
-
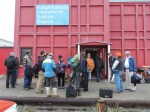
- Science party in transit in Kangerlussuaq in August 2015.
I always collected my own data starting in 1985 as a German undergraduate in Bangor North Wales. I did code a numerical model on tidal wave breaking for my MS thesis, but it was motivated by the very data I collected while camping next to a small tidal river (and pub) for 4 weeks in Wales.
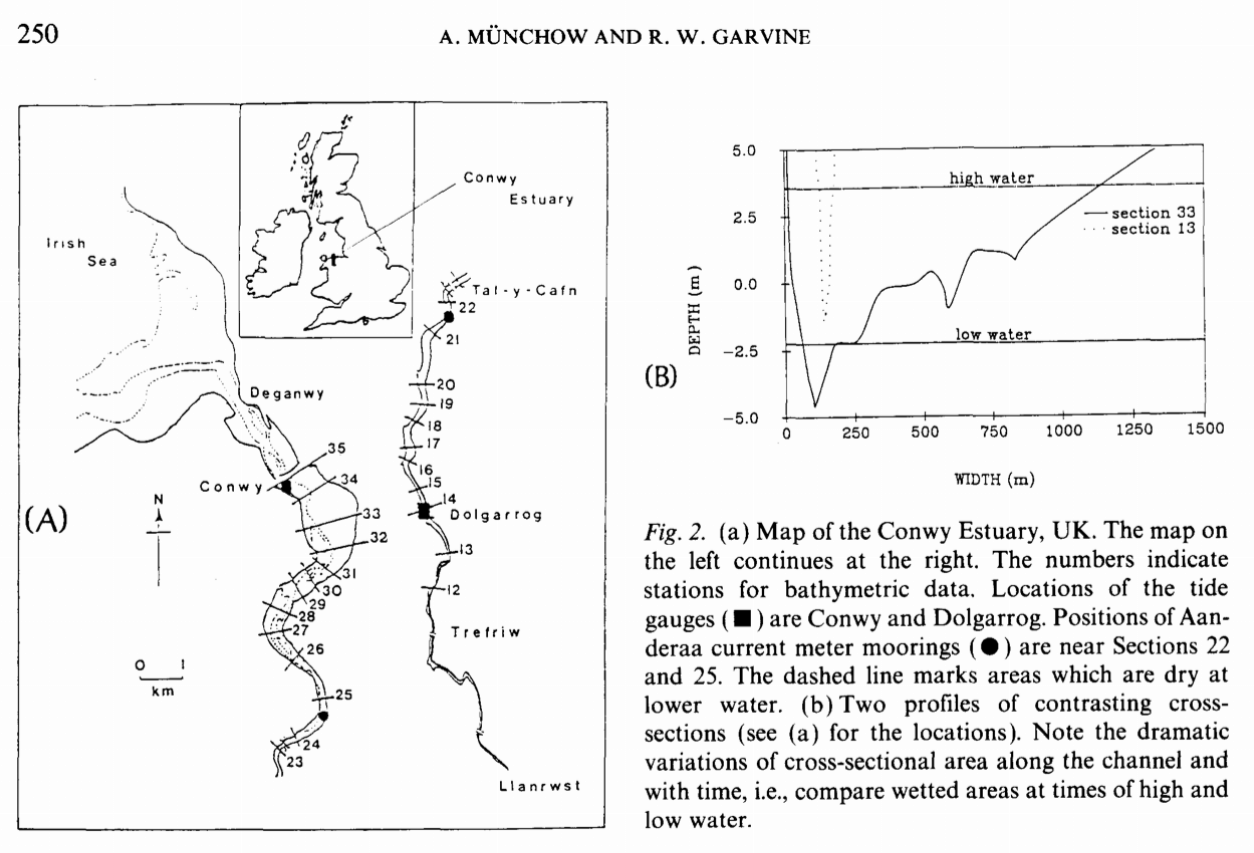
Study location of the Conway Estuary in North Wales from Muenchow and Garvine (1991).
The why never occurred to me, but I was always following opportunities small and large that got me onto a ship both small and large. Perhaps it is the type of people and their many different backgrounds that I felt close to or whose company was just fun. I could never relate to the more cut and dry personalities that one finds in the academic bubbles of academia.
There is also a thrill of probing the ocean in ways or places that nobody has done before which perhaps explains the remote places. Most people consider this hard-ship to be away from friends, family, and the comforts of home. They go once or twice and then stop early in their careers or as students. To me this hardship is pleasure as it always shatters earlier expectations. The only constant, it feels, is change and new insights, this drives me, perhaps I am addicted to it, perhaps I also push and change myself and the field work gives me this chance or opportunity to “reset” and take a new look at what I thought I knew or I knew I did not understand. Again, this is pleasure and the harder it is, the more pleasure I expect.
This is all the time I have now, short version: It is fun to be in the field and work with great people whose greatness – as with the data – will often become clear only later. I know and embrace this.