
I go to sea to learn about oceans, glaciers, weather, and climate. Despite dramatic photos of exciting field work, those action-packed scenes or serene nature shots of beauty and violence are misleading. Most of my time is spent sitting an a desk in a spacious office with books, papers, telephone, and most important of all, my computers.
-

- Selfie at my office desk
-

- Books and expedition notes.
-

- Corner of my office desk.
Most of my time is spent writing. The writing is varied and ranges from illustrated essays on IcySeas.org to computer code. Add technical writing of research proposals, papers, and reviews for funding agencies and scientific journals. My screen rarely looks like what is shown above with the beautiful LandSat image of 79N Glacier as a screen-saver, it actually looks like this

The blog-writing window is open on the right while a Fortran computer code is in the top left. The code processes temperature, salinity, and pressure data from Petermann Glacier. When the code is run in the bottom-left window, it produces numbers. In this specific case, the numbers are from the only profile of temperature and salinity that exists from Petermann Glacier. Koni Steffen collected the data in 2002. Columns are depths that start at -68 (meters), salinity at 33.774 (no units, think of this as grams per kilogram), temperature at -1.885 (degrees centigrade), and the last column is the density anomaly These numbers are better presented as a graph:
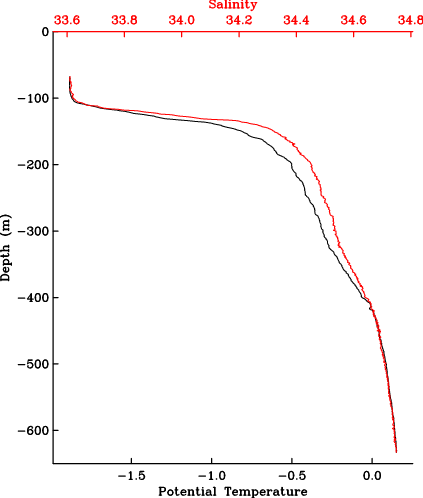
Notice that temperature and salinity start only at -68 meters. This is because the ice at this location was about 68-m thick. The Big Ben clock in London is about 96-m high, but this piece if Petermann was chosen because it was less hard to drill through 2/3 of Big Ben’s height when compared to drilling through the glacier ice a mile away where the ice is thicker than the Empire State Building in New York; but I digress.
The profile above reveals a pattern we find almost anywhere in deeper Arctic Waters: Temperature increases with depth. Under the ice at 68-m depth, water is at its freezing point. As you move down the water towards the bottom, salinity increases and so does temperature. It is still cold, about +0.2 degrees Celsius, but this is heat from the North Atlantic Ocean that for perhaps 20-50 years circled all the way around the Arctic Ocean from northern Norway, past Siberia, past Alaska, past Canada to reach this spot of Greenland. While this appears marvelous, and it is, this is NOT what gets a physical oceanographer excited, but this does:
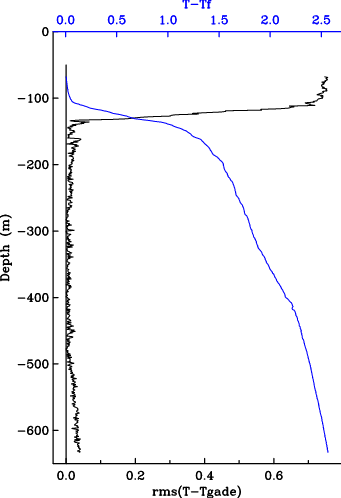
It is the same data, but I did some reading, physics, algebra and code-writing in that order. First, instead of temperature, the blue line shows the difference between temperature T and the temperature Tf above the freezing. The difference T-Tf relates to the amount of heat available to melt the ice somewhere. The black line is the real killer, though. It combines salinity and temperature observations to reveal where the glacier water resides at this location that was melted somewhere else. Without going into the physical details, glacier meltwater is present where the black line touches zero (the so-called Gade-line, so named after a Swedish oceanographer who proposed its use in 1979). This happens at a depth from about 280-m to 500-m depth. This means that the glacier is NOT melting where it is as thin as Big Ben, but instead where it is as thick as the Empire State Building. So this is where we will need to place our instruments.


Proving my initial point, I spent two hours of fun writing this blog. I now will have to focus on more technical writing to pay the many bills of sea-going research. These “lab-notes” also serve as a document to raise $10,845 to install instruments this summer through Petermann Gletscher, have a look and give a little, if you can at
https://experiment.com/projects/ocean-warming-under-a-greenland-glacier


Thanks for all the work you do.
In a lighter vein, that fortran code looks, dare i say it, almost disciplined (insofar as fortran can be disciplined …)
I was weaned in the bloody minded days when and IMPLICIT INTEGER I-N was followed by IMPLICIT REAL A-H,O-Z, and this was hotly contested by those who stoutly maintained that only I and J were the only integers and DOUBLE was probably a communist plot. COMPLEX DOUBLE was a heresy yet unborn. Creative use of COMMON usually followed shortly thereafter and a giant block of constructs such as PI=4.0D0*DATAN(1.0D0) for those pioneers who had double precision …
that said, my fortran code today regularly outperforms equivalently tuned c code by roughly an order of mag in crunching applications, and MPI libraries in fortran on a beowulf are far ahead of competion. Compilers can make so many nice assumptions when you give em the -f77 option, altho i must say the intel fortran compilers on intel hardware like Xeon seems to know to do the right thing when it sees f77 code without having to tell it …
sidd
Sidd: Yes, this is code I wrote a few weeks ago does simple algebra on a 1-D array, but it uses fancy and modern subroutines (not shown) that took years of efforts by Australians, I think, to write.
In physical oceanography, meteorology, and the harder quantitative climate sciences, Fortran is the code of choice and habit for reasons of efficiency. Most general circulation models (set of partial differential equations with variables that vary in space-time) are written in Fortran as linked programs that contain millions of lines of code. These solve the nonlinear Navier-Stokes equation that predict and project weather and climate in the atmosphere, the ocean, and the coupled ice-ocean-atmosphere.
And I love the look on the faces of my students, when I ask them to calculate the eigenvectors of the cross-correlation matrix for 3-year timeseries of velocity vectors (50,000 points in time) at 120 locations (space, section across Nares Strait). MatLab comes to a screeching halt and is not done after a day or so while Fortran is finished within a few seconds. Fun!
Andreas
I think one reason for fortran being dominant in numerical work is the vast corpus of routines which are not only efficient and well debugged, but also that the _failure modes are very well understood_ so that one knows exactly when not to use them …
sidd
Pingback: Sweden’s Icebreaker for Petermann Gletscher 2015 | Icy Seas