
Our minds travel easier than the body. My eyes have never seen East Greenland, but I moved across its white glaciers, turquoise streams, green valleys, and black oceans many times. Reading expedition reports of Peter Freuchen from 1912, I feel north-east Greenland as he climbs with 3 companions and about 50 dogs down an icy cliff from the lifeless desert of the inland ice to the more fertile coastal plains. They are hungry and depend on the sparse vegetation that supports the musk ox, fox, and rabbit that they must hunt to eat.
-

- Muskox skull on fertile feeding grounds of North Greenland.
-

- Grass and caribou antlers on a fertile coastal plain of North Greenland in summer.
-

- Sparse vegetation (purple sassofraxe) on the shores of Bliss Bay, North Greenland.
Photo credits go to travelers dedicated to reach the northernmost parts of Greenland that they call Arctic Thule.
There is more to my mental voyages than fingers on maps, photos, and worn reports. The physical scientist in me thirsts for observations to answer nagging questions on if and why and how the physical world is the way that we think we see it. For this I probe the air, the ice, and the oceans in ways that are not visible to the naked eye. I dislike traveling on a fixed surface that is defined by where I stand. The darkness of the unknown attracts me. What is below the pink pebble on the beach? What is beyond the horizon? How did stone and ice get here? Where will it all go next? These are the questions that drive me … today to North-East Greenland where two large glaciers flow eastward into a coastal ocean as they have not yet carved a fjord the way that the westward flowing Petermann Glacier has done on the other, western side of Greenland.
![Map of North-East Greenland [From: Bennike and Weidick, 1999, Geology of Greenland Survey Bulletin, 183, 57-60.]](https://icyseas.org/wp-content/uploads/2013/06/gsb183.png)
Map of North-East Greenland [From: Bennike and Weidick, 1999, Geology of Greenland Survey Bulletin, 183, 57-60.]
My travels started on a train to Boston to meet fellow coastal oceanographers in Biddefort, Maine. On friday an eminent German oceanographer and fellow gardener asked me a simple question on what is ice, what is land, and what is glacier on a fuzzy small paper copy of the area shown both above and below. In the satellite imagery below the black tones represent open water, the bright whites represent ice caps at high altitude, and the grey represents either land or diffuse mobile sea ice. The land comes into sharper focus in the image from 2009 as almost all sea-ice is frozen into one single sheet of ice that does not move, it is called land-fast ice and is distinct from glaciers, but that is harder to see. The two images also show the range of sea ice cover at the height of summer: Sept.-1, 2002 represents minimal and Sept.-1, 2009 represents maximal ice cover. Looking at over 30 years of satellite data from this area, I find lots of variations from year to year, but no trend that stands out from above the natural noise. I digress … maybe.

.

Now why is the ice cover so different from one year to the next? As a physical oceanographer my first two instincts are to get data of the bottom depth of the ocean and to get a feel for what the ocean temperature and salinity in the ocean looks like. These two pieces to a larger puzzle help me to say something about ocean circulation and heating. So, here is what the topography above and below sea level looks like:
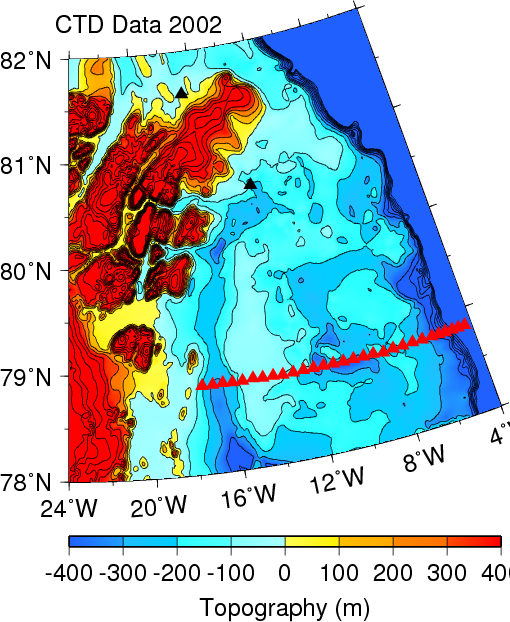
Map of North-East Greenland showing land elevations in red and yellow and bottom depths in blue. Data are from IBCAO-2 and contoured in 100-m intervals. Black triangles indicate locations of weather stations at Station Nord and Henrik Kroeyer Island with records longer than 25 years.
For scale, the map shows an area that would fit Boston near the top in the north and Washington, DC near the bottom in the south. Using the fasted trains in the US of America, it takes almost 7 hours and costs $250 one-way. Notice that there is a deeper trough that circles from the south past both glaciers to the west towards the north-east. This trough feeds the glaciers with warmer waters as it cuts off a shallower bank (my students both called it a sandbar) to the east. We will next have a vertical look at a vertical slice from the deeper waters in the east, to the shoal in the middle, and on to the trough in the west along the line of red triangles. The data along this section were collected by the German research icebreaker PolarStern which visited this part of Greenland in 2002. Along the section it collected profiles of ocean temperature, salinity, and much more:
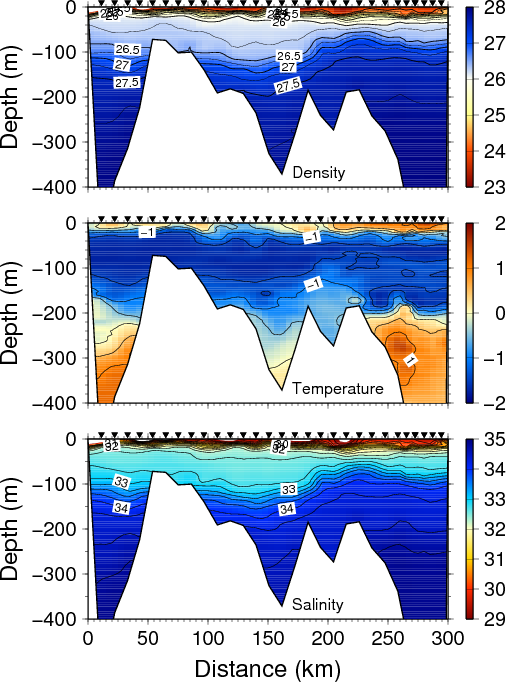
Section of density (top), temperature (middle), and salinity (bottom) across the shelf off North-East Greenland in the summer of 2002. The view is to the north with Greenland on the left (west) and the deep Fram Strait to the right (east). Symbols indicate station locations. White areas indicate bottom topography.
The warmest waters in the section we find at 300 m depth both offshore in the east and in the deep trough in the west. These warm waters are also dense because they are salty. Based on the known bottom depth, it is not clear how this dense but warm water gets into the fjord where the floating glacier contacts the bed-rock and ocean near 700 m depth some 80 km landward of its terminus. It is possible that the bottom depths have not all been charted in enough detail to connect the warmer deep ocean waters with the glacier. We can safely ignore the warm and fresh waters within about 30-40 meters of the surface as they are merely melted sea-ice heated by 24 hours of sunlight. This layer is of little importance with regard to the adjacent glaciers.
An easy-to-miss, but revealing tidbit of substance in these data are the sloping lines of density: As we move from km-150 to km-200 we find that both salinity and density slope upward from about 150-m depth to 100-m depth. Such slopes often indicate currents, but to “see” this, one needs training in ocean physics on a rotating earth. Nevertheless, the more upward slope we observe, the more southward flow we can infer. The situation is reversed in the trough next to the coast. Here we find a downward slope of density as we move from km-0 to km-40. The inferred (geostrophic) ocean current with this slope is from south to north. It is this current that is postulated to drive the warm waters towards the glacier within this trough. Putting these two currents together, we find a clock-wise circulation around the shallow submarine bank. I will want to be more precise on how strong these currents are and how they vary from year to year and how the strength of these currents perhaps also relates the ice cover, but this cannot all be done tonight.
So let me conclude my virtual voyage of arm-chair discovery with a HUGE thank you to all those scientists and governments that put their data online for ANYONE to use as they see fit. ALL data presented in this post I found on the internet from very reputable sources such as IBCAO (bottom depth), NASA (satellite imagery), Danish Meteorological Institute (weather stations), and the German Alfred-Wegener Institute (ocean temperature and salinity). There is more to discover, ways to travel, and stories to be told. The mind controls the body or so we wish.
Budéus, G., & Schneider, W. (1995). On the hydrography of the Northeast Water Polynya Journal of Geophysical Research, 100 (C3) DOI: 10.1029/94JC02024
Falck, E. (2001). Contribution of waters of Atlantic and Pacific origin in the Northeast Water Polynya Polar Research, 20 (2) DOI: 10.3402/polar.v20i2.6517
Hughes, N., Wilkinson, J., & Wadhams, P. (2011). Multi-satellite sensor analysis of fast-ice development in the Norske Øer Ice Barrier, northeast Greenland Annals of Glaciology, 52 (57), 151-160 DOI: 10.3189/172756411795931633
Reeh, N., Thomsen, H., Higgins, A., & Weidick, A. (2001). Sea ice and the stability of north and northeast Greenland floating glaciers Annals of Glaciology, 33 (1), 474-480 DOI: 10.3189/172756401781818554
Wadhams, P., Wilkinson, J., & McPhail, S. (2006). A new view of the underside of Arctic sea ice Geophysical Research Letters, 33 (4) DOI: 10.1029/2005GL025131


Until someone proves conclusively otherwise; I will remain convinced that there is insufficient understanding of the true potential energy contained within a single drop of melt water at the surface of an ice sheet above sea level.
That the kinetic energy of that drop of water, imparted to the ice column as it drops, millimetre by millimetre, through the ice to reach sea level; is the primary source of the warmer water, presently attributed to be melting the underside of the Glacial Ice Shelves.
That the warm water is the melt water; from the glacier itself; rather than from another source, such as warm water at depth.
I do not think this is so, but if what you say is true, then how do you explain that the warm water under the ice sheets of Greenland and Antarctica get so salty? Both salinity, temperature, and a number of conservative chemical tracers all strongly suggest that the warm waters, such as shown in the section in my post, originates from the Atlantic Ocean after lots of circulation on decadal time scales.
This is not so say that there is no kinetic energy in the melt water that rushes down towards sea level, but how much of this kinetic energy is lost to friction carving a massive piping system under the glaciers near the bedrock?
“then how do you explain that the warm water under the ice sheets of Greenland and Antarctica get so salty? ”
Kinetically heated warm debris dragged down with the melt flow falling to the bottom causing deep water to rise and interact with the melt water flow will surely cause a rotating water column to “Rotor” warmer, saltier water from the deeper levels. Perhaps someone will see if they can model such a flow?
Hi Andreas,
I am surprised with the fact that the tongues of both Nioghalvfjerdsbræ (79) and Zachariae Isstrøm is resting on land above sea level, south and north of Lambert Land. But not surprised with the shallow water of Belgiske Banke.
The ice tongue of Niogshalvfjerdsfjorden is not on land (not so sure on Zachariae), but many data bases show the surface, not the base of glaciers. So the yellow area of Nioghalvfjerdsbrae with elevations in the 0-100 meters is the top of the glacier floating on the ocean. Reeh et al. (2001) and NASA’s Operation IceBridge provide details on the shape.
Furthermore, the ocean bottom is often poorly charted near Greenland’s outlet glaciers and critical sill depth are not always known or adequately supported by measurements.
Andreas
Another wonderful post!
I think that the Belgica Gyre is rotating in a clockwise direction with a period of ~ 3 years though I don’t seem to be able to locate the reference. If the 3 years is correct would the lag time be discernible from salinity profiles?
I’m sure you’re already familiar with the following paper, but would be interested in any comment you might have re. the following quote.
“The question remains as to whether the NØIB can act as
an indicator of climate conditions. Certainly if the fast ice
were to disappear and be replaced by EGC drift ice in
winter, this would indicate a severe change in environmental conditions on the Belgica Bank area, with consequences for the coastal ecosystems of the area. Fortunately there appears to be little sign that this is likely to occur.”
[Hughes et al. (2011)]
Terry
I’ll have to track down the 3-year time scale that you mention for the clockwise circulation around Belgica Bank. Looking at the 1979-2011 SSM/I record of ice cover for this specific area, I agree with the quote from Hughes et al. (2011). There is a small decrease in the local ice area in summer, but the interannual variations of summer ice cover are so large (with an apparent 3-5 year oscillation), that the trend is no different from zero within the usual error bars.
This is different from almost all other areas in the Arctic, but the physics of land-fast ice off North-East Greenland are probably similar to the physics that determine if and when an ice-arch forms or collapses. Comparing Nares Strait to this area, I speculate that islands and ice islands grounded on Belgica Bank provide enough structural support long enough to hold the sea ice in place in most, but not all years.
There is more to this and a smart undergraduate student works with me this summer with to look at this in more detail. So, fun work in progress 😉
Our inquistiveness nature were on the same plane this week. I also was examining the Nioghalvfjerdsbræ (79) Glacier The surface of it anyway.
We make a good team … and thank you so much for the link, very neat imagery and interpretations.
Andreas , thank you for your blog – I have travelled to Antarctica recently and as a result am currently painting a series of works of icebergs and sea ice for a show coming up in November in Melbourne, Australia.
Can you refer me to research focussing on Antarctic icebergs, something about the life span of an iceberg, and krill populations beneath icebergs.
Would appreciate any ideas (I am also contacting the Australian Antarctic Division).
Thanks Laura
Pingback: Ocean Circulation and Melting Glaciers off North-East Greenland | Icy Seas
Pingback: Coastal Oceanography off North-East Greenland | Icy Seas
Pingback: How big is Greenland? | Icy Seas