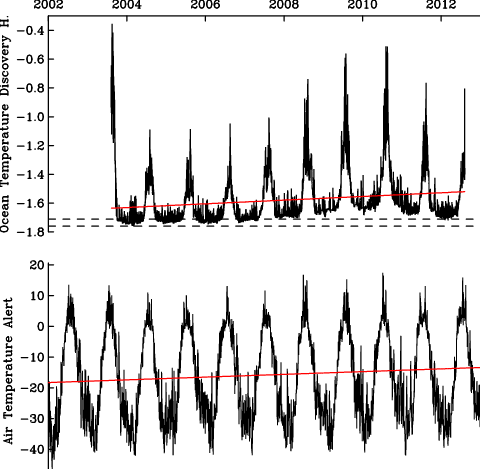
Greenland is melting, but it is not entire clear why. Yes, air temperatures continue to increase, but what does it matter, if those temperatures are below freezing most of the time. What if the ocean does most of the melting a few 100 m below the surface rather than the air above? It means that gut feeling and everyday experience can be poor guides for science, it means that there is more than meets the eye, and it means that some of Greenland’s melting happens out of sight without the dramatic imagery of a rapidly disintegrating glacier that sends icebergs out to sea.
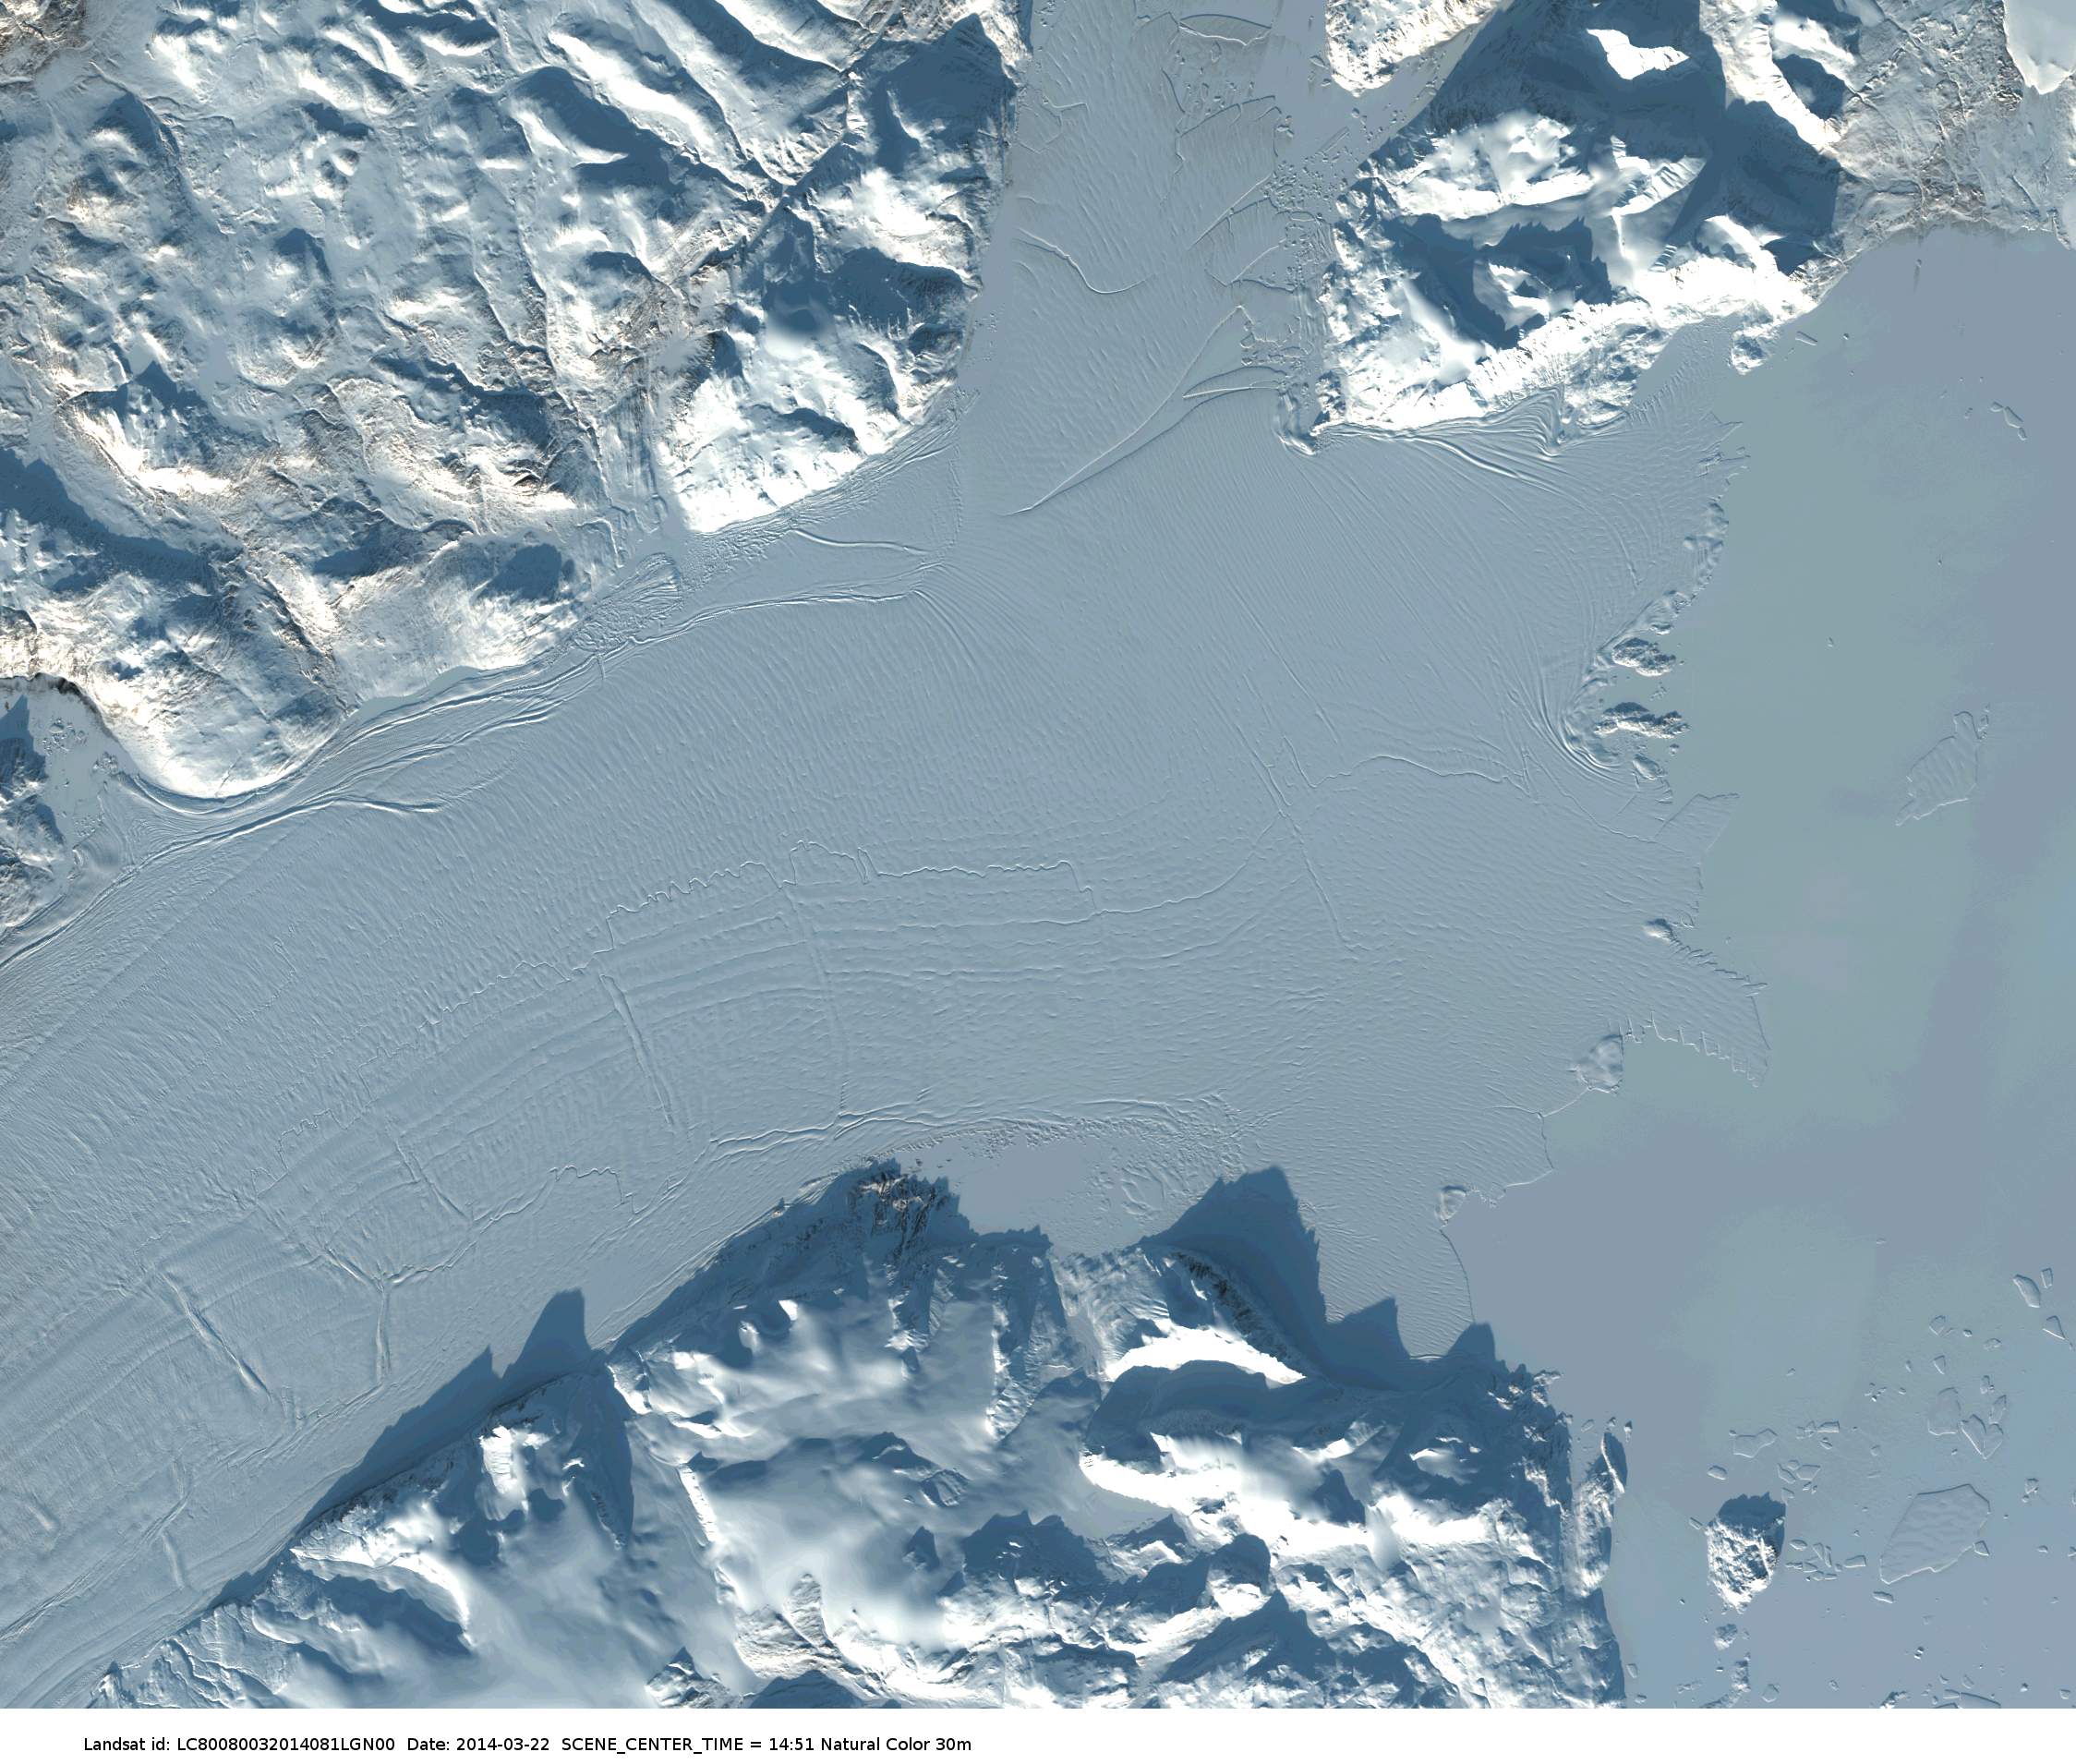
Floating section of 79N Glacier in north-east Greenland as seen from LandSat in march 2014.
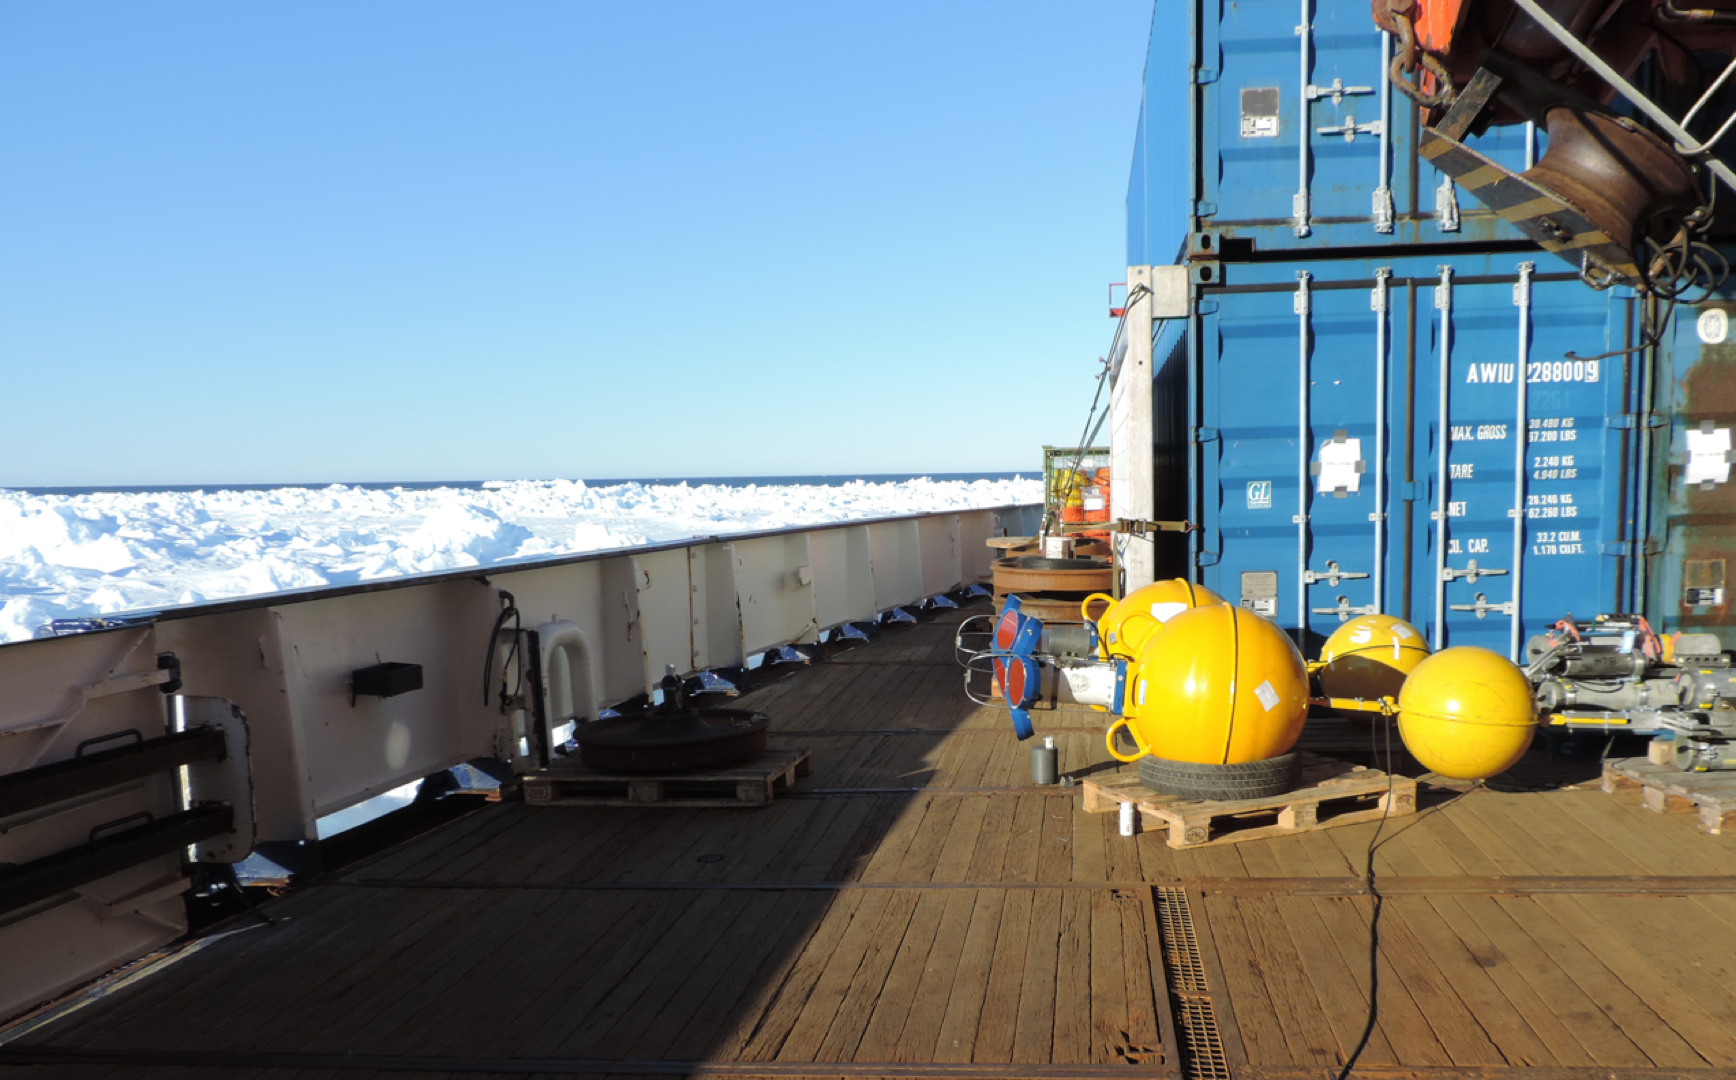
In order to “see” where changes may happen out of sight American tax payers supported me via the National Science Foundation (NSF) to use available University of Delaware ocean sensors from an available German ship to investigate the ocean near two large glaciers off north-east Greenland. The sensors are in the water for over a year now and will stay there for another to collect data every half hour. The data are stored on computers inside the sensors and it is a marvel of smart engineering that we can measure water temperature, salinity, and velocity at the bottom of an ice-covered ocean. Now what would I do with such data?
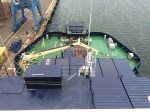
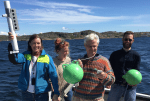
Two ocean sensor packages ready for deployment near Isle de France, Greenland 10 June 2014.
First, one needs to know that in the Arctic Ocean temperature increases as one moves a thermometer from the surface towards the bottom for the first 900 feet or 300 meters. This only make sense, if the warm water is heavier than the cold water above. This is the case in the Arctic, because the warm water at depth is also very salty. The cold waters above contain less salt and that’s why they float. The warmest waters originate from the Atlantic Ocean to the south-east of Iceland. Lets call it Atlantic Water for this reason. The surface waters contain sea ice and its fresh melt water and thus are always close to the freezing point, so lets call them Polar Waters.
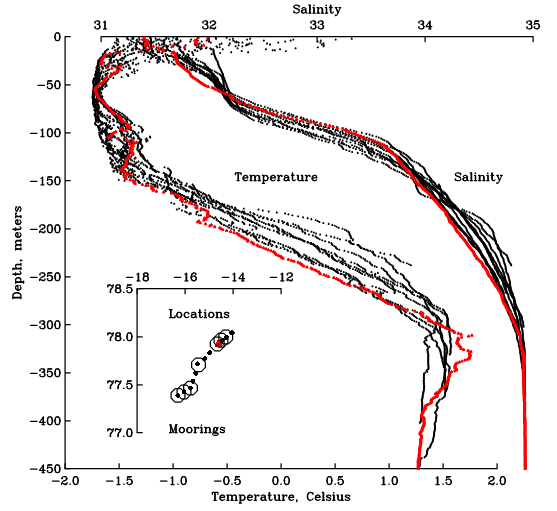
Vertical profiles of temperature and salinity across Norske Ore Trough, Greenland. The insert shows station locations for profiles (small symbols) and moorings (large circles). The red dot marks the location of the red profile.
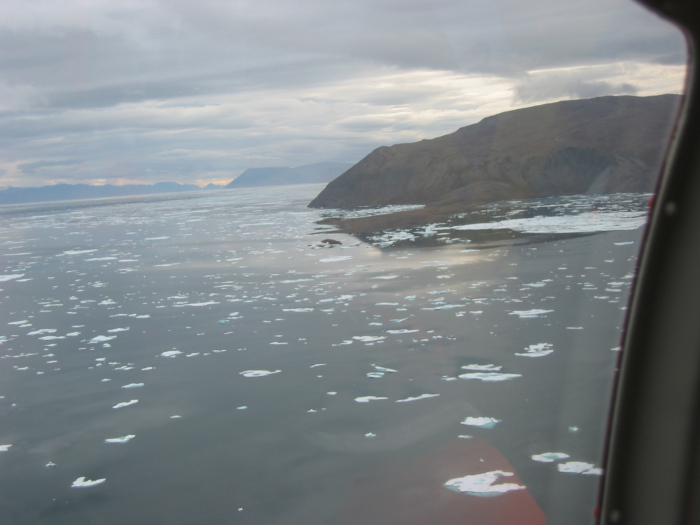
All along the East Coast of Greenland, we find a strong southward flow of ice and Polar Water called the East Greenland Current. On a rare clear day one can “see” this flow as a beautifully structured undulating band separating the deep Greenland Sea from the shallow and broad continental shelves. Now recall that the warmest waters are in the Atlantic layer way down and somewhat offshore. How do these waters cross the East Greenland current and the very wide continental shelf to reach the glaciers along the coast? It is this question my project tries to answer with lots of help from NSF and German friends.
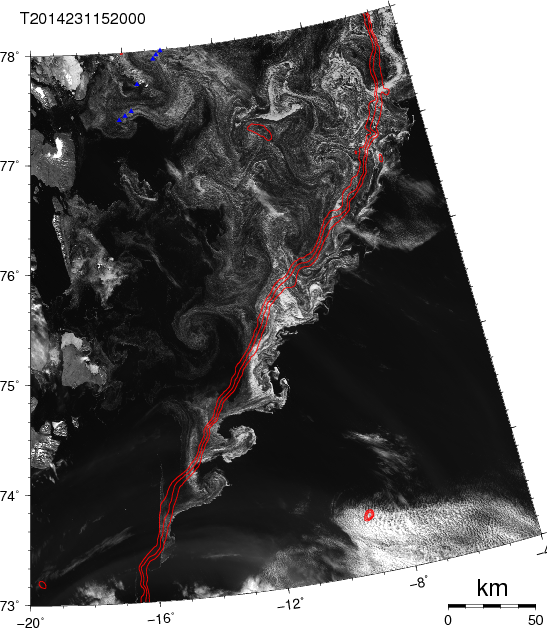
Satellite image ocean current instabilities on Aug.-19, 2014 as traced by ice along the the shelf break, red lines show 500, 750, and 1000 meter water depth. Small blue triangles top left are ocean moorings.
We think that the warm and salty waters flow near the bottom below the East Greenland Current at deep bottom depressions such as canyons. Testing this idea, we placed our sensors in a line across the canyon with a small ice-capped island called the Isle of France on one side and Belgica Bank on the other. We deployed seven instrument as an array across the canyon to measure the speed and direction of the flow as well as its temperatures and salinities. Our canyon connects the deep Greenland Sea 150 miles to the east with two glaciers another 100 miles to the north-west. We all anxiously hope that no iceberg wiped out bottom moorings and that they all record data faithfully until the summer of 2016 when we plan to recover instruments and data.
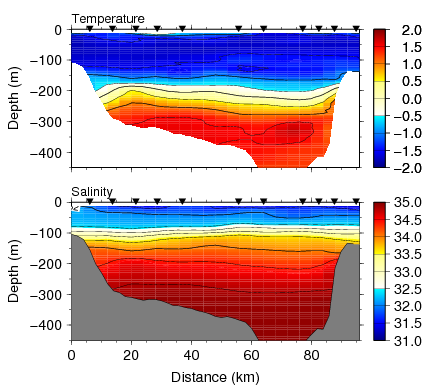
Section of temperature across Norske Ore Trough with Isle de France, Greenland on the left and Belgica Bank towards Fram Strait on the right. The view is towards 79N Glacier.
Before and after the placement of our moored instruments, however, we did survey the section from the ship and I show the temperature and salinity across our canyon. We now see that the water below 200 m depth are indeed very warm and salty as expected, but there is a detail that I cannot yet explain: notice the slight upward sloping contours of salinity near km-80 at the rim of the canyon and the downward sloping contours on the other side near km-10. Such sloping contours represent a flow out of the page at km-80 and into the page at km-10 which is exactly the opposite of what I expected. All I can say at the moment is that this snapshot does not resolve motions caused by the tides, the winds, and the seasonal cycles properly, but our moorings do. So, there are still mysteries to be solved by the data sitting on the bottom of the ocean guarded by towering spectacles of ice.
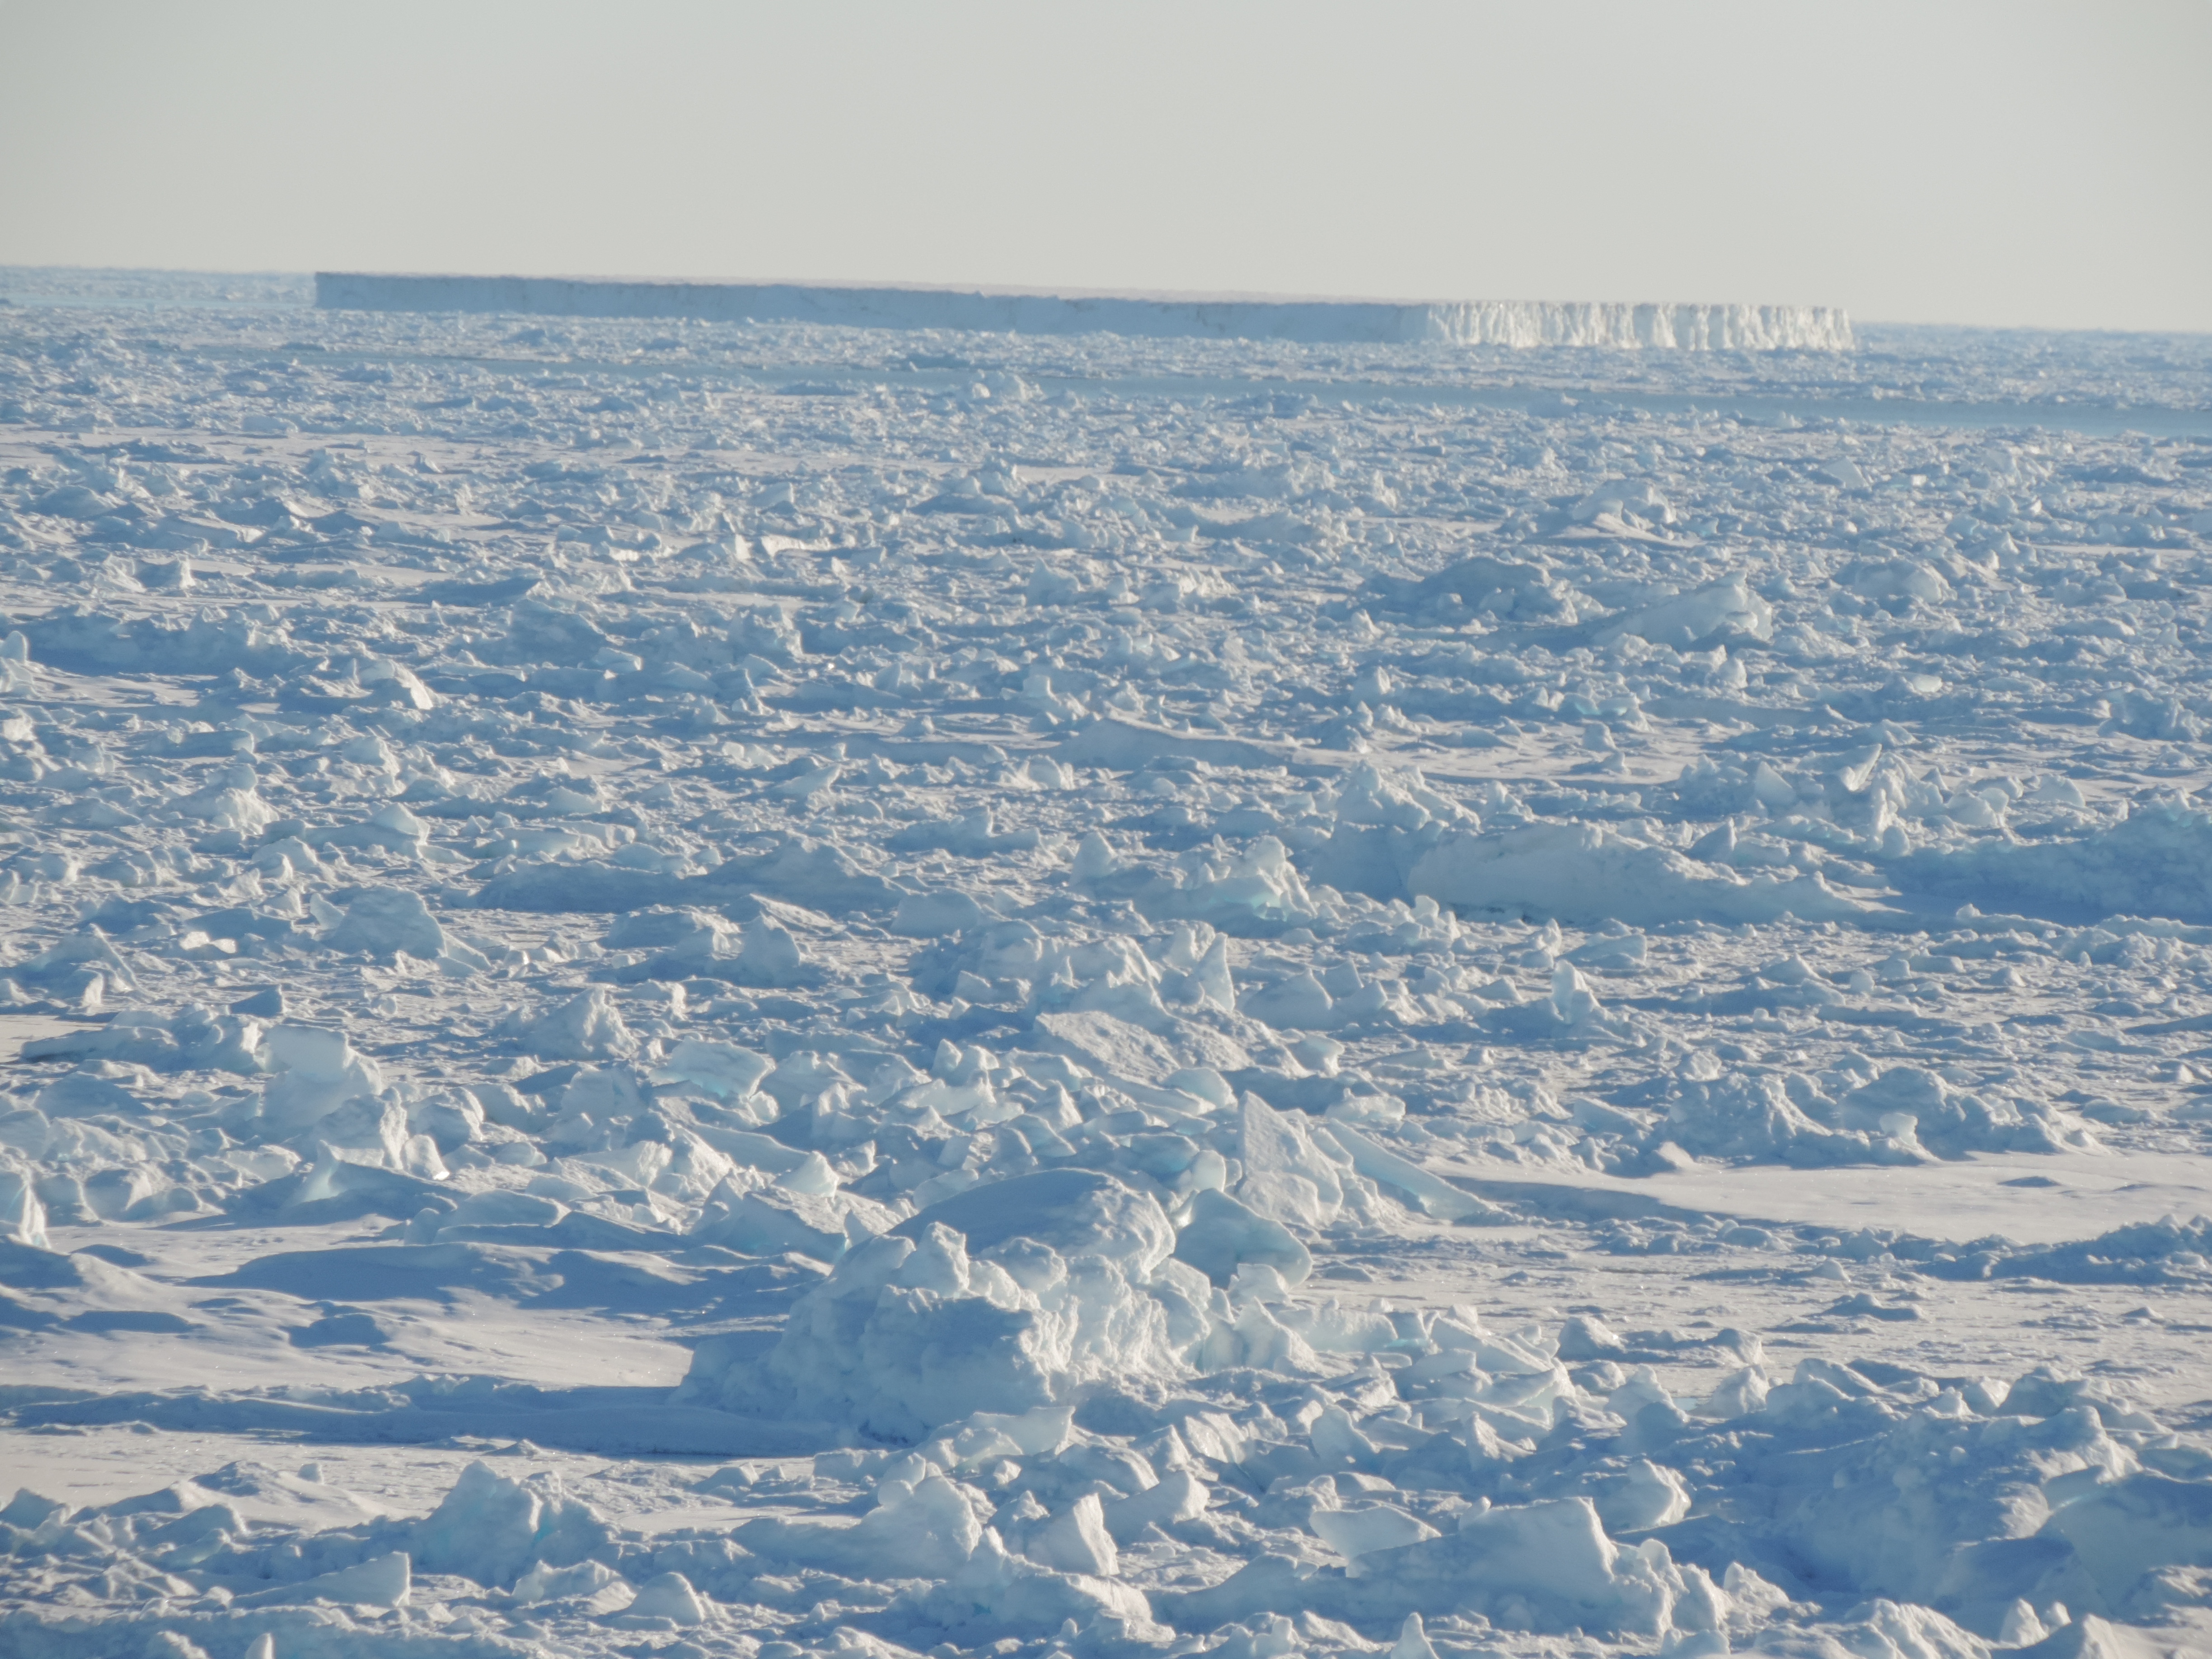
Tabular iceberg and sea ice cover near Isle de France 10 June 2014
[This entry will be submitted to NSF as a Final Outcome Report for award 1362109 “Shelf-Basin Exchange near 79N Glacier and Zachariae Isstrom, North-East Greenland.” The work would not have been possible without the generous support of NSF as well as the German Government as represented by the Alfred Wegener Institute who sponsored the expedition to North-East Greenland in 2014. Torsten Kanzow, Benjamin Rabe, and Ursula Schauer of AWI all deserve as much and even more credit for this work than do I.]
Budéus, G., & Schneider, W. (1995). On the hydrography of the Northeast Water Polynya Journal of Geophysical Research, 100 (C3) DOI: 10.1029/94JC02024
Hughes, N., Wilkinson, J., & Wadhams, P. (2011). Multi-satellite sensor analysis of fast-ice development in the Norske Øer Ice Barrier, northeast Greenland Annals of Glaciology, 52 (57), 151-160 DOI: 10.3189/172756411795931633
Reeh, N., Thomsen, H., Higgins, A., & Weidick, A. (2001). Sea ice and the stability of north and northeast Greenland floating glaciers Annals of Glaciology, 33 (1), 474-480 DOI: 10.3189/172756401781818554
Wadhams, P., Wilkinson, J., & McPhail, S. (2006). A new view of the underside of Arctic sea ice Geophysical Research Letters, 33 (4) DOI: 10.1029/2005GL025131


![Donald MacMillan and Jack Barnes at Fort Conger, spring 1909 [From LeMoine, 2013]](https://icyseas.org/wp-content/uploads/2015/02/3000-32-1808v2b_blog.jpg)