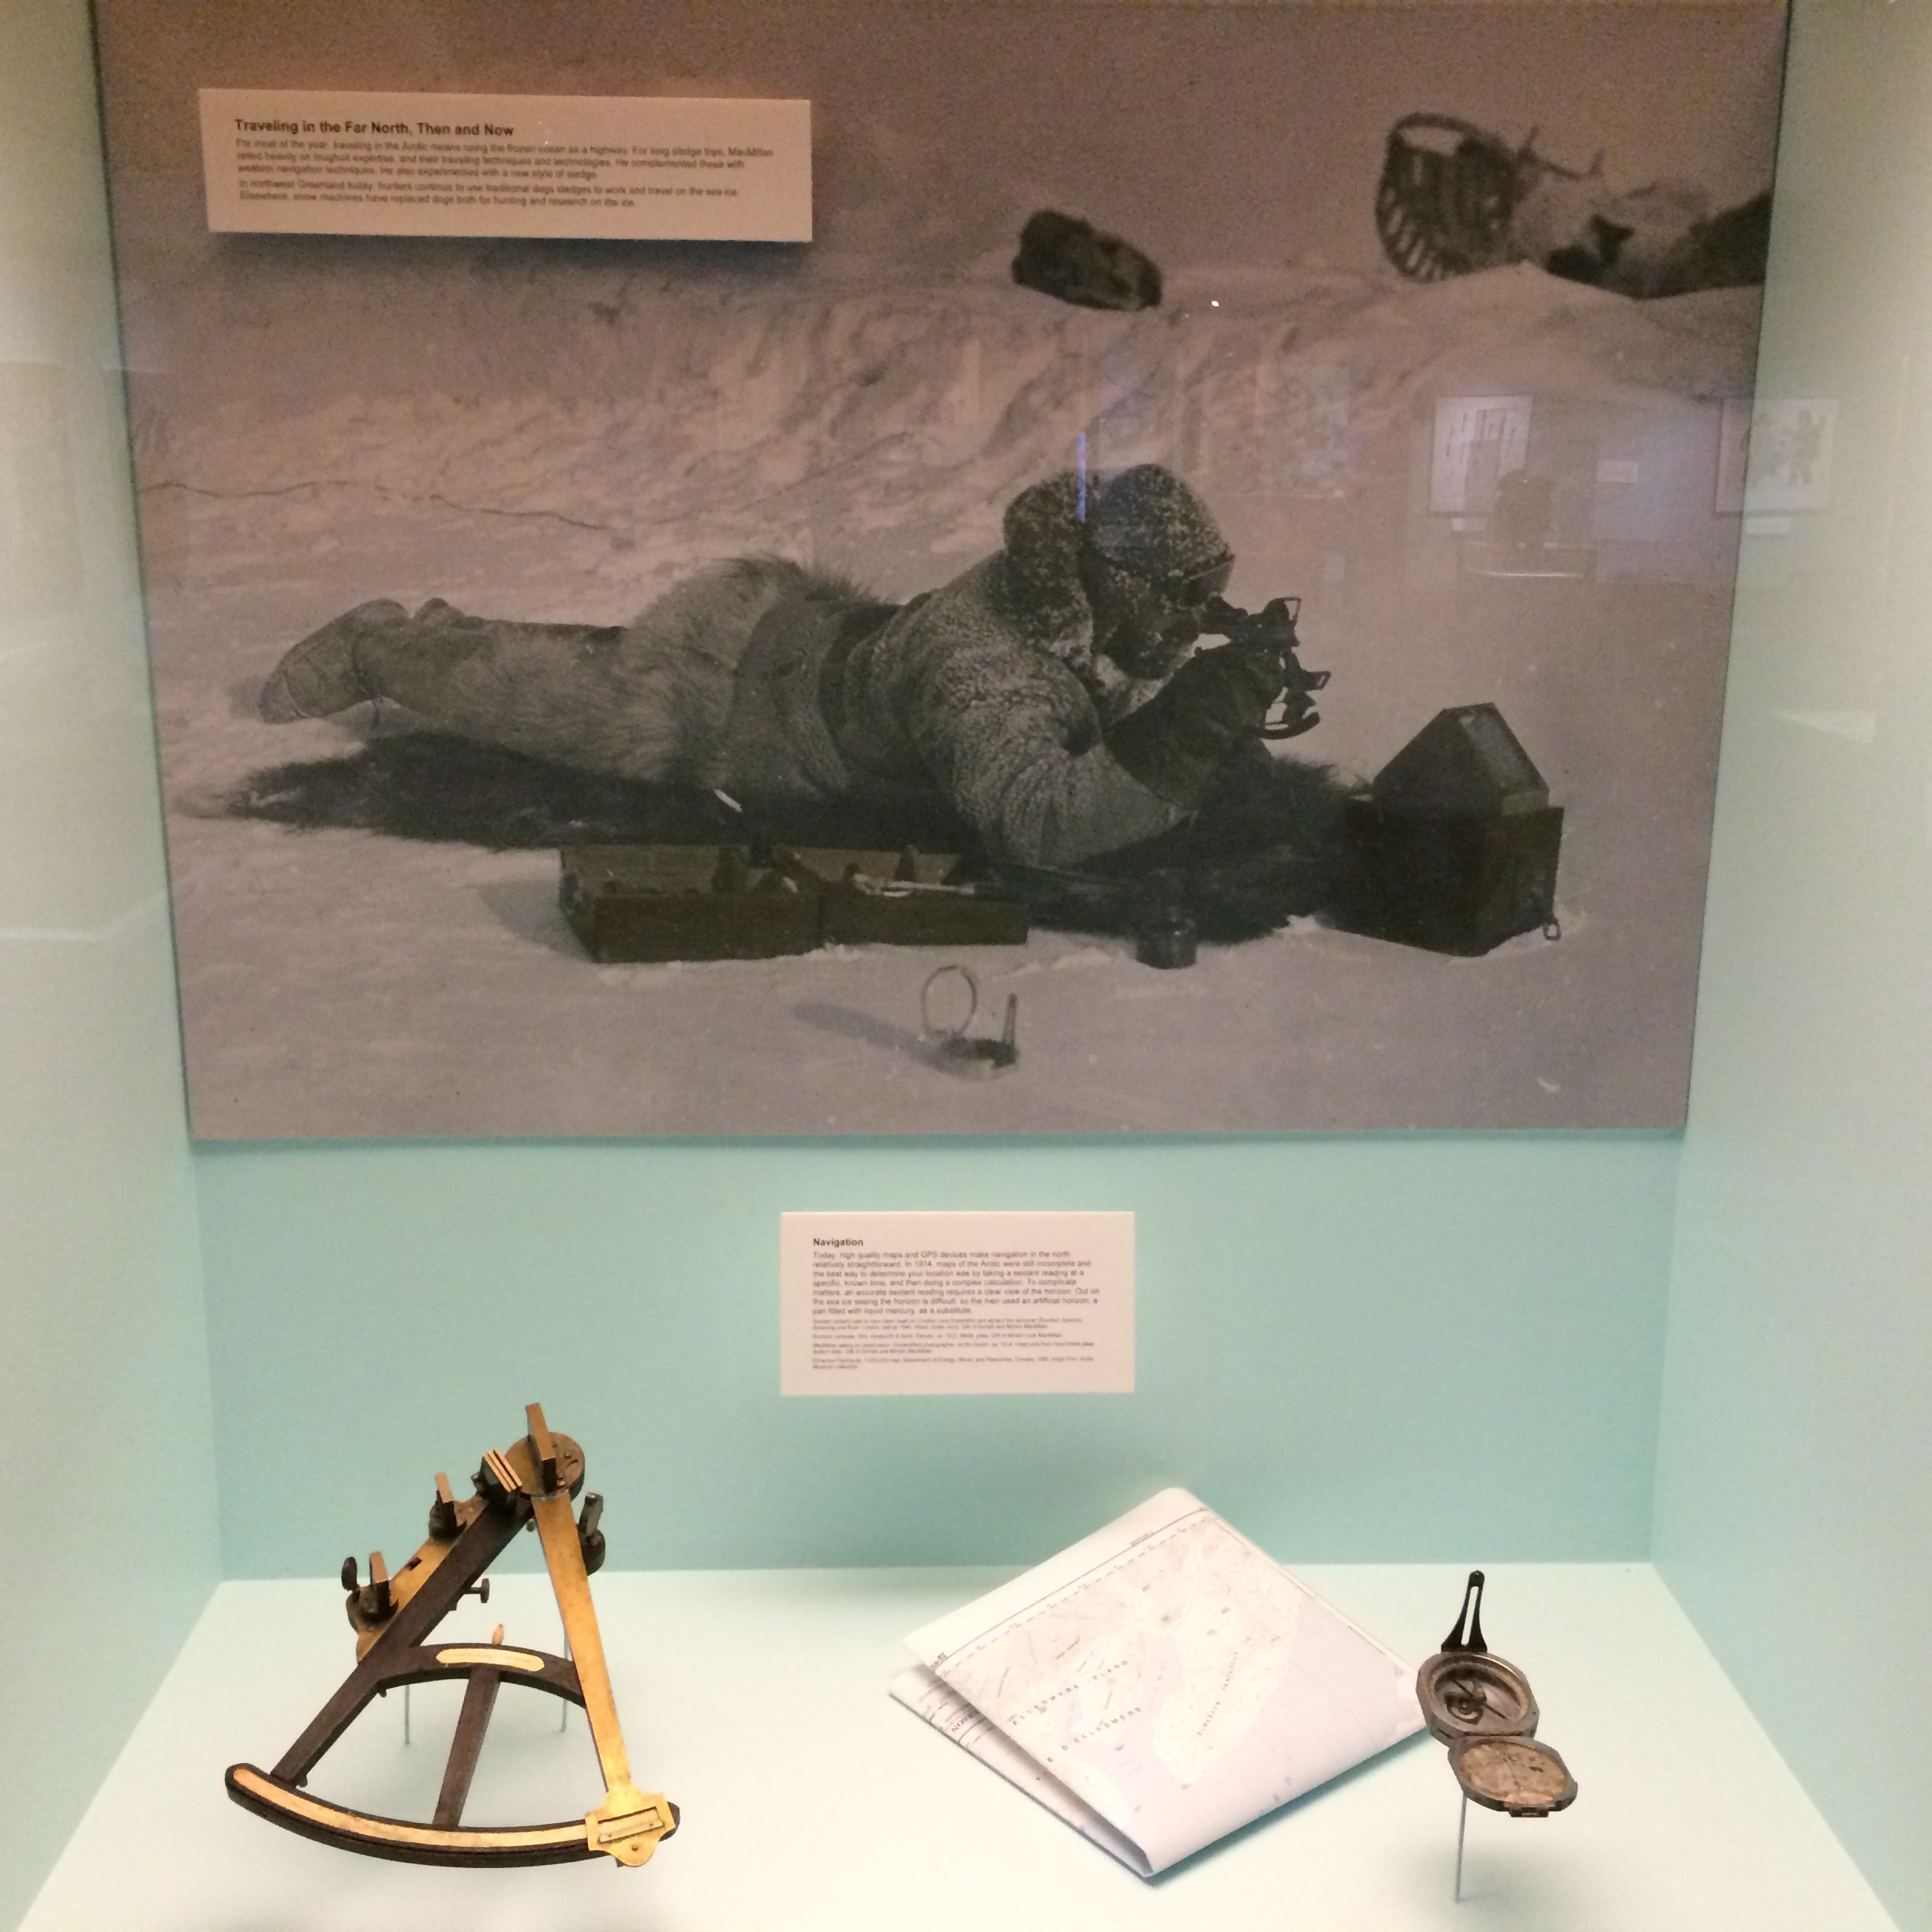
Navigating ice, ocean, and land, brave women and men have always used the stars for guidance. Just think of the three kings who followed a star to witness the birth of Jesus Christ in Bethlehem 2015 years ago. They were 6 days late. Keeping track of time track was always difficult for navigating, especially at sea and the British Navy lost many ships as a result of poor time keeping. There are books written on the history of determining longitude, the best of which is called, well, “Longitude.” Now why would I ponder these questions and histories two hours before I am boarding the Swedish icebreaker Oden to travel by sea and ice to Petermann Glacier?
-

- Traveling to Greenland with the US Air National Guard.
-
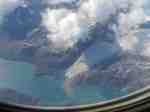
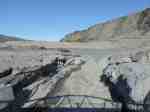
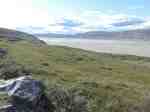
- Small Greenland glacier discharging a sediment plume at its grounding line into a fjord.
-
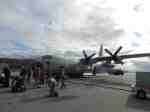
- Air National Guard transport plane delivering scientists to Kangerlussuaq, Greenland.
The Global Position System (GPS) that many of us have in our smart phones or tiny hand-held devices makes navigating easy. Both measure time as our civilization has put “stars” into space that guide hikers out in the back-country, urban dwellers to the next bar or restaurant, and missiles into a target the size of the dot over the letter “i” on a license plate of a car. Few know that the GPS satellites only sent time from an atomic clock to our GPS receivers and smart phones. Time is of the essence, there is something almost spiritual about time and how to define it. And time is linked to space not just because of Einstein’s theory of relativity, but also the way we measure space by measuring the time that waves travel through space.
-
- Watson River in Kangerlussuaq, Greenland with a sharp drop causing rapids.
-
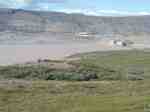
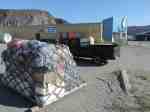
- View of Kangerlussuaq showing both town and airport.
Waiting for the plane to get 58 scientists to Thule to board the I/B Oden, I went for a geocaching trip an hour or two from the town of Kangerlussuaq. My wife got me into this 2 years ago as a way to explore areas via hiking without much planning. All we do is enter some GPS position of places where other people have placed “treasures” and we head out to find them. These geocaches are everywhere: within 100 feet of my home, in every city I went to in Poland, Sweden, or Germany, and now Greenland, too. My favorite GPS unit is a little hand-held $99 Garmin eTrex 10. It does a marvelous job to get me anywhere within about 3-6 feet (1-2 meters).
-
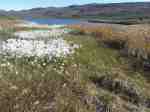
- Lake Ferguson, Greenland, view from sitting on geocache.
-
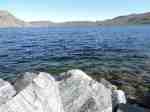
- Estuary of the Watson River at the head of the fjord.
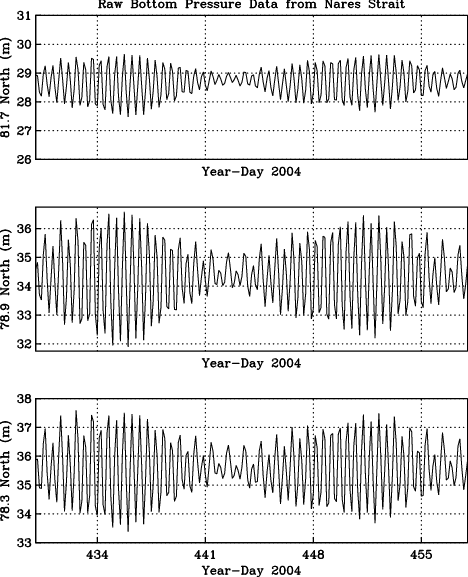
As part of our Petermann research, we also got four “fancy” GPS systems which we want to place on the ice shelf of Petermann Gletscher to measure tidal motions. The water under the glacier is connected to ocean that moves the Empire-State-Building thick ice up and down every 12 hours or so. We do not know by how much, though, and when it moves up and when it moves down. There should also be daily cycles and longer periods caused by winds and waves. Now these fancy $25,000 GPS are able to track over 400 satellites (not just the 9 that my Garmin does) and they receive the time information in a very raw and accurate format at more than one radio frequency in more than one way. If one has several of these, we got four, then it is possible to built a network that reduces common errors in position to a few millimeters in the horizontal, and 1-2 centimeter in the vertical after some smart processing. So these “fancy GPS” can sense the difference of the top of your smart phone from the bottom, and I do not mean its length or width, but its thin height. And this is blowing my mind. We need this accuracy to measure tides, and tides we will measure for the 20-30 days that we are working in and around Petermann Gletscher.
Wish us luck as we are heading from the green part of Greenland in the south to its white (ice), black (ocean), and gray (land) parts. There are few colors where we will be the next 4 weeks. Our internet will be gone, but I will try to send text files and small photos until we return on 4 September or so, but time will be hard to find. Wish all of us luck …


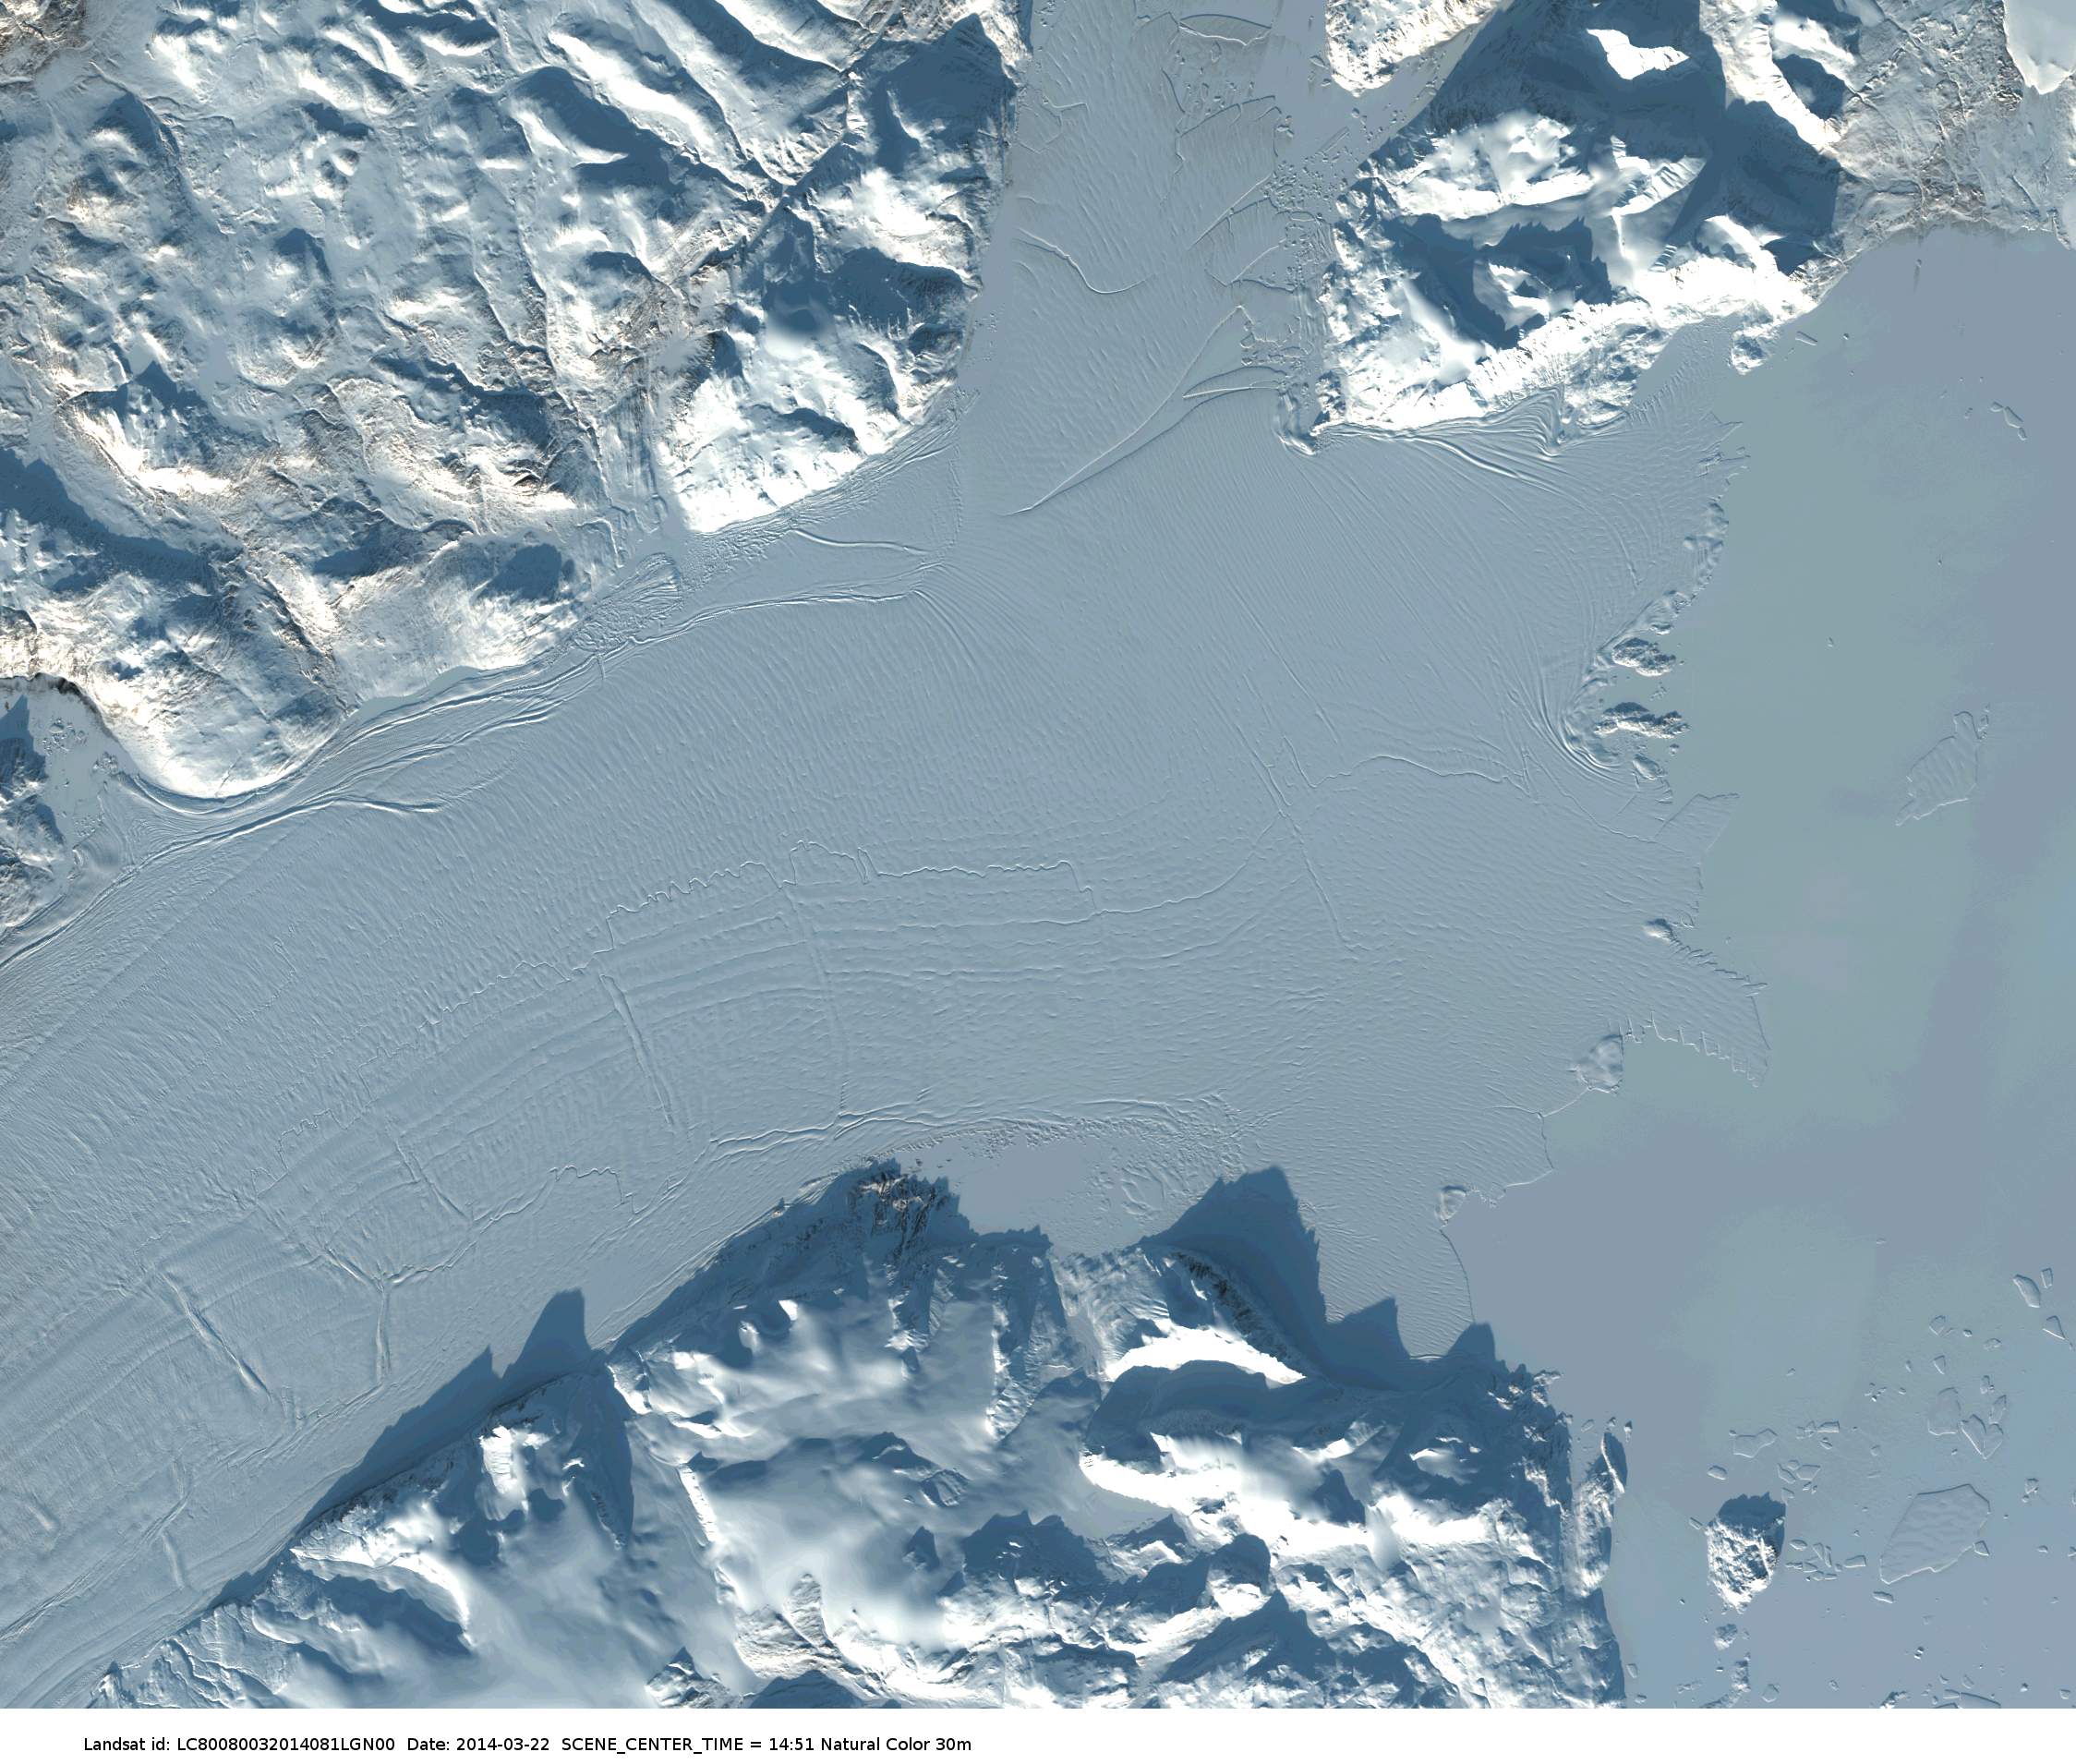


![Seaward front of Petermann Glacier Aug.-11, 2012. View is from a small side-glacier towards the south-east across Petermann Fjord with Petermann Gletscher to the left (east). [Photo Credit: Erin Clarke, Canadian Coast Guard Ship Henry Larsen]](https://icyseas.org/wp-content/uploads/2012/11/p1080580.jpg)