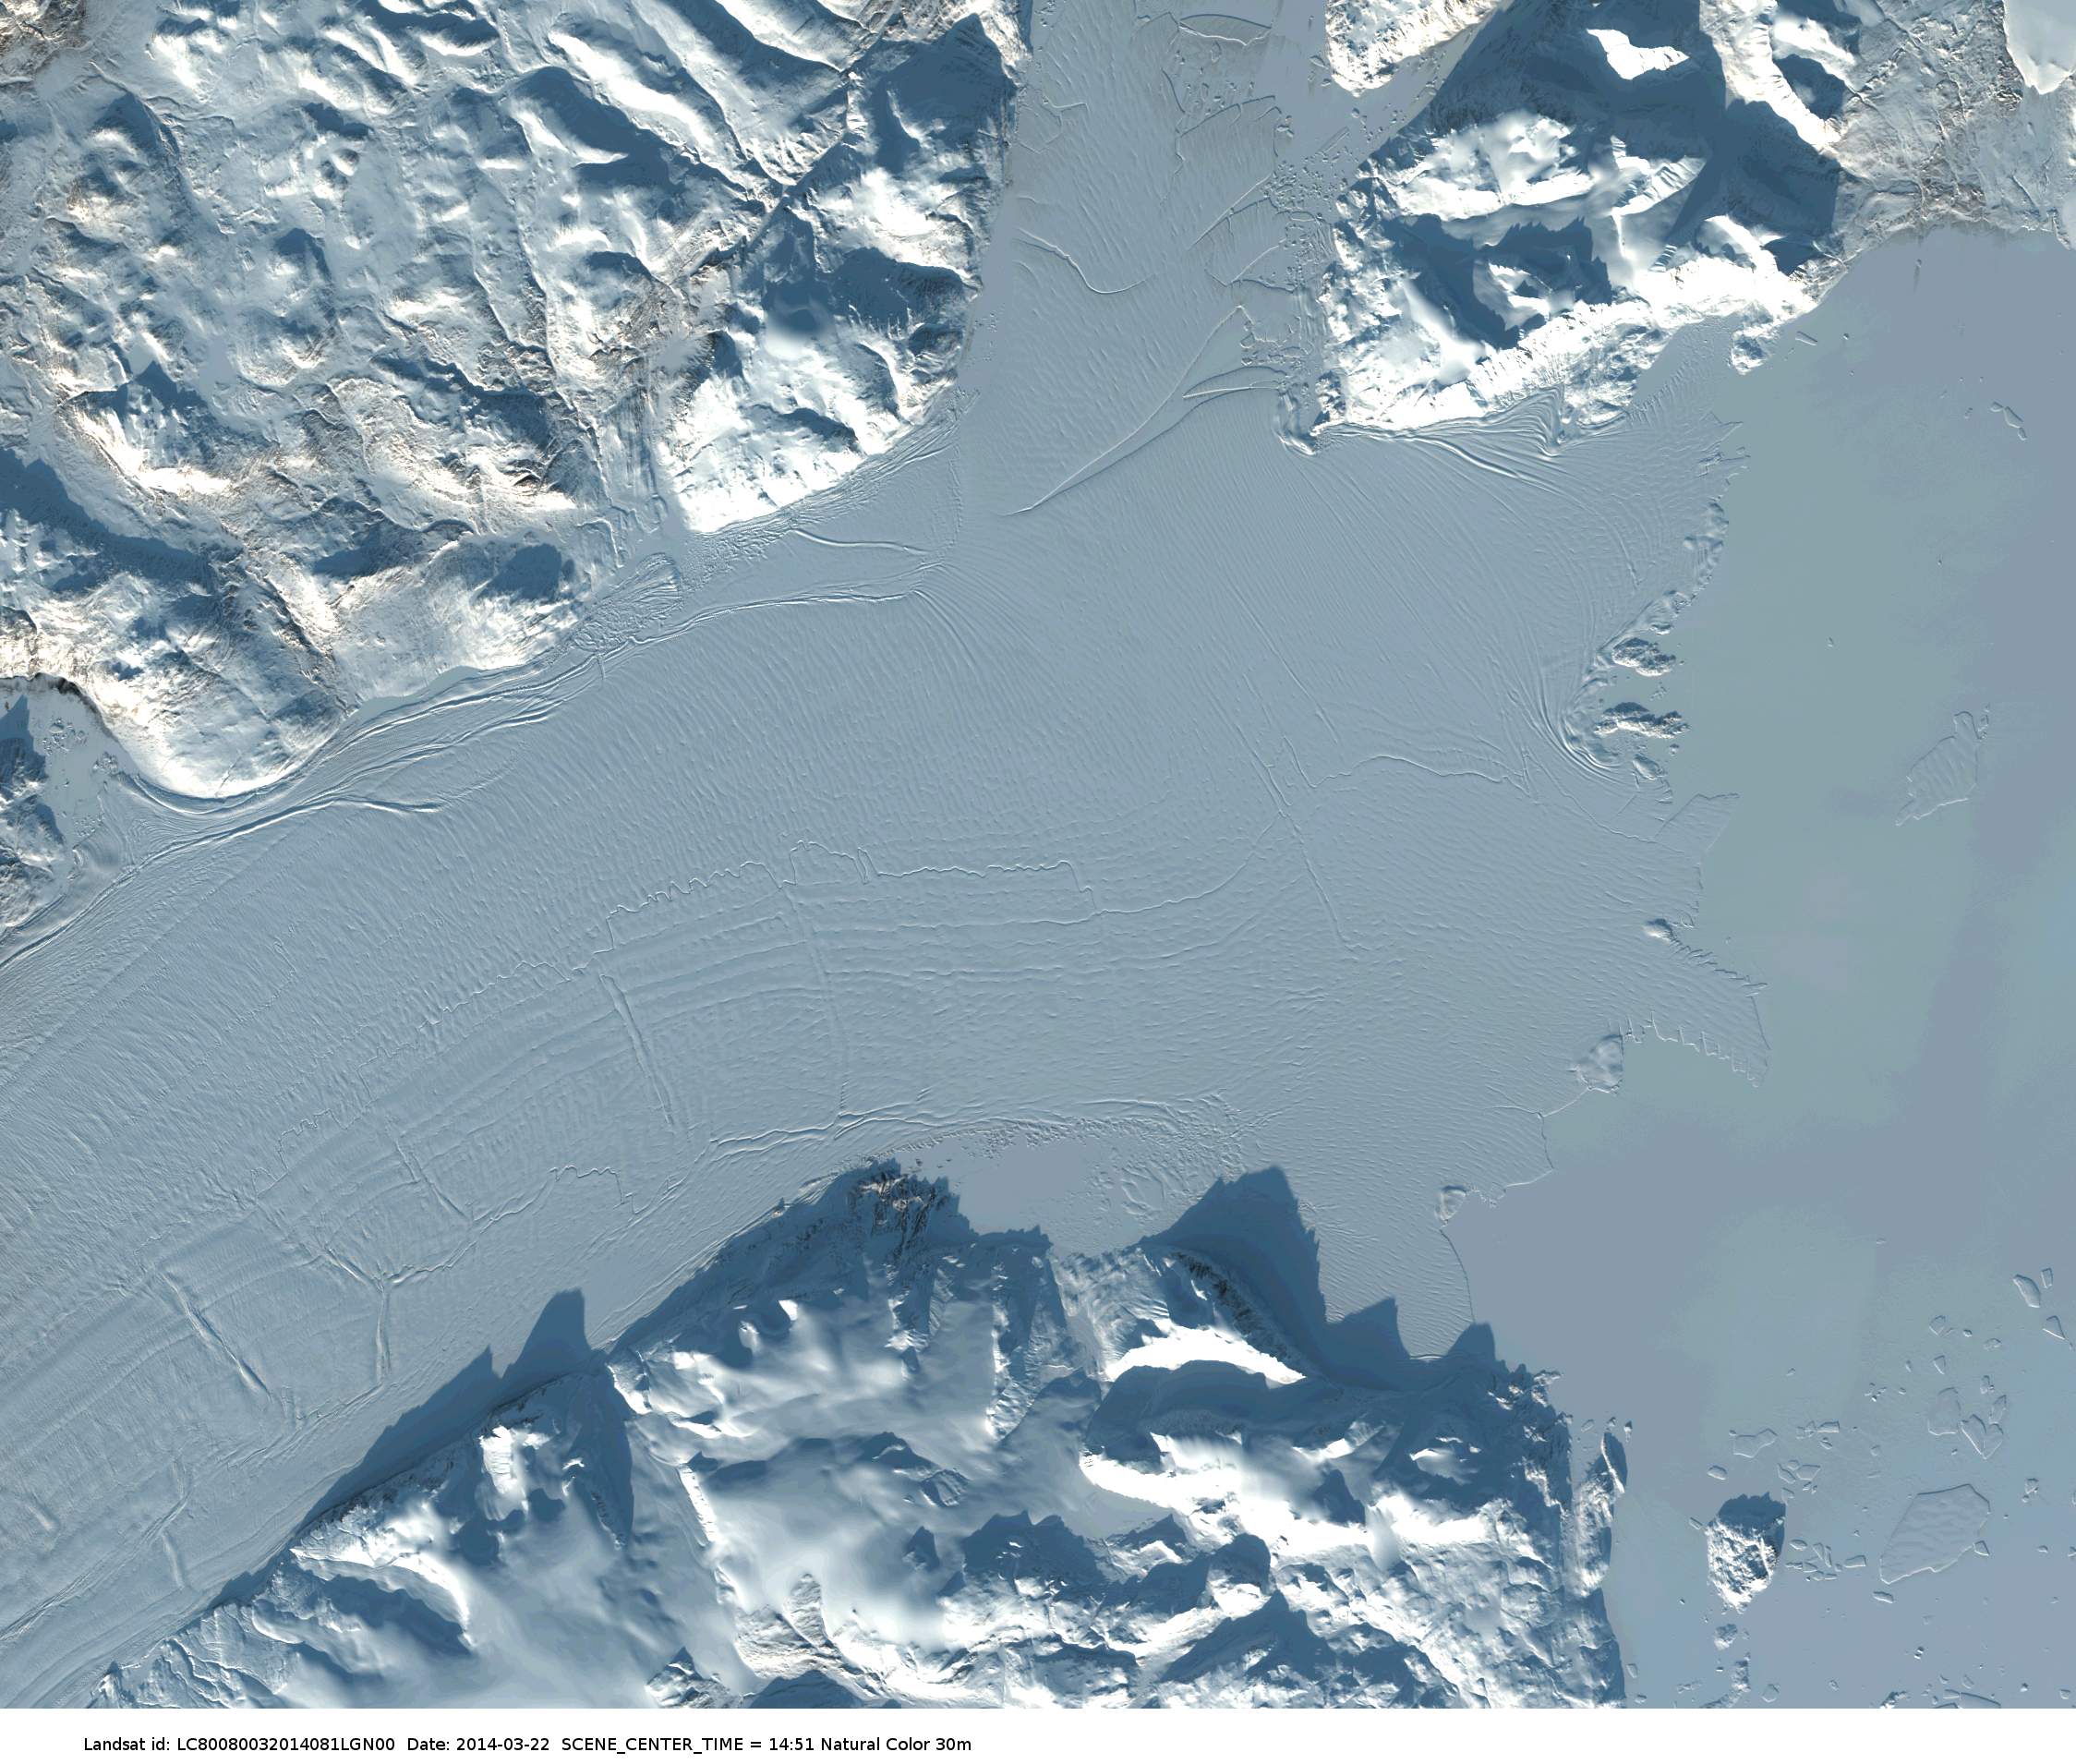
I need the ice out of Nares Strait, a 20 mile wide and 300 miles long pathway to the North Pole between northern Canada and Greenland. The ice blocks our way to Petermann Fjord where a large glacier pushes thick ice out so sea as a floating ice shelf. We plan to drill through the floating section of the glacier that is about as thick as the Empire State Building is high. The ship to get us there is the Swedish icebreaker Oden (Location Map). She is passing the Faroe Islands to the north-west of Scotland and will arrive in 2 weeks at Thule Air Force Base where we will meet her.
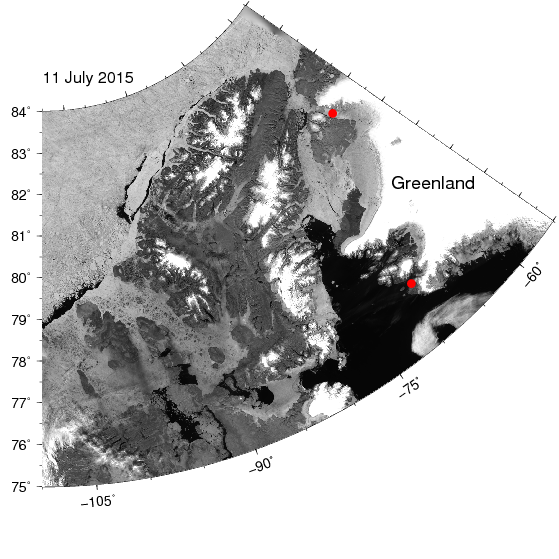
Image of northern Greenland (top right) and Ellesmere Island (center) showing open water as black, land as gray, and sea ice as gray/white. The two red dots are Thule Air Force Base in the south and Petermann Glacier in the north. Note the bands of black water along the coast of Ellesmere Island that result from east to west blowing winds that move ice offshore and reduce the southward flow in Nares Strait.
The voyage from Thule to Petermann usually takes about 2-3 days, but if the sea ice does not flush out with the generally southward currents, then it may take a week or two wrecking havoc to our busy science schedule. So, why is the ice still lingering in Nares Strait this year?
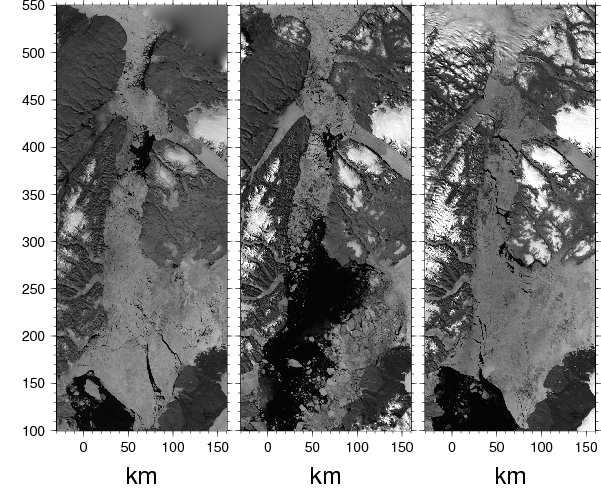
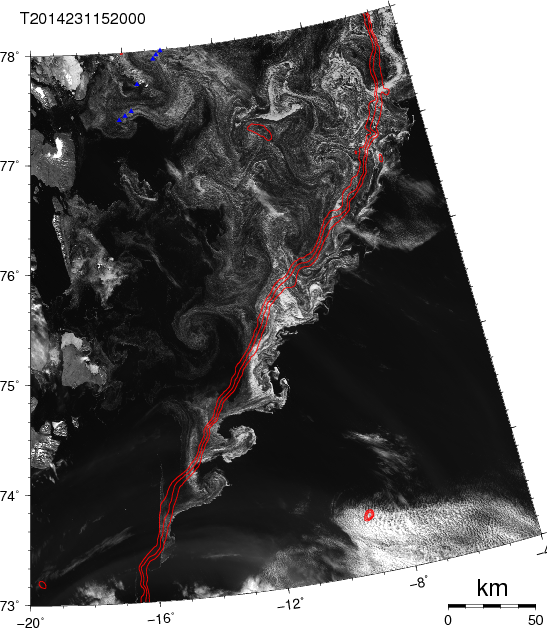
Nares Strait ice cover in July of 2015 (left), 2014 (center), and 2013 (right) from MODIS Terra.
There are three parts to the answer: First, a sturdy ice arch at the southern entrance of Nares Strait has to break. It has done so only last week. Second, a strong and perhaps oscillating flow has to thoroughly collapse the large pieces of ice at a narrow choke point that is Smith Sound. This has not happened yet. And third, a persistent flow to the south has to flush out ice into Baffin Bay to the south faster than it enters from the Arctic Ocean in the north. This flow is much weaker at the moment than is normal, because winds in the Arctic Ocean have been from east to west right now. These winds moved water (and ice) offshore to the north, so sealevel along northern Greenland and Canada drops. We can see this in today’s satellite imagery as prominent black bands of open water along the coast of northern Canada.
Lets take a closer look of this same image and zoom in on the southern part of Nares Strait as it looked this morning.
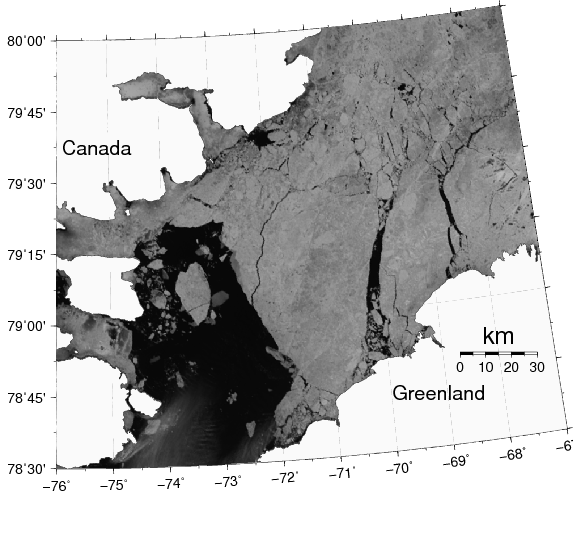
Collapsing ice arch at the southern entrance to Nares Strait on 13 July 2015 from MODIS AQUA.
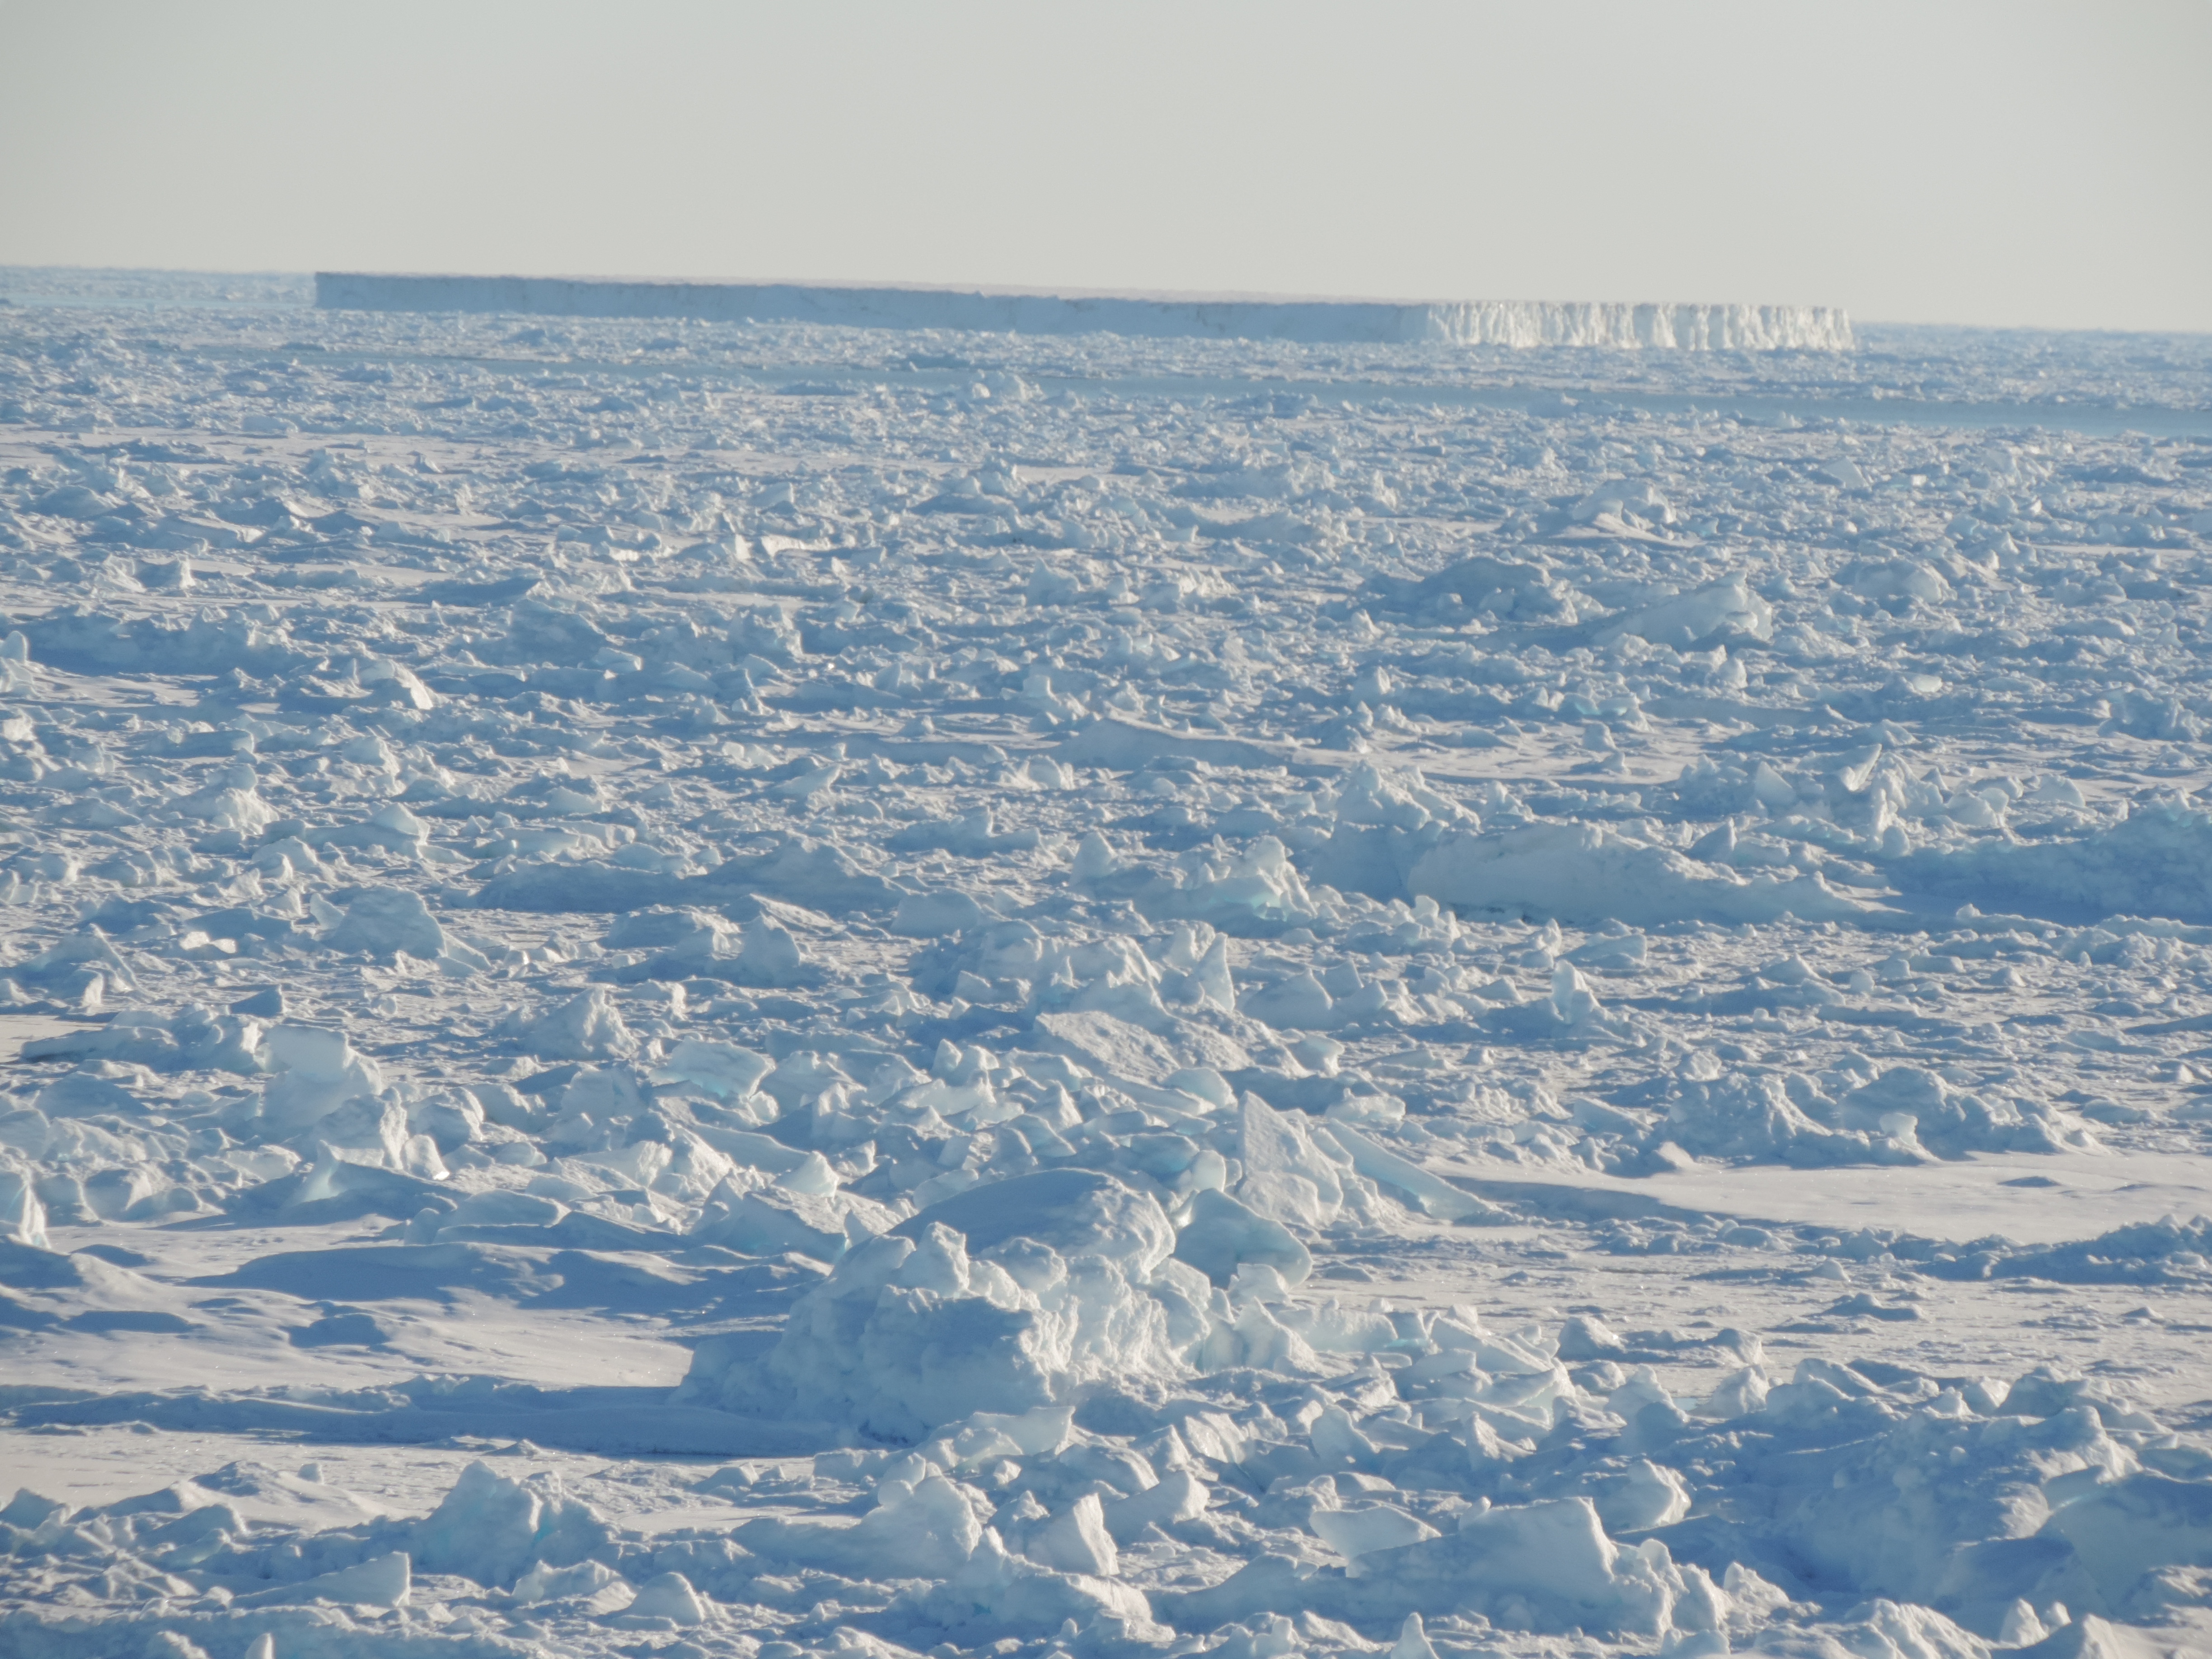
What used to be a solid frozen mass of ice along the Greenland coast (bottom right) has become a broken and loose mass of smaller ice floes. The larger blocks farther from the coast are now sliding southward as the loose ice along the coast reduces friction or lubricates the edges. The sides lose their grip on the ice and the entire construction fails and collapses. A most beautiful video on the stability of arches is posted by Open University here about lines of action or thrust.
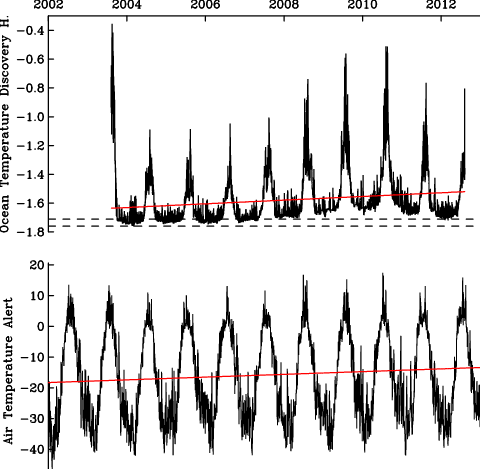
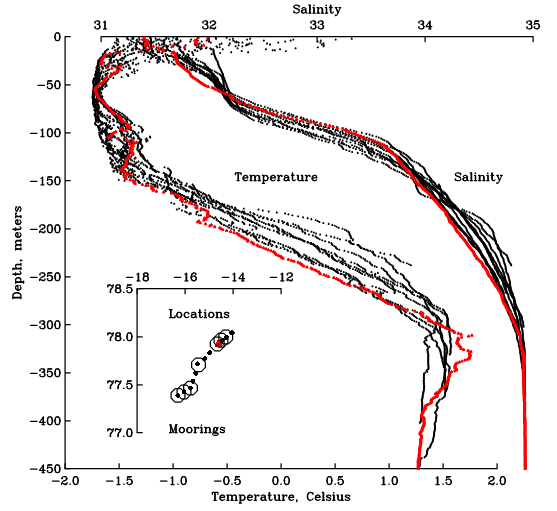
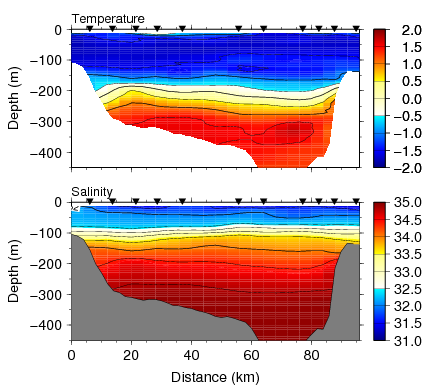
All we now need for the ice to flush out of Nares Strait is a weakening or reversal of the winds at the other northern entrances to Nares Strait. Much of the generally southward flow is caused by the ocean’s surface being higher in the north than it is in the south. There are details that I am skipping, but basically much of the flow rolls downhill like a ball. And with the winds up north being from east to west, there is not much of a hill that the water can flow down, so we got somewhat stagnant waters. I have actually measured the height of this “hill of water” many times over the many years with ocean sensors that measure how much water is above them. This figure summarizes 3 years of data collected every 3 hours or so
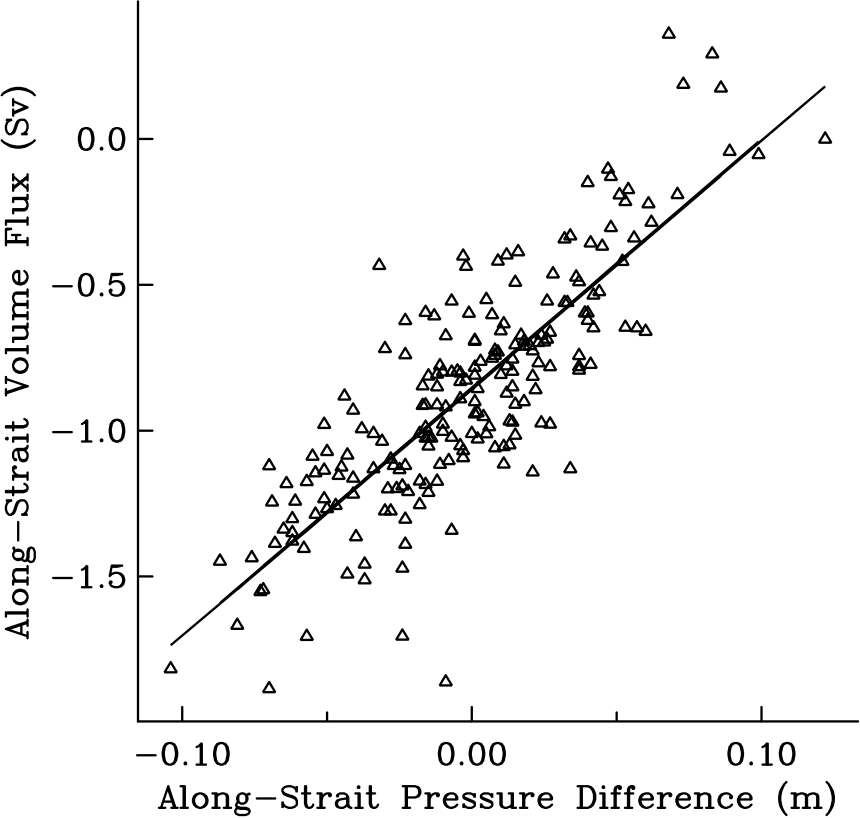
Graph showing how water flow (called “volume flux”) varies with the steepness of the hill (called “pressure gradient”). The “hill” is at most 10 centimeters or 3 inches) high. [Adapted from Muenchow, 2015]
Now there is more to the “hill” story that is modified near the surface by the earth’s rotation in a fluid that has different densities at different depths. In a nutshell, the surface flow is 2-3 times as strong as the depth averaged flow. Furthermore, the surface flow on the Canadian side of Nares Strait is often twice as strong as that closer to Greenland, but all these spatial variations in flow actually help to smash large pieces of ice by moving and rotating them different sides of the same large piece of ice differently.
So, lets all hope that we get a few days of strong winds from the north flowing south, that should clear Nares Strait quickly before Oden arrives there in 2 weeks time. Those winds from the north not only flush out ice from Nares Strait, they also keep it nicely on one, the Canadian side. Earth rotation does wonderful and magical things to fluids such as water and air.
-
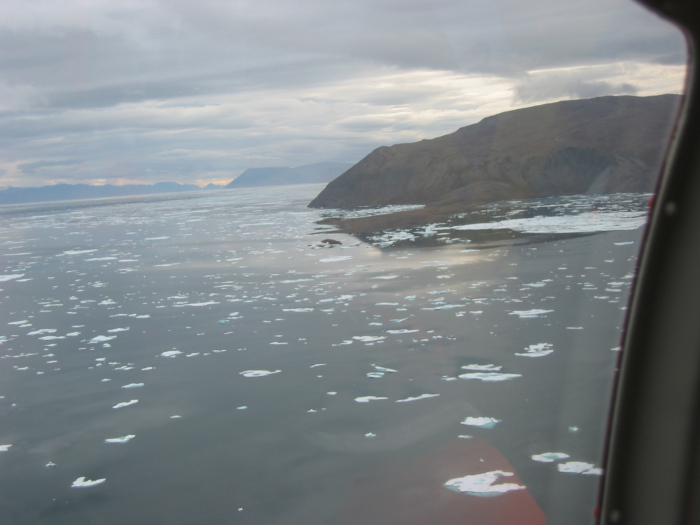
- Alexandra Fjord of Nares Strait in Aug.-2013
-
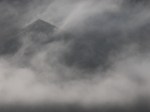
- Kennedy Channel of Nares Strait with a dense layer of cloud 800-m high and 5 km wide, Aug.-2003
-
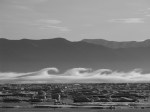
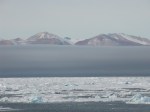
- Shear instabilities in Nares Strait seen from Greenland in August of 2003.
Muenchow, A, 2015: Volume and freshwater flux observations from Nares Strait to the west of Greenland at daily time scales from 2003 to 2009. J. Phys. Oceanogr., re-submitted July 2015, .pdf


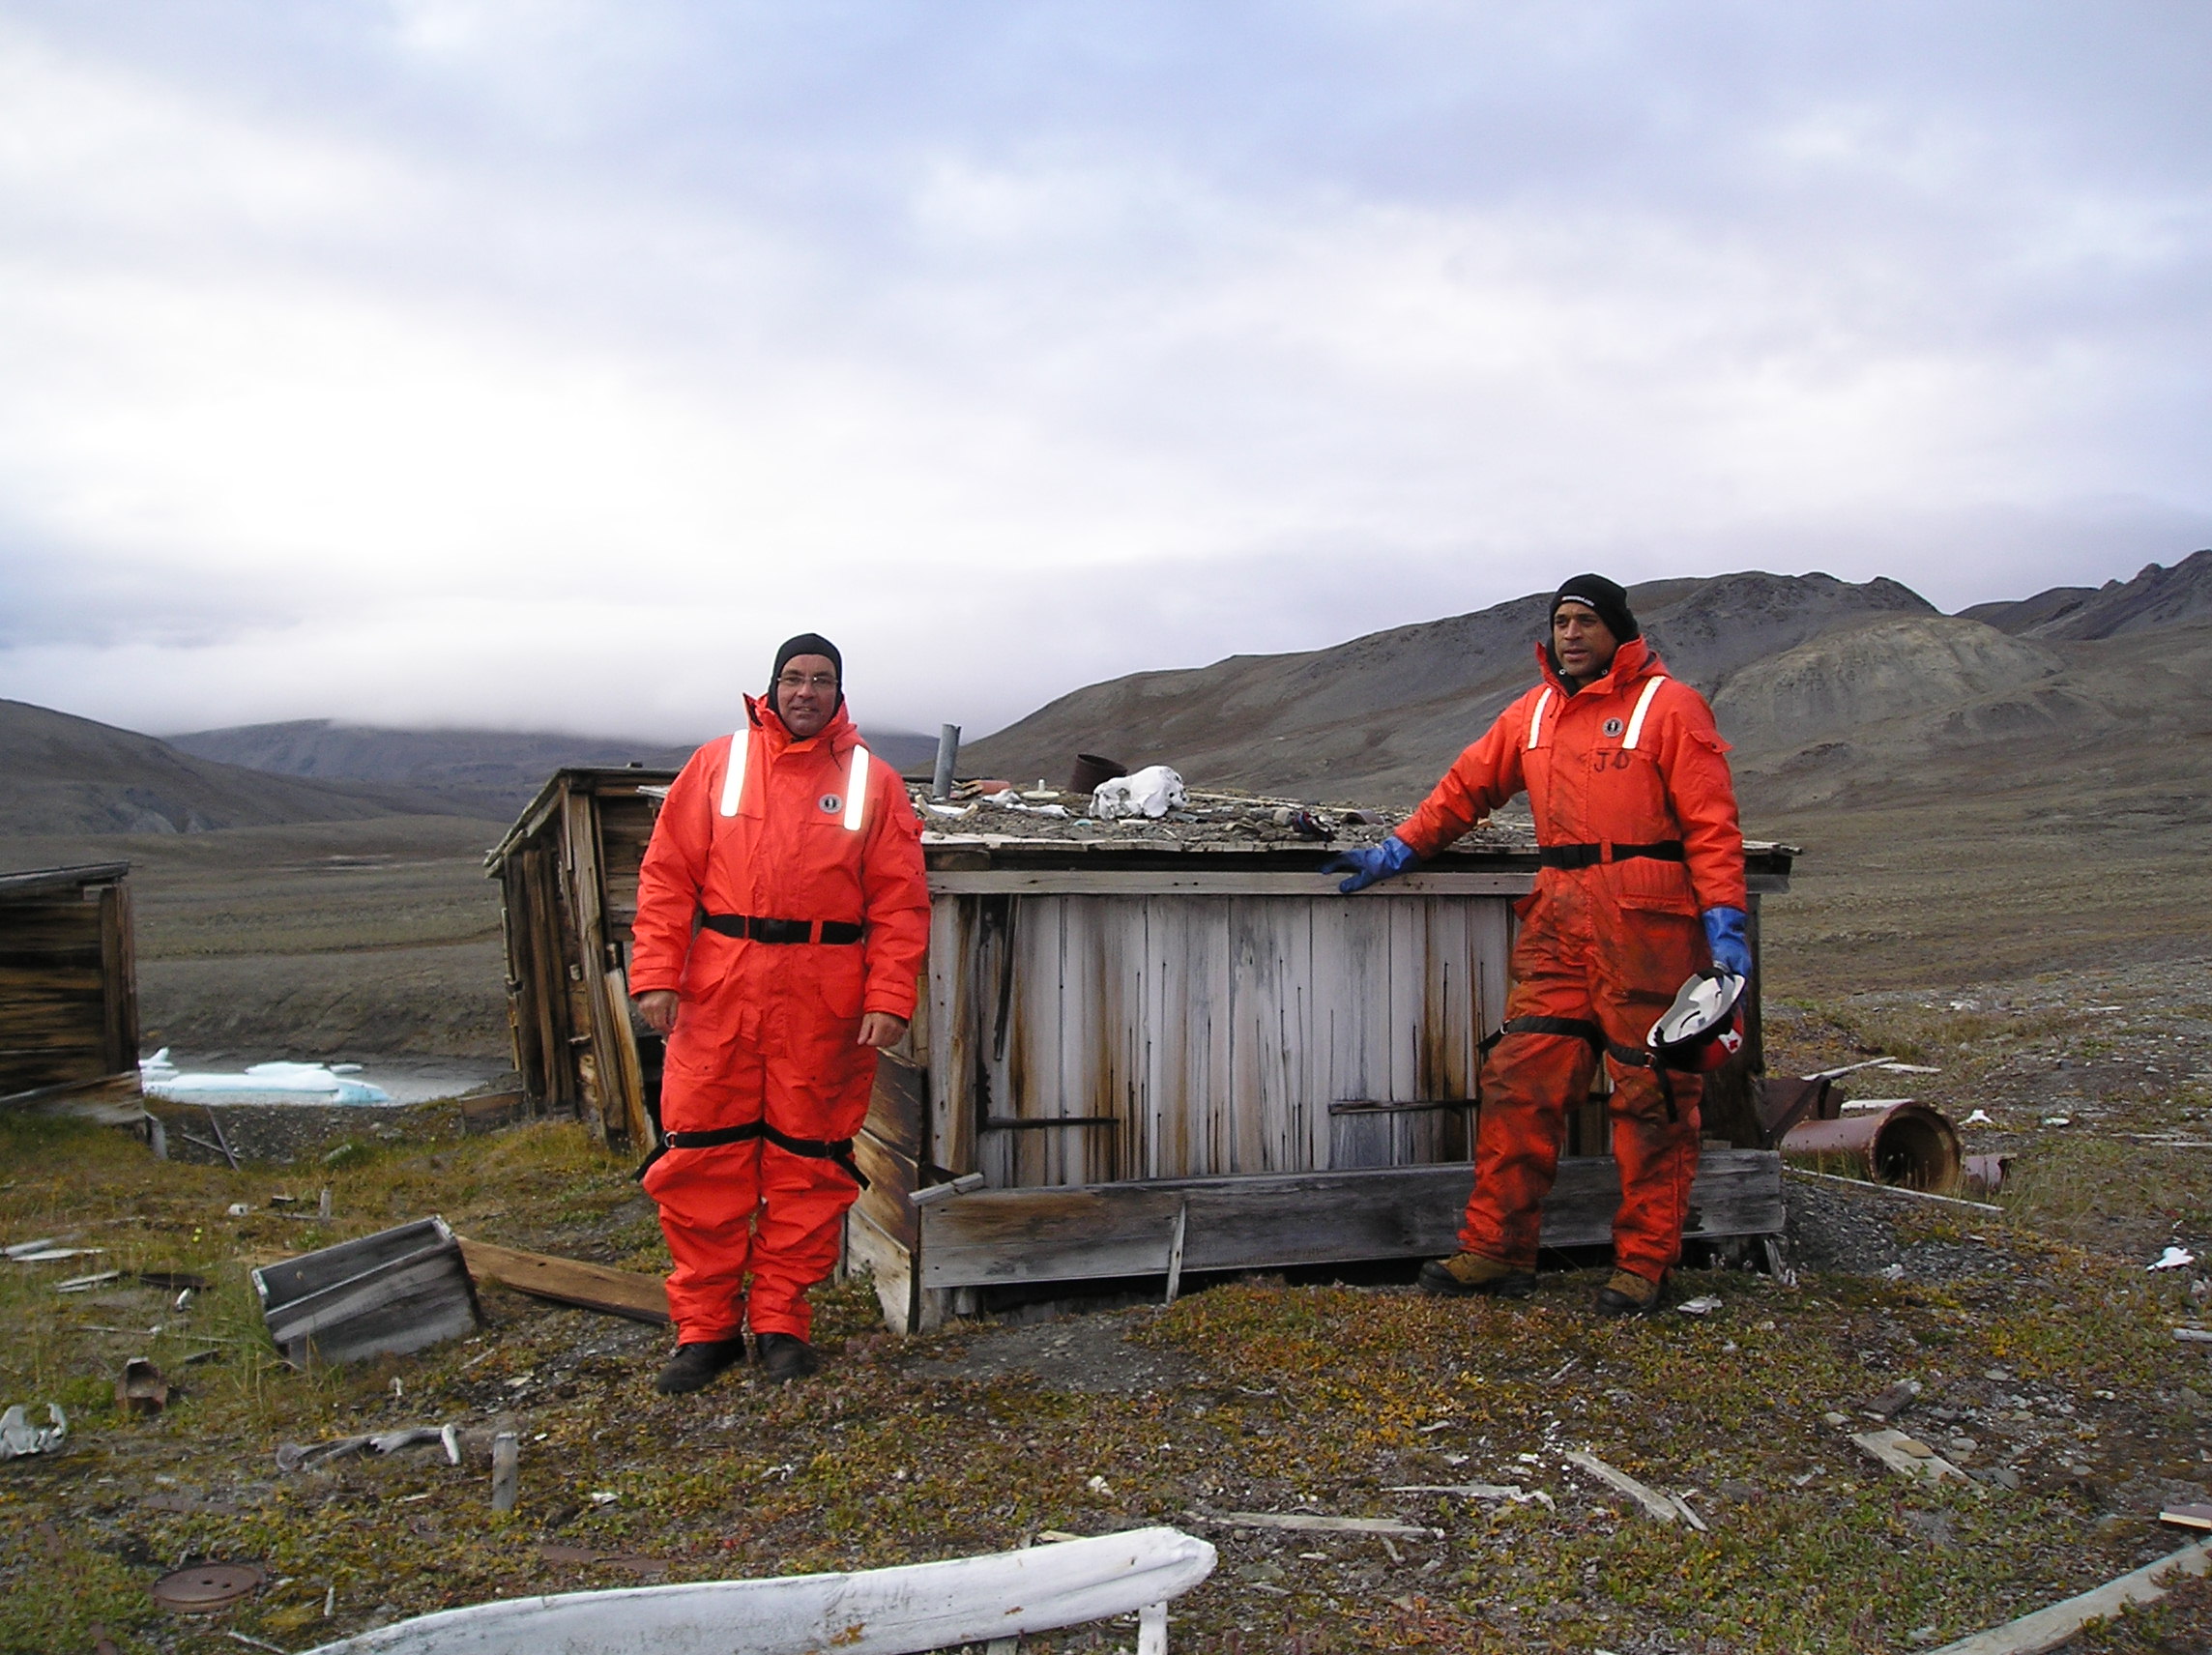
![Donald MacMillan and Jack Barnes at Fort Conger, spring 1909 [From LeMoine, 2013]](https://icyseas.org/wp-content/uploads/2015/02/3000-32-1808v2b_blog.jpg)