I want to fly like an eagle
To the sea
Fly like an eagle
Let my spirit carry me
Steve Miller Band, 1976
The eagle “sees” the ground, because the twinkling sensation of light tickles her nerves. Today’s cameras work without the twinkle and tickle. They store numbers (digits) that approximate the amount of light passing through the lens. Satellite sensors work the same way. The data they beam to earth give me the soaring feeling of flying like an eagle, but there is more to the bits and bytes and digits sent home from space to our iPhones, laptops, and the internet.
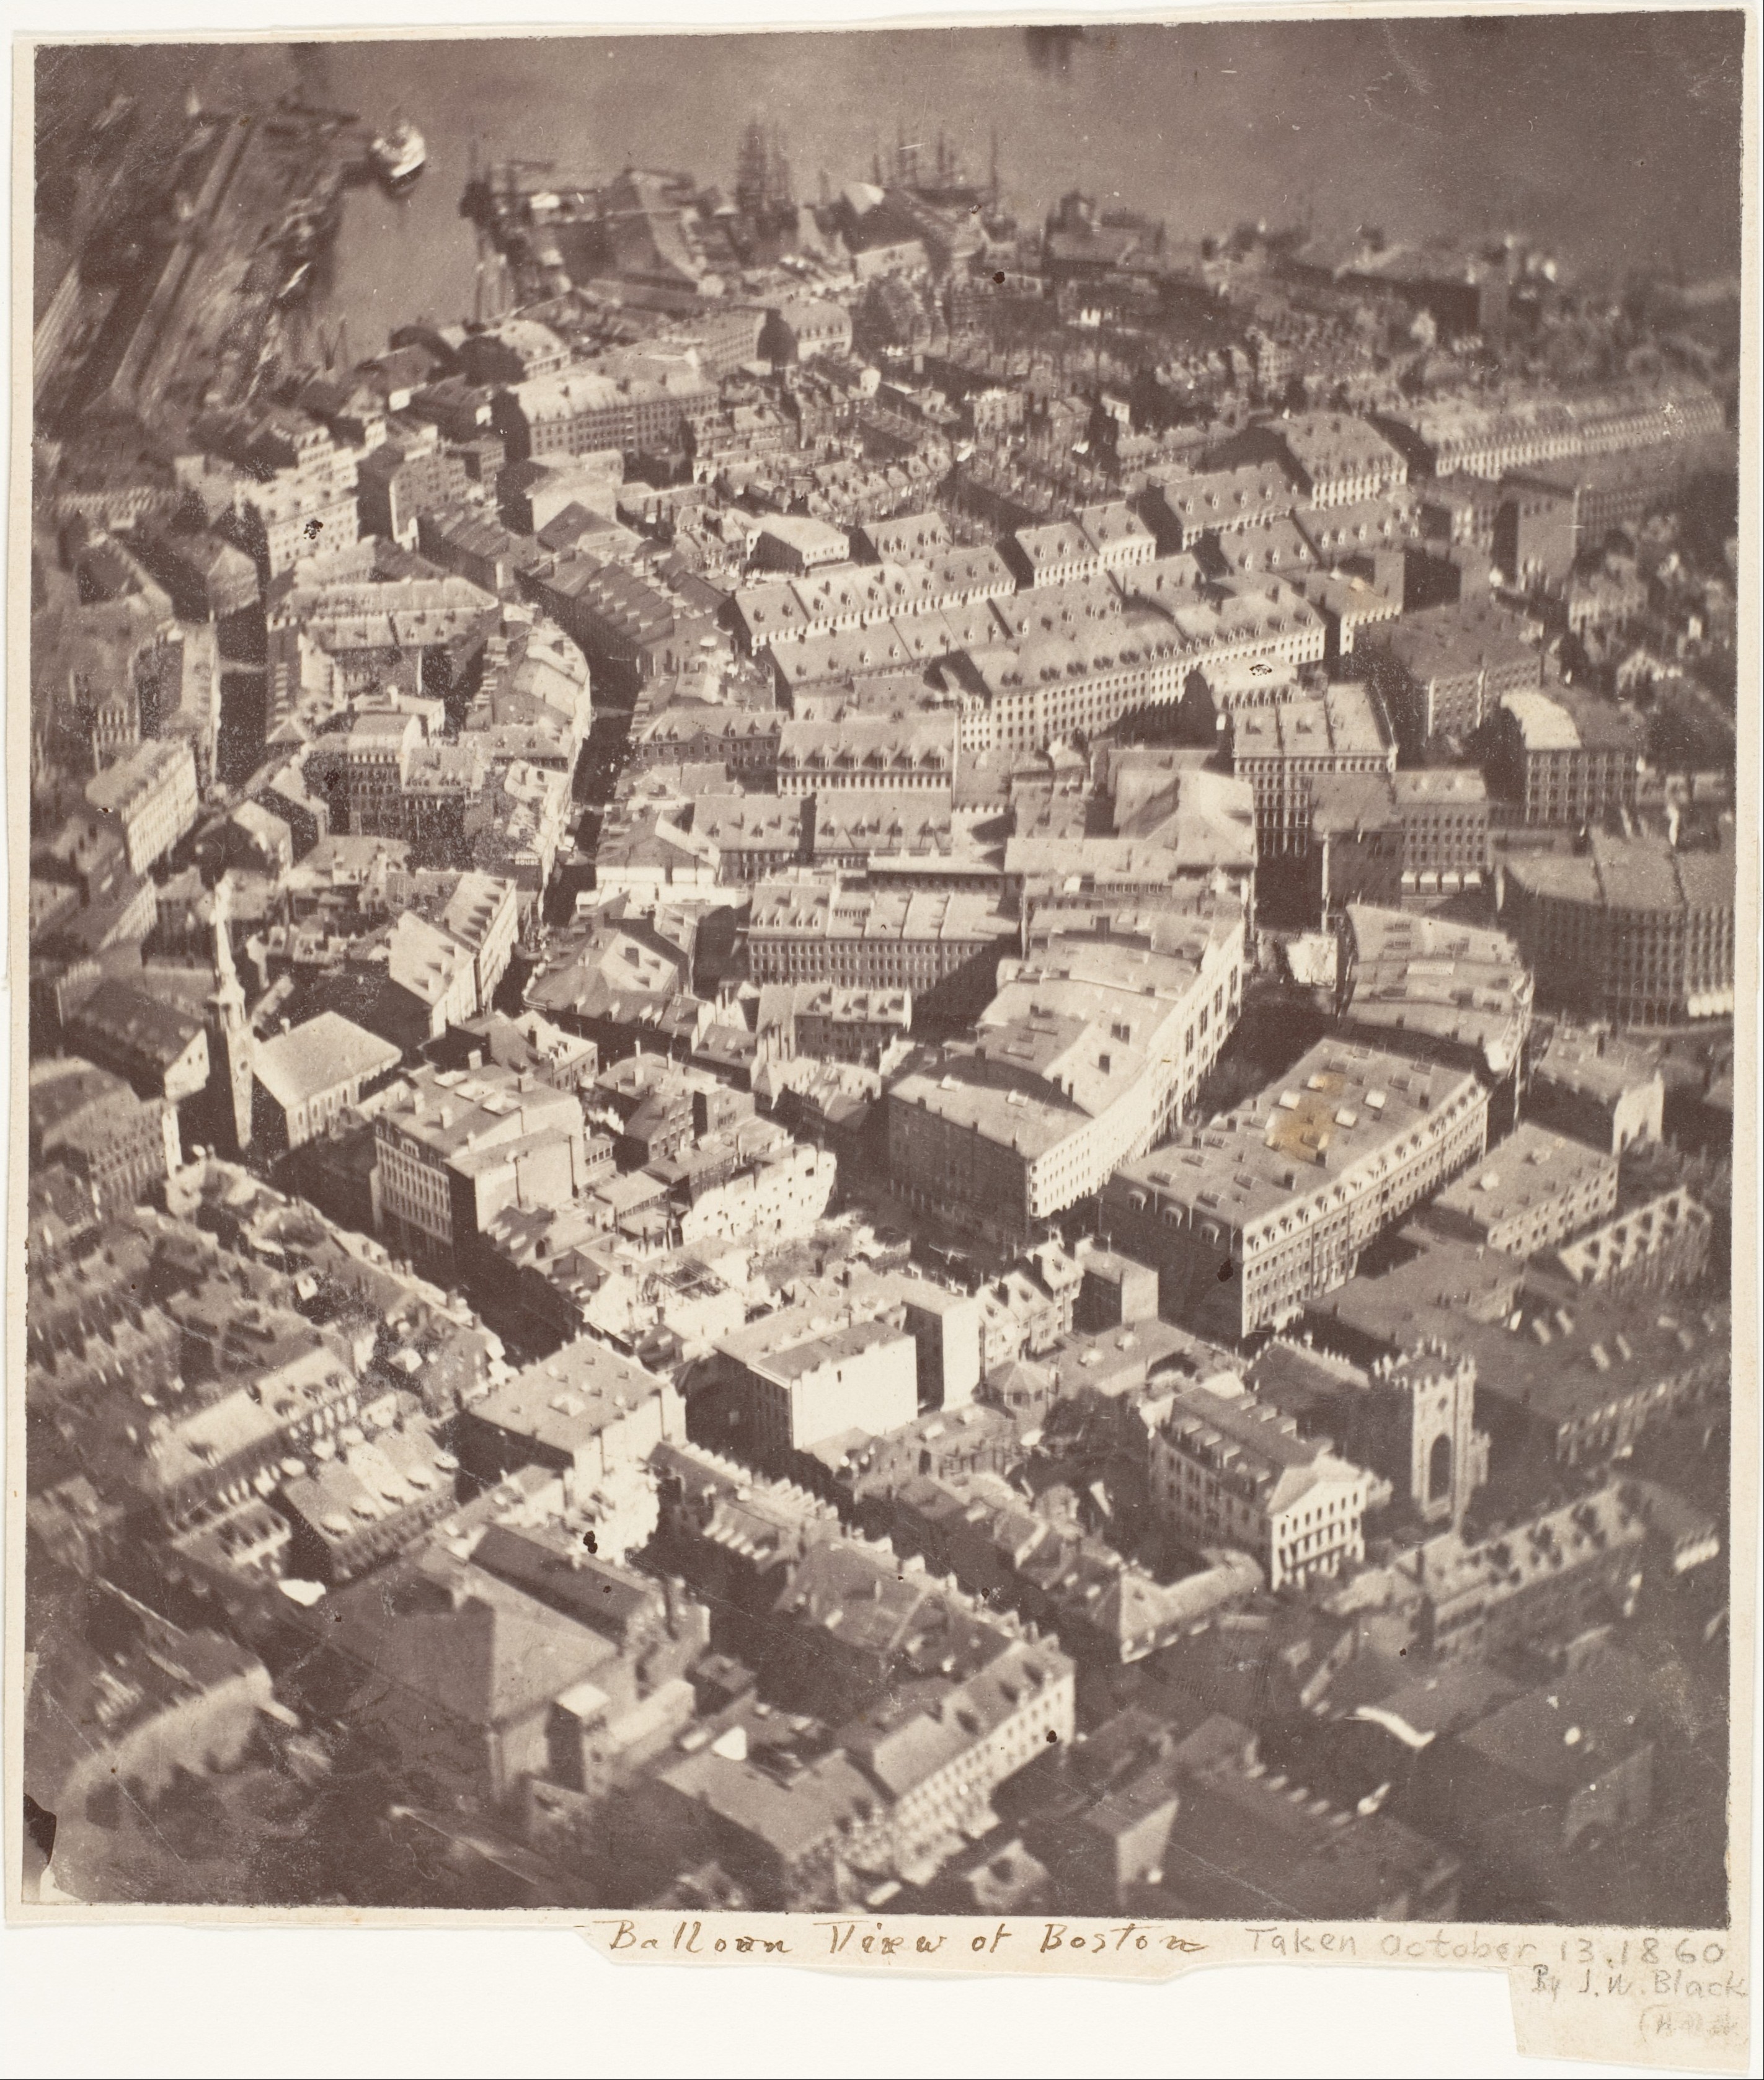
Aerial photo taken Oct.-13, 1860 Boston, MA from a balloon by J.W. Black.
The Metropolitan Museum of Art in New York houses the earliest existing aerial photo that was taken from a balloon hovering 600 meters above Boston, Massachusetts. Within a year the American Civil War broke out and this new technology became an experimental tool of war. It advanced rapidly, when air craft replaced the balloon during the First World War. Sharp photos of bombed-out battle and killing fields along the entire Western Front in France were taken by both Allied and German soldiers every day. Placing these photos on a map for efficient analyses of how a land- sea- or ice-scape changes over time, however, was impossible, because photos do not record precise locations.
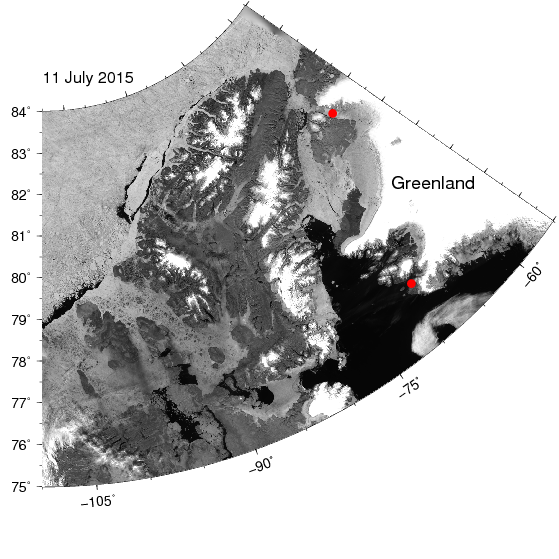
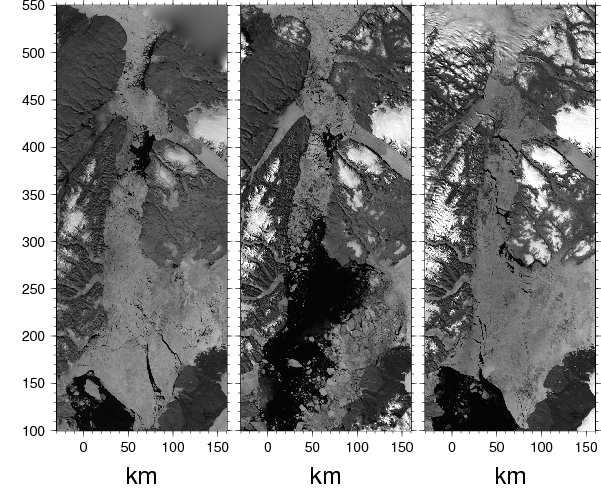
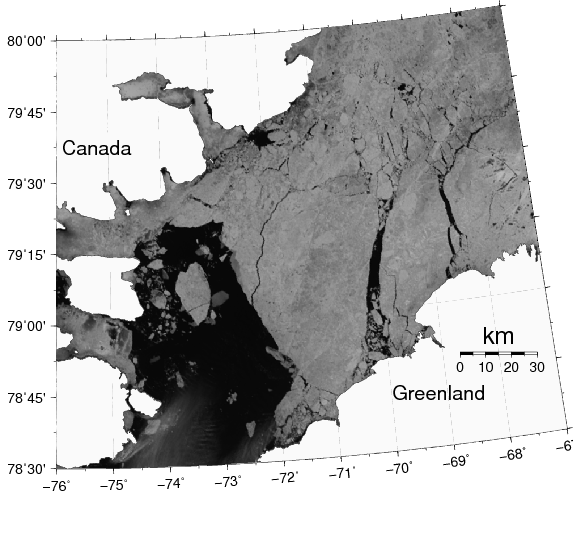
Modern satellite photos are different. We now have fancy radar beams, computers, and several Global Position Systems (GPS) with atomic clocks to instantly calculation satellite tracks every second. This is why we now can both take photos from space AND map every dot or pixel that is sensed by the satellite moving overhead at 17,000 miles an hour snapping pictures from 430 miles above. The camera is so good that it resolves the ground at about 45 feet (15 meters). This is what such a (LandSat) picture looks like
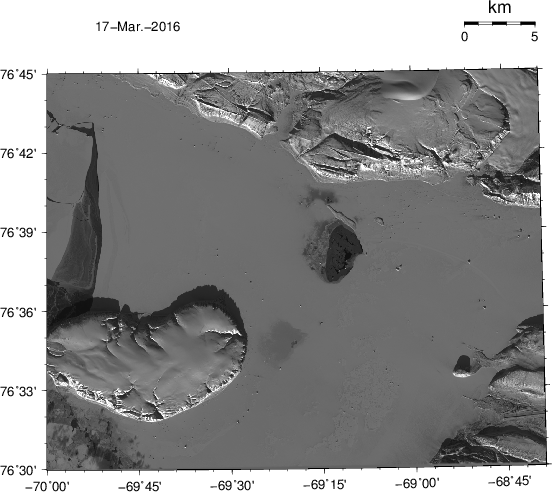
LandSat photo/map of Thule, Greenland Mar.-17, 2016. The airfield of Thule Air Force Base is seen near the bottom on the right. The island in ice-covered Westenholme Fjord is Saunders Island (bottom left) while the glacier top right is Chamberlin Gletscher.
Everyone can download these photos from the United States Geological Survey which maintains a wonderful photo and data collection archive at
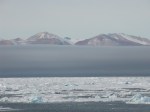
but the tricky part is to turn these images or photos into maps which I have done here. More specifically, I wrote a set of c-shell and nawk scripts along with Fortran programs on my laptop to attach to each number for the light sensed by the satellite (the photo) another two numbers (the map). These are latitude and longitude that uniquely fix a location on the earth’s surface. A “normal” photo today has a few “Mega-Pixels,” that is, a few million dots. Each scene of LandSat, however, has about 324 million dots. This is why you can discern both the runways of Thule Air Force Base at 68 degrees 45′ West longitude and 76 degrees 32′ North latitude. The pier into the ice-covered ocean is just a tad to the south of Dundas Mountain at 68:54′ W and 76:34′ N. A scale of 5 kilometers is shown at the top on the right. For spatial context, here is a photo of the pier with the mountain in the background, that is, the object shown in the photo such as mountain, ship, and Helen serves a rough, but imprecise reference:
![Dr. Helen Johnson in August 2009 on the pier of Thule AFB with CCGS Henry Larsen and Dundas Mountain in the background. [Credit: Andreas Muenchow]](https://icyseas.org/wp-content/uploads/2013/06/img_0006.jpg)
Dr. Helen Johnson in August 2009 on the pier of Thule AFB with CCGS Henry Larsen and Dundas Mountain in the background. [Credit: Andreas Muenchow]
This photo shows the airfield and Saunders Island
![Thule AFB with its airport, pier, and ice-covered ocean in the summer. The island is Saunders Island. The ship is most likely the CCGS Henry Larsen in 2007. [Credit: Unknown]](https://icyseas.org/wp-content/uploads/2013/06/thule_air_base_aerial_view.jpg)
Thule AFB with its airport, pier, and ice-covered ocean in the summer. The island is Saunders Island. The ship is most likely the CCGS Henry Larsen in 2007. [Credit: Unknown]
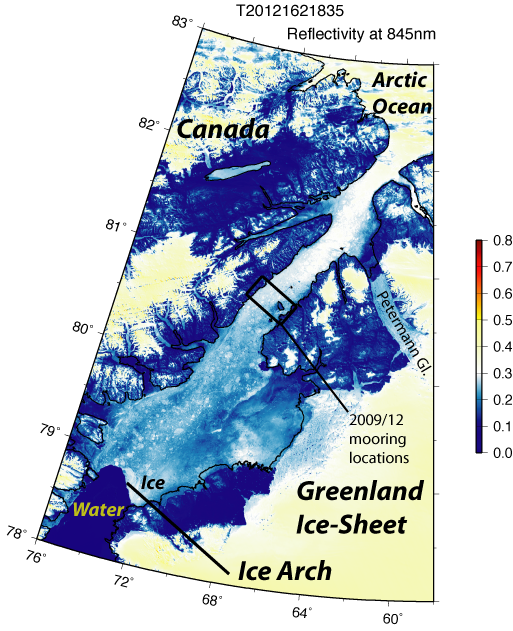
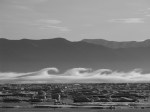
The satellite image of the ice-covered fjord with Thule, Saunders Island, and Chamberlin Gletschers shows a richly texture field of sea ice. The sea ice is stuck to land and not moving except in the west (top left) where it starts to break up as seen by the dark gray piece that shows ‘black’ water peeking from below a very thin layer of new ice. There is also a polynya at 69:15′ W and 76:39′ N just to the south of an island off a cape. A polynya is open water that shows as black of very dark patches. A similar albeit weaker feature also shows to the east of Saunders Island, but it is frozen over, but the ice there is not as thick as it is over the rest of Westenholme Fjord. I suspect that larger tidal currents over shallow water mix ocean heat up to the surface to keep these waters covered by water or dangerously thin ice. There are also many icebergs grounded in the fjord. They cast shadows and from the length of these shadows one could estimate their height. Here is another such photo from 2 days ago:

LandSat photo/map of Thule, Greenland Mar.-21, 2016. The airfield of Thule Air Force Base is seen near the bottom on the right. The island in ice-covered Westenholme Fjord is Saunders Island (bottom left) while the glacier top right is Chamberlin Gletscher.
I am using the satellite data and maps here to plan an experiment on the sea ice of Westenholme Fjord. Next year in March/April I will lead a team of oceanographers, engineers, and acousticians to place and test an underwater network to send data from the bottom of the ocean under the sea ice near Saunders Island to the pier at Thule and from there on to the internet. We plan to whisper from one underwater listening post to another to communicate over long ranges (20-50 kilometers) via a network of relay stations each operating smartly at very low energy levels. We will deploy these stations through holes drilled through the landfast ice 1-2 meters thick. The work is very exploratory and is funded by the National Science Foundation. Wish us luck, as we can and will use it … along with aerial photography that we turn into maps.


![A wobbly jet stream that separates cold Arctic air from warmer mid-latitude air. Note the strong gradients over eastern North America. [From wxmaps.org]](https://icyseas.org/wp-content/uploads/2014/11/movie-15.png)
![North-Atlantic Drift Current turning into the Norwegian Current that brigs warm Atlantic waters into the Arctic Ocean to the north of Norway and Spitsbergen. [Credits: Ruther Curry of WHOI and Cecilie Mauritzen of Norwegian] Meteorological Institute]](https://icyseas.org/wp-content/uploads/2014/02/na-moc_en_100546.jpg)