
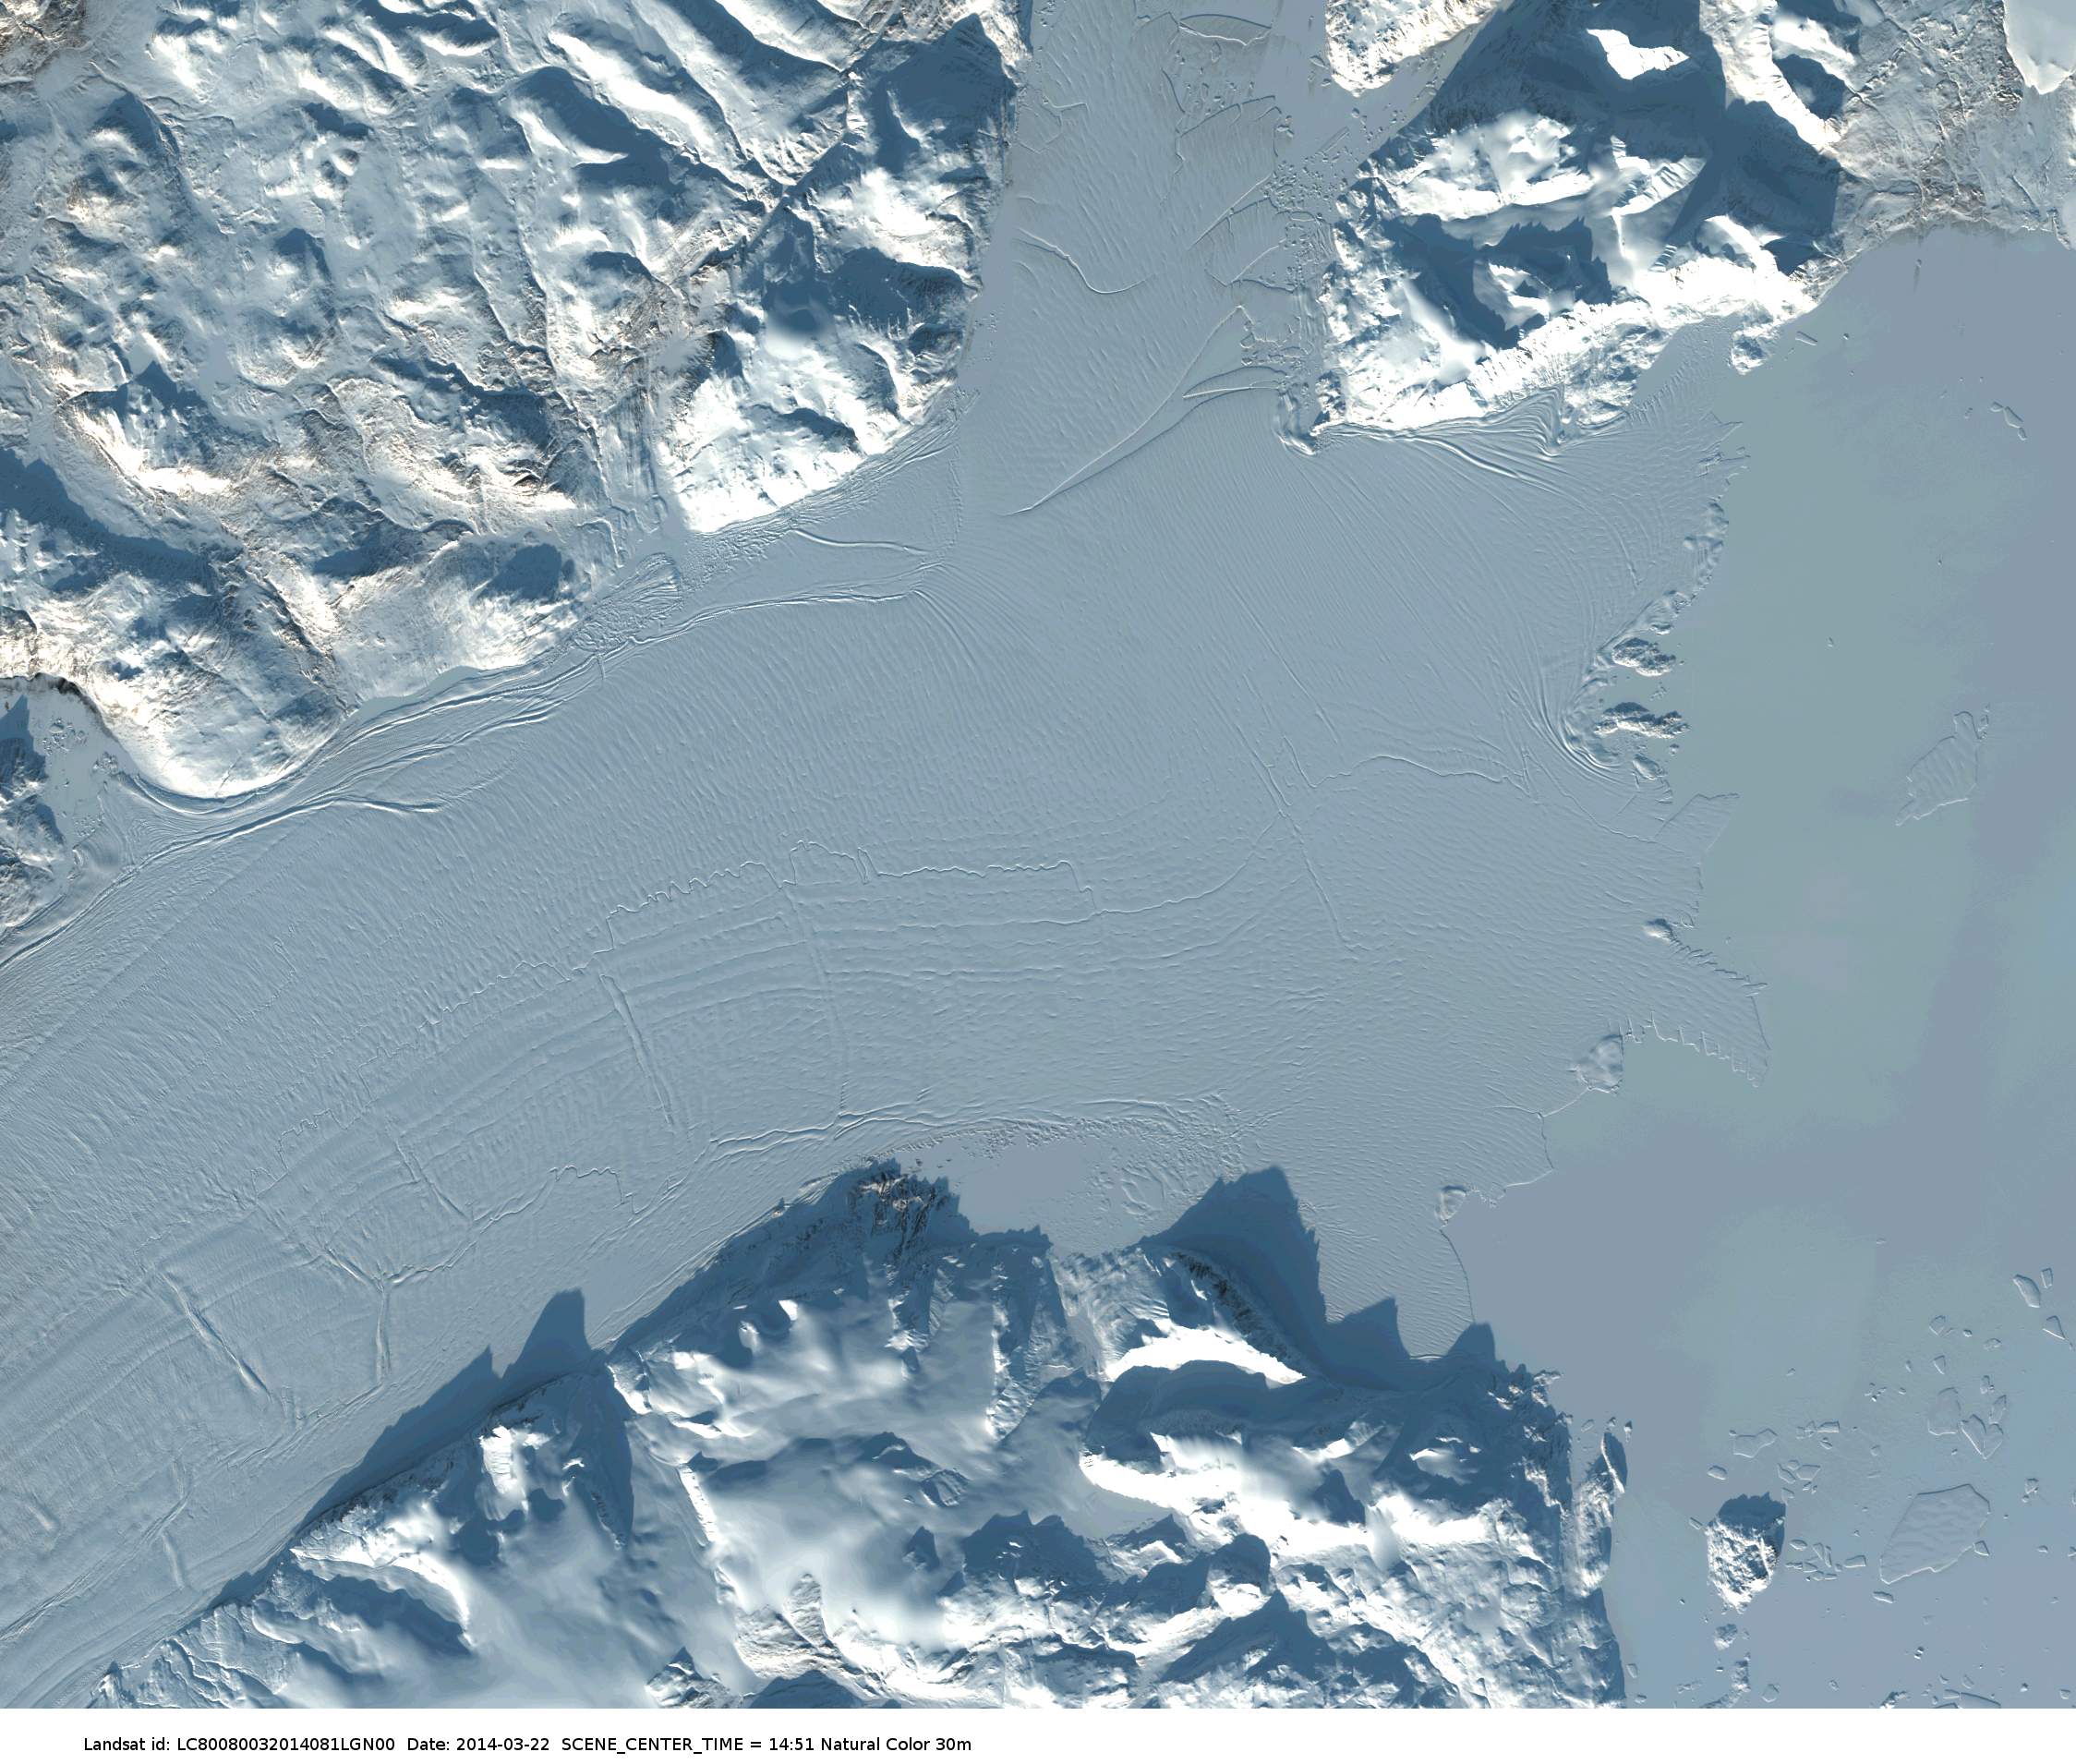
Some glaciers float on the ocean around Antarctica and Greenland. Petermann Gletscher in North Greenland is one of these. It spawned massive Manhattan-sized ice islands in 2010 and 2012. Could tides influence when and where such break-ups occur? After all, the tides under the floating glacier move the ice up and down. But how does a 50 km long, 15 km wide, and 300 m thick floating glacier pivots about its “hinge?” Does it do so like a rigid plate of steel or does it bend and buckle like jelly? I do not know, because nobody has measured the tidal motions of Petermann’s floating ice. So, one of many projects this summer will be to measure tides on Petermann with fancy GPS systems.

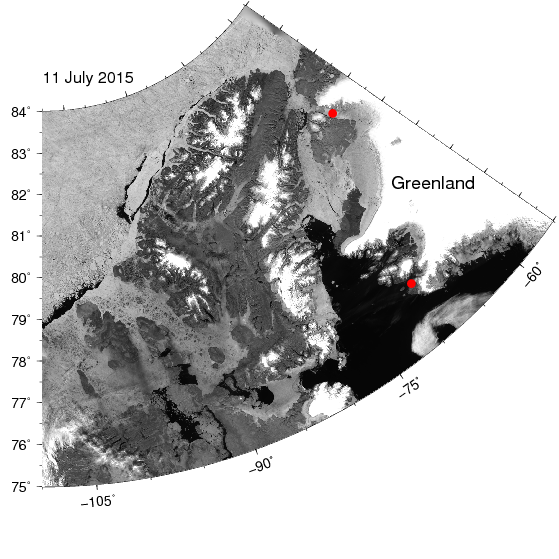
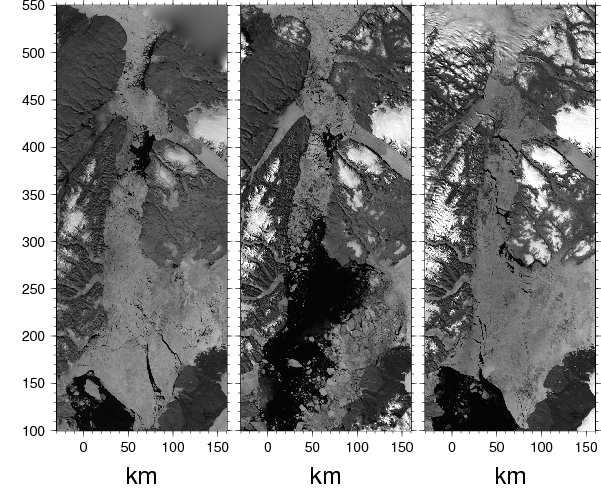
Shape of the floating portion of Petermann Gletscher from laser altimeters (right panel) along two tracks flown along the glacier in May of 2014 (left panel).
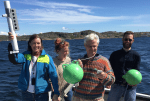
Martin Jakobsson of Stockholm University posed these questions, sort of, when he asked us American oceanographers, if we had any fancy GPS units to work with one he plans to put high on a cliff overlooking Petermann Fjord. He needs exact positions to map the bottom of the ocean. The cliff-GPS station is fixed while he moves about in a small boat that also has a GPS. Taking the difference of the raw travel times received by the cliff-GPS and the boat-GPS, he can reduce GPS position errors from several meters to several centimeters. People call this differential GPS and he wondered if we oceanographers had any use of it to perhaps give him the tidal corrections he also needs as the measures bottom depths from a boat. Well, this was not initially part of our plan and we did not get funded to study the glacier or the tides under it, but his question got me thinking while Alan Mix of Oregon State University did some organizing. One always squeezes extra science into such great opportunities. Discoveries lurk everywhere to inquiring minds.

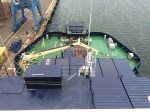
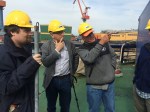
Small survey boat loaded onto I/B Oden in Landskrona, Sweden, June 2015.
Alan managed to find not one, not two, but three fancy GPS units from an organization that I had never heart of. It is called UNAVCO:
UNAVCO, a non-profit university-governed consortium, facilitates geoscience research and education using geodesy. We challenge ourselves to transform human understanding of the changing Earth by enabling the integration of innovative technologies, open geodetic observations, and research, from pole to pole.
“Geodetic observations” are measurements of locations on the earth’s surface. In the old days surveyors walked about with sextant, clocks, tripods, and optical devices to fix a location and reference it to another. Nowadays satellites and lasers do this faster, but I digress. Suffice it to say, UNAVCO is giving us 3 fancy GPS system to carry with us to Petermann Gletscher to make measurements of tides on the ice. So we can pick 3 locations on the ice where we leave these GPS for the 3-4 weeks next month. I have never done this before, so there will be lots of new learning.
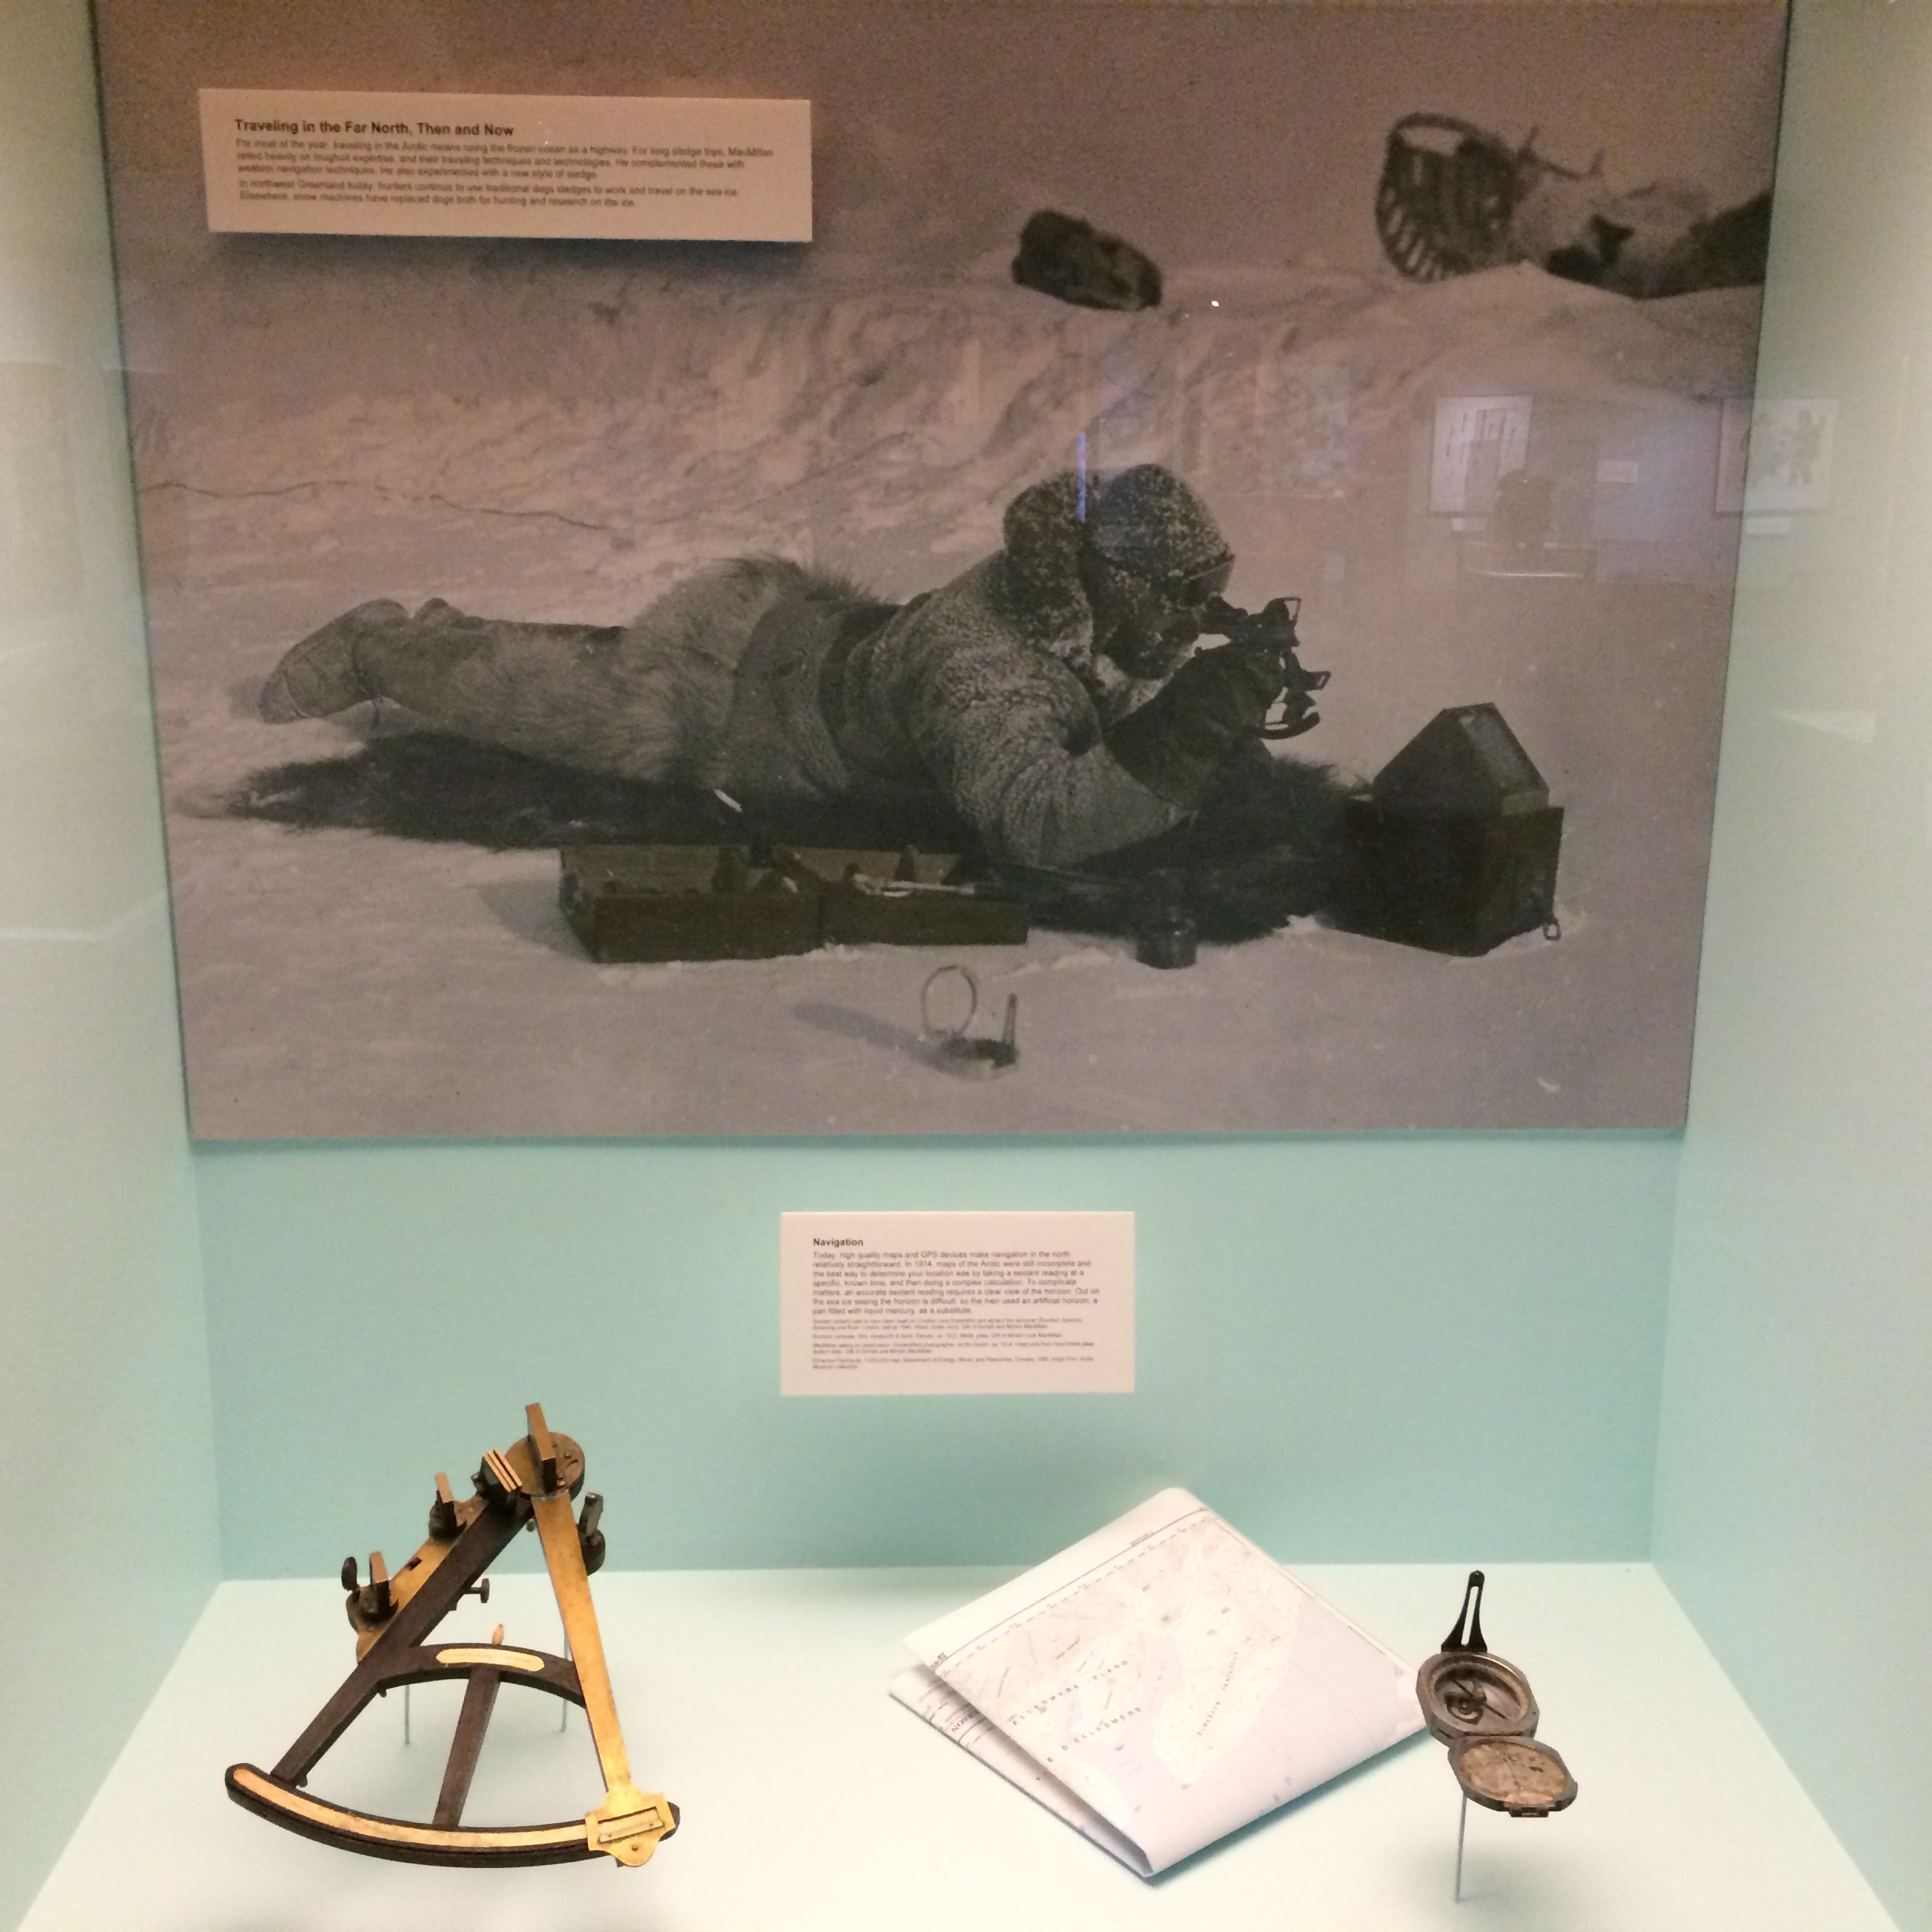
Navigation during early Arctic exploration. Photo taken during a visit of the Peary MacMillan Arctic Museeum at Bowdoin University in Brunswick, Maine.
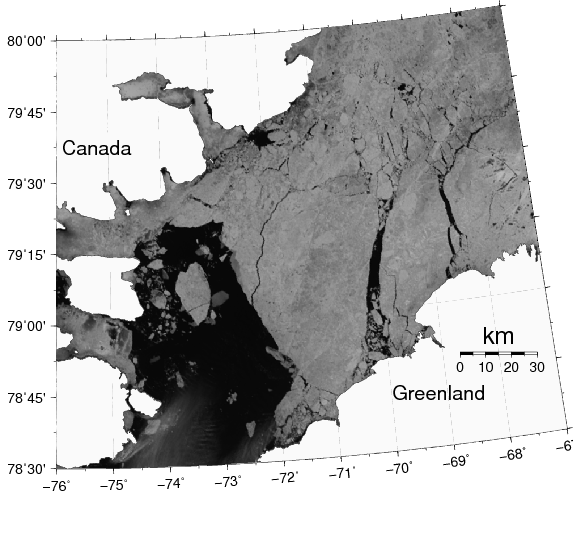
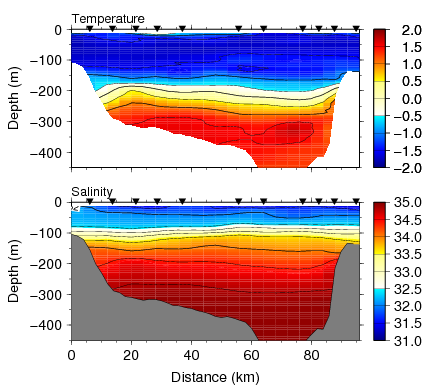
I have worked with tides since plunging my head into tidal mud-flats of north-west Germany where I grew up and camping on the shores of the Conwy Estuary in North-Wales where I collected data for my MS thesis. Below I show a 4 week record from three locations in Nares Strait where the tidal elevations range from more than 4 meters at the southern entrance to less than 2 meters in Hall Basin next to Petermann Fjord. The data are from bottom pressure sensors that were deployed for 3-9 years, but I here only want to show the spring-neap cycle. So we already have some idea on how the tides in the ocean next to Petermann Glacier behave.
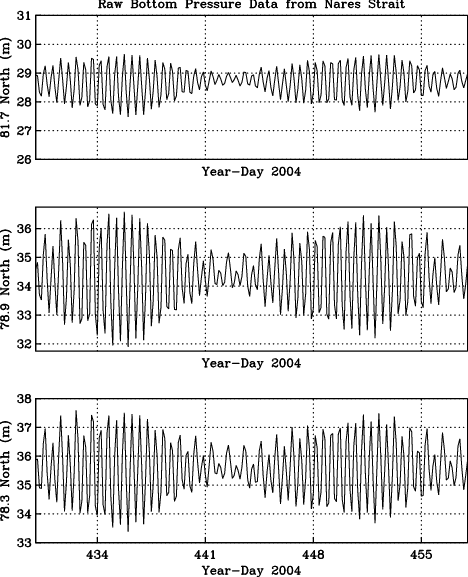
Sea level fluctuations in meters for 28 days at Discovery Harbor or Fort Conger, Canada near 81.7 N latitude (top), Alexandra Fjord, Canada near 78.9 N latiude (middle), and Foulke Fjord, Greenland near 78.3 N latitude (bottom).
Models of tides in Nares Straits do really well if, and only if, the bottom topography is known. And this is where Martin’s mapping of the ocean floor in Petermann Fjord and our tidal observations on the floating glacier come together: We both need good bottom topography, we both use fancy GPS, and we both need to know tides to get accurate bottom depths and we need to know bottom depths to predict tides.

![The author working at sea in 2003 or 2004. [Photo credit: Chris Linder, WHOI]](https://icyseas.org/wp-content/uploads/2015/03/21_andreas_en.jpg)

