In 1928 Edward H. “Iceberg” Smith took the 125 feet long Coast Guard Cutter “Marion” on an 8,100 mile journey from Boston, MA to New York City, NY via Disko Bay, Greenland. Along the way he defined operational Arctic Oceanography to explain and predict iceberg entering the busy sea lanes off North-America. The Titanic was sunk in 1912, the International Ice Patrol was formed in 1914, and LCDR Smith sailed to Greenland in 1928. The data are priceless 85 years later still. I used them to place modern observations from 2003 into a context of climate variations. First, however, let me give credit to one of the pioneers on whose scientific shoulders I stand:

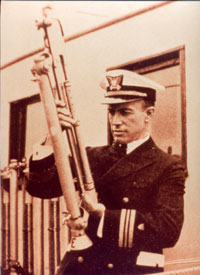
Edward H. “Iceberg” Smith of the US Coast Guard with reversing thermometer.
“Iceberg” Smith entered the Coast Guard Academy at age 21 in 1910 and served during World War I as a navigator on Atlantic convoy escort duty. After this war his ship was detailed to the International Ice Patrol and he became one of its first scientific observers at age 32 in 1921. As such he was sent for a year to Bergen, Norway in 1925 to learn the latest theories in physical oceanography. Scandinavian explorers like Nansen, Ekman, Sverdrup, Bjerknes, and Helland-Hansen defined physical oceanography at this time by applying physics on a rotating earth to phenomena that they observed from ships sailing at sea or ships frozen in Arctic ice. Much of this revolutionary work is now elementary oceanography taught in introductory courses, but then, nobody knew much about why ice and ocean move they way they do. It was time to put ideas to a thorough test which is what “Iceberg” Smith did, when he got his ship and orders to explore in 1928.
Armed with new ideas, knowledge, and the tiny USCGC Marion “Iceberg” Smith set to out to map seas between Labrador, Baffin Island, and Greenland to explain and predict the number of icebergs to enter the North-Atlantic Ocean. During his 10 weeks at sea he mapped ocean currents from over 2000 discrete measurements of temperature and salinity at many depths. This was before computers, GPS, and electronics. In 1928 this was slow to work with cold water collected in bottles with “reversing thermometers” that cut off the mercury to preserve temperatures measured in the ocean at depth to be read later aboard. Salinity was measured at sea by tedious chemical titrations. Imagine doing all of this from a rocking and rolling shallow draft cutter that bounces in icy seas for 10 weeks within fog much of the time. No radar to warn of icebergs either, and you want to study icebergs, so you move exactly where they are or where you think they are coming from. And they though that the Titanic was unsinkable.

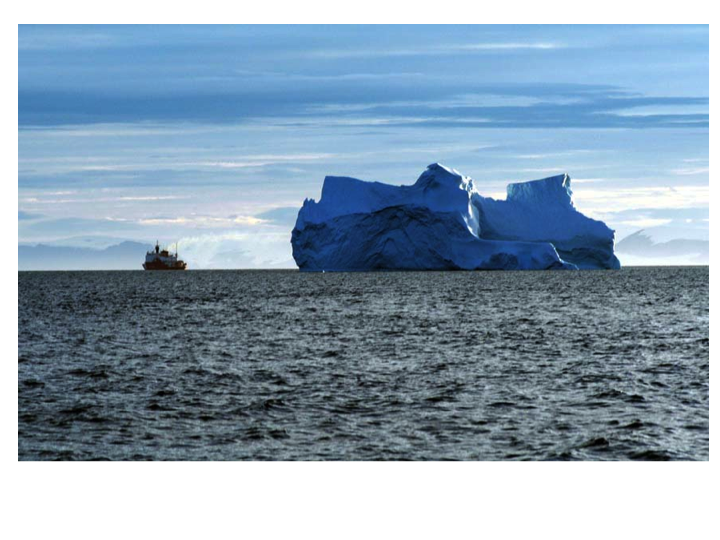
USCGC Healy in northern Baffin Bay in July 2003 with iceberg. Ellesmere Island is in the background.
The 1928 Marion Expedition was the first US Coast Guard survey in Baffin Bay while the last such expedition took place 2003. Unlike “Iceberg” Smith we then had military grade GPS, radar, and sonar systems. These sensor systems allowed me to directly measure ocean currents from the moving ship every minute continuously from the surface to about 600 meters down. Oh, we also took water samples in bottles, but temperature, depth, and salinity are all measured electronically about 24 times every second. As a result we can actually test, if the physics that had to be assumed to be true in 1928 actually are true. As it turns out, the old theory to estimate currents from temperature and salinity sections works well off Canada, but not so well off Greenland. Furthermore, we found several eddies or vortices in the ocean from the current profiling sonars.
And finally, it took Edward H. “Iceberg” Smith only 3 years to publish most of his data and insightful interpretations while I am still working on both his and my own data 85 years and 10 years later, respectively. Sure, I got more data from a wider range of moored, ship-borne, and air-borne sensors, but I do wonder, if I really consider my data and interpretations as careful and think as thorough as LCDR Smith did. Furthermore, he had no computers and performed all calculations, crafted all graphs, and typed all reports tediously by hand. I would not want to trade, but all this makes me admire his skills, dedication, and accomplishments even more.
![Dr Helen Johnson on acoustic Doppler current profiler (sonar to measure ocean velocity) watch aboard the USCGC Healy in Baffin Bay in 2003. [Photo credit: Andreas Muenchow]](https://icyseas.org/wp-content/uploads/2013/03/helen2003adcp.jpg?w=500&h=375)
Dr Helen Johnson on acoustic Doppler current profiler (sonar to measure ocean velocity) watch aboard the USCGC Healy in Baffin Bay in 2003. [Photo credit: Andreas Muenchow]
P.S.: The New Yorker has three stories on the subject published in 1938, 1949, and 1959. I eagerly await to read those.
 Smith, E. (1928). EXPEDITION OF U. S. COAST GUARD CUTTER MARION TO THE REGION OF DAVIS STRAIT IN 1928 Science, 68 (1768), 469-470 DOI: 10.1126/science.68.1768.469

![USCGC Marion built in 1927 [from http://laesser.org/125-wsc/]](https://icyseas.org/wp-content/uploads/2013/03/marion.jpg)
![Iceberg in the fog off Upernarvik, Greenland in July of 2003. [Photo Credit: Andreas Muenchow]](https://icyseas.org/wp-content/uploads/2013/03/helen2003upernarvik.jpg)
![Dr Helen Johnson on acoustic Doppler current profiler (sonar to measure ocean velocity) watch aboard the USCGC Healy in Baffin Bay in 2003. [Photo credit: Andreas Muenchow]](https://icyseas.org/wp-content/uploads/2013/03/helen2003adcp.jpg)
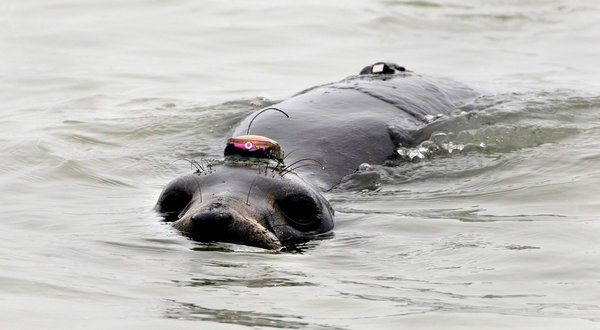
![Elephant seal off Antarctica with ocean sensor transmitting data via satellite [Credit Lars Boehme]](https://icyseas.org/wp-content/uploads/2013/03/seal-one-credit-lars-boehme.jpg)
![CCGS Henry Larsen in thick and multi-year ice of Nares Strait in August 2009. View is to the south with Greenland in the background. [Photo Credit: Dr. Helen Johnson]](https://icyseas.org/wp-content/uploads/2012/06/rimg0129.jpg)


![Sketch of the biological pieces that a large area of open water near a fixed ice edge like that of a polynya may support. [From Northern Journal>/a>]](https://icyseas.org/wp-content/uploads/2013/03/polynya.jpg)
![RadarSat imagery of eastern Baffin Island (bottom, right), western Greenland (top, right), and Nares Strait with Petermann Fjord (top, left) with pieces of Petermann and Ryder Ice Islands identified. [Credit: Luc Lesjardins, Canadian Ice Service]](https://icyseas.org/wp-content/uploads/2013/01/ice-island-overview-25-27-jan-2013.jpg)

