Tag Archives: Greenland

Greenland Glacier Ocean Warming

The Swedish icebreaker Oden will visit Petermann Fjord in northern Greenland in 6 months time. The US National Science Foundation (NSF) funded a large geophysical and geological experiment after excruciating peer-review over a 4-year period. The experiment shall reveal climate histories from sediment cores, geomagnetics, and both bottom and sub-bottom sonar profiling. Besides this main mission Oden also supports several smaller auxiliary projects some of which are funded by NSF while others are not. It will be a fine collaboration between Swedish and American scientists working together in perhaps one of the most difficult to reach and beautiful places on earth.
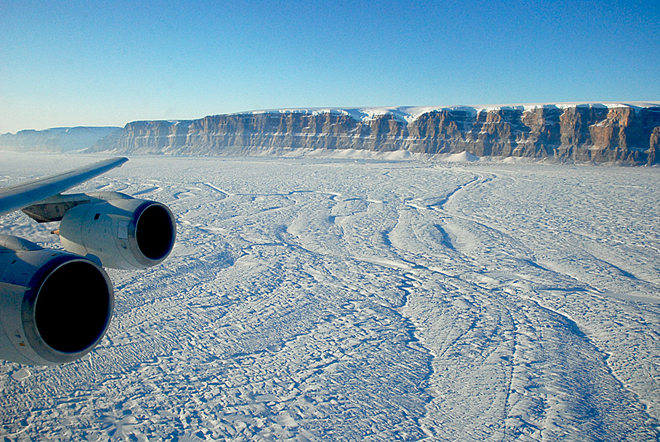
Seaward front of Petermann Glacier Aug.-11, 2012. View is from a small side-glacier towards the south-east across Petermann Fjord with Petermann Gletscher to the left (east). [Photo Credit: Erin Clarke, Canadian Coast Guard Ship Henry Larsen]

Seaward front of Petermann Glacier Aug.-11, 2012. View is from a small side-glacier towards the south-east across Petermann Fjord with Petermann Gletscher to the left (east). [Photo Credit: Erin Clarke, Canadian Coast Guard Ship Henry Larsen]

I will aboard the ship to deploy sensors some of which exist and are funded while others are neither. Let me outline first the funded part and then part where you the reader and I can perhaps join forces. First, we will test first elements of an underwater acoustic communication system. Think cell-phones, except the phone towers are under water where they are called modes. The modems talk to each other by sending sound back and forth the same way that whales do talk to each other.

Here is a narwhals sound

that you can use as a ringtone, credit goes to Voices of the Sea web-site at Scripps Institution of Oceanography. These whales visit Petermann Fjord in summer and we saw many of them frolicking in August of 2012 when I visited the area with the Canadian Coast Guard whom I credit for these photos:

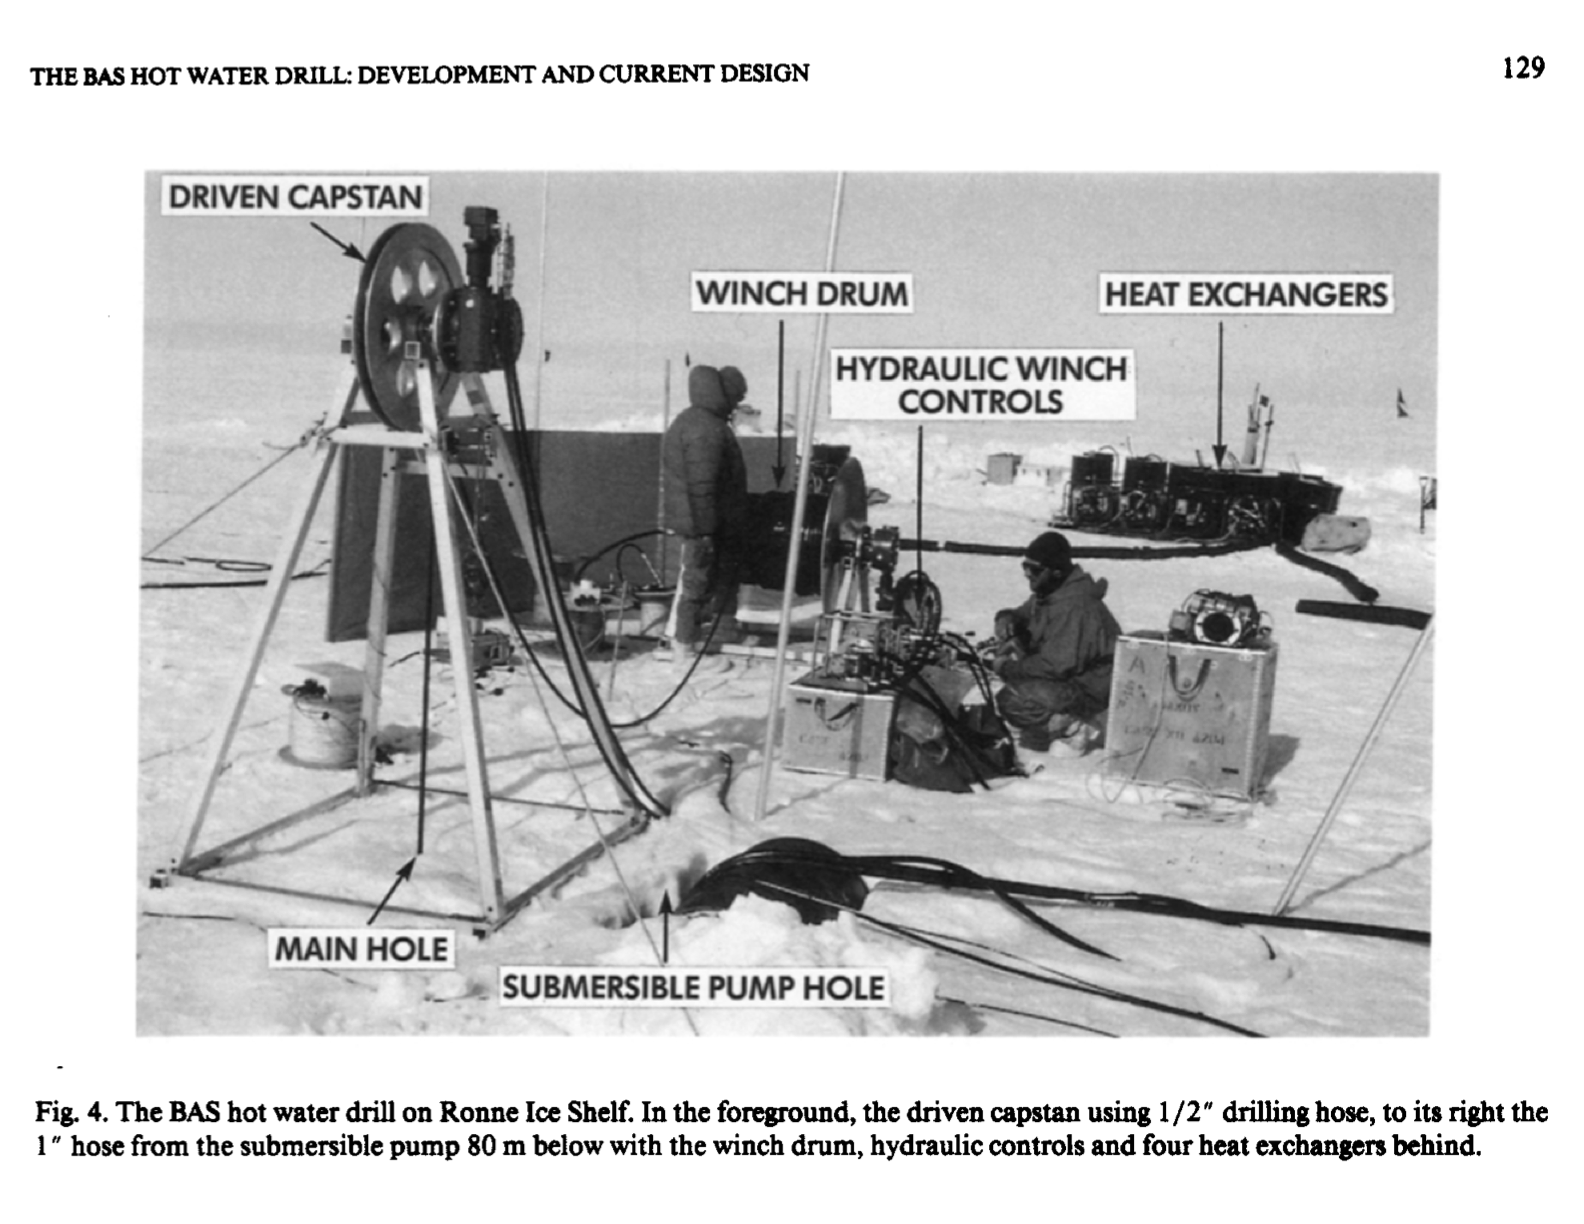
Our man-made sound is very quiet, but because it is quiet, it only moves 3-10 km through the water. To increase our range, we plan to install several quiet sound sources that whisper from one water-phone (=hydrophone) to the next. The goal is to get data from ocean sensors moved along this whispering system of underwater “cell phones” to reach a listening station that we plan to install at the edge of Petermann Gletscher’s floating ice shelf. The ice is 200 meters or 600 feet thick and it is not trivial to drill through that much ice, but it can be done, and the British Antarctic Survey is aboard with a team of experts to do so to get sediment cores from the bottom below the ice:

Makinson1993-Fig04

Today I ordered a first cable that will connect the underwater modem hanging under the 200-m thick ice to the surface where a fancy computer connects it to the internet via to a satellite phone. All data calls that the underwater listening station receives will move up the cable to the glacier surface and on to us all via the internet. This challenging engineering project is funded, but I like to use the same hole, computer, and satellite link to get additional ocean and air data.

Additional stations will be drilled through the ice-shelf farther inland to reach the ocean also. Here we also need cables and instruments that tells us how the glacier is melted by the ocean at different location along its 50 km long floating ice shelf. The incremental costs are small relative to the cost of getting a ship and helicopters there, but NSF cannot easily fund small projects rapidly. It takes a long time to pass scientific peer review. This is where you, my dear reader come in: I need your help to raise $10,000 to add science and observations to an engineering feasibility study that is the underwater whispering sound system.

The motivation and details are described with videos, pictures, laboratory notes, plots, ideas, as well as some short, quirky, yet technically correct descriptions at the crowd-funding site

https://experiment.com/projects/ocean-warming-under-a-greenland-glacier.

I created and launched it today, it will be up for 30 more days. If you can and if you like the science, work, and fun that I describe on these pages, please consider making a small donation. You have the power to make this happen and I will share all data both from below and above the ocean and glacier surface with you.

As a physicist, gardener, teacher, writer, traveler, ping-pong player, and geocacher I am naturally curious about both our natural and social world. I love experiments and to me the crowd-funding at Experiment.com is a most enjoying experiment to connect to people in a new way. Full disclosure, however, this company takes 8% of all funds generated to supports its wonderful software and staff. Perhaps you like to join this experiment by spreading the word and, if you can afford it, help pay for some of the technology needed to bring Greenland and its mysteries to everyone who wants to connect to it.

Glaciers, Geocaching, and Greenland Goals

I thought it silly when my wife suggested to go geocaching with her. She told me it was to hunt for treasures and as a professor of physical ocean science and engineering this was not for me. But my wife is persistent, I am curious, and when she explained that a GPS, hiking, and computer mapping was involved, I gave it a try and have been hooked ever since. My first geocaching hiking trip took place on Anacortes Island, Washington in 2013 where our youngest son then lived. Here we are walking past rock carved 10,000 years ago by a tiny glacier at N 48° 29.498 W 122° 41.799 N that discharged ice into Puget Sound:

Glacier carved outcrop in Washington Park, Anacortes Island, WA.

Glacier carved outcrop in Washington Park, Anacortes Island, WA.

Since this first geocaching trip, I have found more than 200 geocaches in places small and remote and places large and urban. The treasure is in the walking and trying to find a path towards a destination, but the destination is secondary as many discoveries are made along the way.

This often happens in science also. One needs to know a destination, have a goal, formulate a hypothesis, but much science, learning, and discovering happens along the path towards that goal. With a GPS the destination is easy, it is a fixed point on earth, but it is harder in science. It can be useful to roam widely, but a set of intermediate goals can help to stay focused. For example, I want to understand how Greenland will change as we warm the earth. That’s a big question with impacts on floods in Europe, storms in the Americas, and rising sea level everywhere. This is a 100-year problem that many people work on; so my personal goal is to focus on how the oceans melt glaciers from below. This is a 10-year problem. It is a step towards the larger goal, but 10 years is still long even though I work with people in Germany, Canada, Denmark, England, Sweden, and Norway:

View to the south on the climb down from Tromsdalstinen.

View to the south on the decent from Tromsdalstinen on a geocaching trip in 2014 out of Tromso, Norway.

The photo above was made during one of my geocaching trip in northern Norway. Three physical oceanographers had gotten off the ship after they deployed ocean current measuring devices off eastern Greenland near a larger ice sheet. The experiment was designed to measure the ocean heat and its movement towards two large outlet glaciers. One has a wide and stable floating ice shelf, Nioghalvfjerdsfjorden (79N Glacier) while Zachariae Isstrom a few miles south lost its wide, long, and apparently unstable ice shelf that still shows in this 2002 image:

North-east Greenland: 79N Glacier and Zachariae Isstrom in 2002.

North-East Greenland in 2002 when both 79N Glacier (near 79 30′) and Zachariae Isstrom (near 79 00′) had extensive ice shelves (black areas are open ocean).

It puzzles me how two adjacent glaciers can and do behave so differently. If we understand how Greenland is melting, then we should explain the difference convincingly, but I am still looking for people who can. Lots of theories, lots of ideas, and lots of modeling, but there are not many observations to make the skimpy and often contradictory evidence convincing. And this finally leads me to my last point and the goal that I set for myself for the next 5-10 years:

I like to measure the ocean, the ice, and the air above and below floating glaciers via a small network of sensors. Now that two large ice islands spawned at Petermann Gletscher in 2010 and 2012, I believe that the remaining ice shelf will stay largely put for the next few years, that is, move at 1 km per year towards Nares Strait:

Petermann Gletscher through calving events. White lines show ICESat tracks; red (ambient ice shelf) and blue (central channel) show repeat-track airborne surveys.

Petermann Gletscher through calving events. White lines show ICESat tracks; red (ambient ice shelf) and blue (central channel) show repeat-track airborne surveys.

The hardest part in reaching this goal is to get measurements from under the 200-600 meter thick ice. This requires holes drilled through the glacier, it requires ocean sensors to be lowered into the water below the glacier, and it requires connections to relay data back to the surface at all hours for many year. I  perhaps have a first chance towards this goal when the Swedish icebreaker Oden will work for a month in Petermann Fjord this year. People from the British Antarctic Survey will be aboard and they plan to drill holes for other scientific purposes. When they are done, the holes freeze over, unless someone (me, me, me, please, pretty, pretty please) has instruments to put in there. I just word that I will be aboard the ship as well and I am feverishly working towards this goal with much help from others. More on this in later posts. All science is a group effort.

I close with a photo to show how the ice-covered ocean of Petermann Gletscher looks during the polar day. Would it not be great to know the temperature of the water below and the air above this more than 200 meter thick glacier ice at all times posted for everyone to use with an internet connection?

March-24, 2010 view of Petermann Glacier from NASA's DC-8 aircraft. Photo credit goes to Michael Studinger of NASA's IceBridge program.

March-24, 2010 view of Petermann Glacier from NASA’s DC-8 aircraft. Photo credit goes to Michael Studinger of NASA’s IceBridge program.

East Greenland Current Instabilities

The coast off north-east Greenland is a grey, cloudy, and icy place. I spent 4 weeks on a ship earlier this summer to place sensors on the ocean floor to measure water currents, salinity, and temperature. The data shall uncover the mystery of how ocean heat 300 m below the surface gets to glaciers to melt them from below year round. My contribution is a small part of a larger effort by German, Norwegian, Danish, American, and British scientists to reveal how oceans change glaciers and how oceans impact Greenland’s ice sheet, climate, and weather.

So, for months now I am watching rather closely how this ocean looks from space. Usually it is cloudy with little exciting to see, but for 4 days this week the clouds broke and displayed a violently turbulent ocean worthy of a Van Gogh painting:

Satellite image ocean current instabilities on Aug.-19, 2014 as traced by ice along the shelf break, red lines show 500, 750, and 1000 meter water depth. Small blue triangles top left are ocean moorings.

Satellite image of ocean current instabilities on Aug.-19, 2014 as traced by ice along the the shelf break, red lines show 500, 750, and 1000 meter water depth. Small blue triangles top left are ocean moorings.

A wavy band of white near the red lines indicates the East Greenland Current. The red lines show where the water is 500, 750, and 1000 m deep. All waters to the left (west) of the red lines are shallow continental shelf while all waters to the right (east) are deep basin. Some islands and headlands of Greenland appear on the left of the image as solid grey. The image covers a distance about the same as from Boston to Washington, DC or London to Aberdeen, Scotland. Black areas are ocean that is clear of ice while the many shades of white and gray are millions of ice floes that act as particles moved about by the surface flow. Using a different satellite with much higher resolution shows these particles. The detail is from a tiny area to the north-west of the red circle near 77.5 North latitude:

Individual ice particles as seen on the north-east Greenland shelf from LandSat 15-m resolution from Aug.-21, 2014 near 77.5N and 10 W.

Individual ice particles as seen on the north-east Greenland shelf from LandSat 15-m resolution from Aug.-21, 2014 near 77.5N and 10 W.

Strongly white areas indicate convergent ocean surface currents that concentrate the loose ice while divergent ocean currents spread the ice particles out in filaments and swirls and eddies.

This is how many real fluids look like if one takes a snapshot as satellites do. Stringing such snapshots together, I show the fluid motion as comes to life for about 3 days:

Output

Notice how the large crests seaward of the red line between 74 and 75 North latitude grow and appear to break backward. This is an instability of the underlying East Greenland Current. It starts out as a small horizontal “wave,” but unlike the waves we watch at the beach, the amplitude of this “wave” is horizontal (east-west) and not vertical (up-down). The mathematics are identical, however, and this is the reason that I call this a wave. As the wave grows, it become steeper, and as it becomes too steep, it breaks and as it breaks, it forms eddies. These eddies then persist in the ocean for many weeks or months as rotating, swirling features that carry the Arctic waters of the East Greenland Current far afield towards the east. The East Greenland Current, however, continues southward towards the southern tip of Greenland. The wave and eddy processes observed here, however, weaken the current as some of its energy is carried away with the eddies.

I could not find any imagery like this in the scientific literature for this region, but similar features have been observed in similar ocean current systems that transport icy cold waters along a shelf break. The Labrador Current off eastern Canada shows similar instabilities as does the East Kamchatka Current off Russia in its Pacific Far East. And that’s the beauty of physics … they organize nature for us in ways that are both simple and elegant, yet all this beauty and elegance gives us complex patterns that are impossible to predict in detail.

Beszczynska-Möller, A., Woodgate, R., Lee, C., Melling, H., & Karcher, M. (2011). A Synthesis of Exchanges Through the Main Oceanic Gateways to the Arctic Ocean Oceanography, 24 (3), 82-99 DOI: 10.5670/oceanog.2011.59

LeBlond, P. (1982). Satellite observations of labrador current undulations Atmosphere-Ocean, 20 (2), 129-142 DOI: 10.1080/07055900.1982.9649135

Solomon, H., & Ahlnäs, K. (1978). Eddies in the Kamchatka Current Deep Sea Research, 25 (4), 403-410 DOI: 10.1016/0146-6291(78)90566-0

Men and Women on the Edge 1

EDIT: Original post was too long and rambling. One advice by wise female council, I decided to turn this into two separate posts. This is the first. July 5, 2014.

The “Quiet American” is not a popular book in the United States of America, but to me it described the dilemma and dangers of being American very well. Continue reading

Icebergs, Islands, and Instruments off Isle de France, North-East Greenland

Leaving all land behind when FS Polarstern sailed for Greenland almost 2
weeks ago, we saw land again for a few hours last Sunday. A small
ice-capped island called Isle de France was ahead of us. Solid ice was to
the west, Continue reading