Tag Archives: Greenland

First steps to Greenland

I am on my way to northern Greenland and just arrived badly time-lagged in Diez near Frankfurt from Philadelphia. Together with fellow scientists and technicians from Germany, Poland, and Canada, Continue reading

North Greenland Glacier Ice-Ocean Interactions 2014

I will travel to Spitsbergen in six weeks to board the German research icebreaker Polarstern. She will sail west across Continue reading

Fram Strait Ice, Oil, and Glaciers

Tomorrow I fly to Germany to prepare for an ocean experiment in the shallow waters off northern Greenland. Together with oceanographers from the Alfred Wegener Institute (AWI), Germany, I hope to deploy Continue reading

Petermann Gletscher Thawing and Thinning

Greenland’s tidewater glaciers are losing mass, through thinning and retreat, at an increasing rate. Greenland’s glaciers located north of 78 North latitude often end in ice shelves, floating extensions of the glaciers extending up to several tens of km into the adjacent fjords. While most ice shelves of North Greenland have been relatively stable, Petermann Gletscher lost more than 40% of its ice shelf area (36 giga tons) during two major calving events in 2010 and 2012. What remains of Greenland’s ice shelves is threatened by a changing climate, because both regional air and ocean temperatures continue to increase while Arctic sea ice cover continues to decline.

Petermann Gletscher through calving events. White lines show ICESat tracks; red (ambient ice shelf) and blue (central channel) show repeat-track airborne surveys.

Petermann Gletscher through calving events. White lines show ICESat tracks; blue (ambient ice shelf) and red (central channel) show repeat-track airborne surveys.

Using lasers and ice sounding radars aboard NASA planes (Operation IceBridge) as well as lasers on a now defunct satellite (ICESat), oceanographer Laurie Padman, glaciologist Helen A. Fricker, and I just passed peer-review with a study that estimates how much Petermann Gletscher has shrunk and melted over the last decade or so. The quick answer is about 5 meters per year:

(top) Change in ice thickness from 2007 to 2010 from repeat airborne missions. (middle) along-track mean thickness. (bottom) steady-state melt.

(top) Change in ice thickness from 2007 to 2010 from repeat airborne missions. (middle) along-track mean thickness. (bottom) steady-state melt.

In our study we distinguished between 1. a thinning of the floating ice shelf that moves along the glacier as new ice moves from the Greenland ice sheet on land out into the ocean and 2. a non-steady thinning at fixed locations as time passes. The situation is somewhat similar to the flow through a pipe (or river, if you wish) with a constriction. If the same amount of water entering the pipe comes out at the other end, then the flow has to speed up where the pipe becomes narrow. A floating glacier is not quite like water flowing through a pipe, because the ocean underneath and the air above can melt ice making the floating ice shelf thinner as it flows along. If the ice thickness changes along the floating glacier, then melting must take place for a glacier moving seaward at a constant rate. The ice thickness changes along the glacier, but stays constant at a fixed location. This is the steady-state melt.

The non-steady state thinning is the change in ice thickness at a fixed point observed at different times. We estimated this from observations taken along exactly the same tracks that the NASA aircraft flew in 2007 and 2010 before the break-up of Petermann Gletscher. Prior studies could not measure this, because the tracks were not the same or because the signal processing was not up to the task. We find that both the steady and the non-steady contribution is about 5 m per year each. These rates do not vary much between a thin central channel or a thick ambient ice shelf. This came as a little bit of a surprise, because the central channel is often also refered to as a “melt channel,” but it actually melts no different from any other section of the ice shelf. So, the question remains as to what causes the central and many other channels to be there in the first place. The place to look, I feel, is the area where the bed rock, the glacier ice, and the Arctic Ocean meet in what is called the grounding zone. It is here that the gigantic forces of water and ice pulverize rock while a mixture of rock and pressurized water is sand-blasting the ice. Talking about a rock and a hard place …

Our study will appear later this year in the Journal of Glaciology, but pre-prints can be downloaded here. The U.S. tax-paying public funded this study via grants that we received from NASA and NSF. They also funded substantial efforts to make sure, that all data reside in the public domain accessible to anyone anywhere.

Münchow, A., Padman, L., and Fricker, H.A. (2014). Interannual changes of the floating ice shelf of Petermann Gletscher, North Greenland from 2000 to 2012, Journal of Glaciology, in press

Johnson, H., Münchow, A., Falkner, K., & Melling, H. (2011). Ocean circulation and properties in Petermann Fjord, Greenland Journal of Geophysical Research, 116 (C1) DOI: 10.1029/2010JC006519

Rignot, E., & Steffen, K. (2008). Channelized bottom melting and stability of floating ice shelves Geophysical Research Letters, 35 (2) DOI: 10.1029/2007GL031765

Formation of Nares Strait Ice Bridges in 2014

Darkness and cold covers North Greenland, Ellesmere Island as well as Nares Strait, the waterway that connects these two inhospitable places. And despite the darkness of the polar night, I can see that three beautiful arches made of ice connect Greenland to Canada. It is possible to walk across water, if the water is frozen. Stuck to land, ice arches or ice bridges shut down ice motion while the ocean under the ice keeps moving. Lets have a peek at how this looked from space yesterday:

Ice arches of Nares Strait on January 26, 2014 from MODIS thermal imagery.

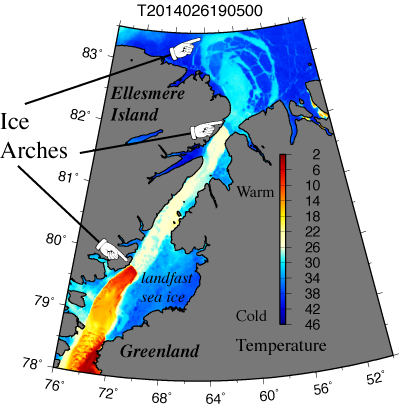
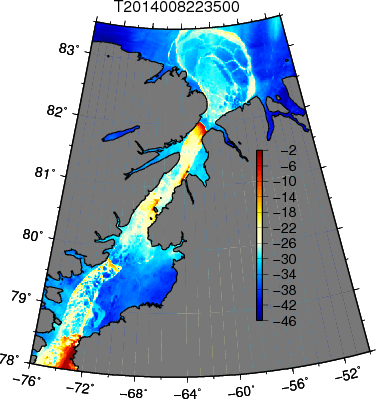
Ice arches of Nares Strait on January 26, 2014 from MODIS thermal imagery. Surface temperatures in degrees Celsius are all below zero despite the missing “-” sign stripped by Adobe Illustrator.

The colors above show the temperature that satellite sensors “see” at the surface of the ice. Red is warm, blue is cold, and grey is land, but “warm” here is still below the freezing point of sea water near -2 degrees Celsius, so even the red or “hot” spots are covered by ice. The 300 deep ocean in Nares Strait generally flows from north to south without trouble under the ice, but just behind the fixed arching ice bridges, it sweeps the newly formed thin ice away to the south. The “warm” spots that form to the south of each ice arches have their own stories:

Farthest to the north a massive ice arch spans almost 200 km (150 miles) across. It faces the open Arctic Ocean to the north and it formed a few days before Christmas 4-5 weeks ago. It was still shedding large ice floes from its edge as it tried, and finally succeeded, I think, to find a stable location. Nevertheless, one of its larger pieces of ice moved into Nares Strait on January-3, 2014 where it became stuck on both Greenland and Ellesmere Islands:

The large floe from the edge of the first ice arch becames firmly lodged on both sides of the 30-km wide entrance to Nares Strait on January-4 (not shown), perhaps aided by strong winds from the north with wind speeds exceeding 40 knots (20 m/s). This second northern arch then aided the formation of the third ice arch in the south. All three arches became first visible on January-8:

Jan.-8, 2014

Jan.-8, 2014

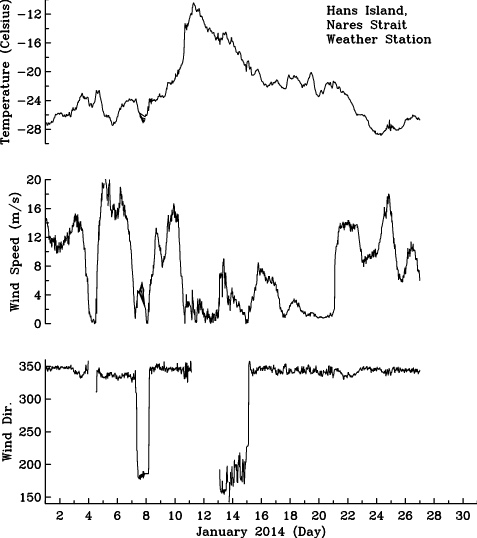
A subsequent lull and short reversal of the winds brought warm southern air masses into Nares Strait while water and drainage pipes froze at my home in Delaware:

Weather record from Hans Island at the center of Nares Strait for January 2014. [Data from Scottish Marine Institute in Oban, Scotland.

Weather record from Hans Island at the center of Nares Strait for January 2014. [Data from Scottish Marine Institute in Oban, Scotland.

“Warm” here refers to -10 degrees Centigrade (+14 Fahrenheit). Air temperatures in Nares Strait today are -21 degrees Celsius (-5 Fahrenheit) while ocean temperatures under sea ice are near -1.8 degrees Celsius (+29 Fahrenheit). It is these “hot” waters that “shine” through the thinner ice as the satellite senses the amount of heat that the ice surface radiates into space. More details on this one finds elsewhere.

I enjoy these elegantly arching ice bridges across Nares Strait, because they challenge me each year anew to question how sea ice, oceans, air, and land all interact to produce them. Nobody really knows. It is a hard problem to model mathematically and many graduate theses will be written on the subject. A student in our own program, Sigourney Stelma, just presented first results and movies of computer simulations of ice bridges forming. Perhaps I can convince her to post some of them on these pages?

Kozo, T.L. (1991). The hybrid polynya at the northern end of Nares Strait Geophys. Res. Let., 18 (11), 2059-2062 DOI: 10.1029/91GL02574

Kwok, R., Pedersen, L.T., Gudmandsen, P. and Peng, S.S. (2010). Large sea ice outflow into the Nares Strait in 2007 Geophys. Res. Let., 37 (L03502) DOI: 10.1029/2009GL041872

Muenchow, A. and H. Melling. (2008). Ocean current observations from Nares Strait to the west of Greenland: Interannual to tidal variability and forcing J. Mar. Res., 66 (6), 801-833 DOI: 10.1357/002224008788064612