
Darkness and cold covers North Greenland, Ellesmere Island as well as Nares Strait, the waterway that connects these two inhospitable places. And despite the darkness of the polar night, I can see that three beautiful arches made of ice connect Greenland to Canada. It is possible to walk across water, if the water is frozen. Stuck to land, ice arches or ice bridges shut down ice motion while the ocean under the ice keeps moving. Lets have a peek at how this looked from space yesterday:
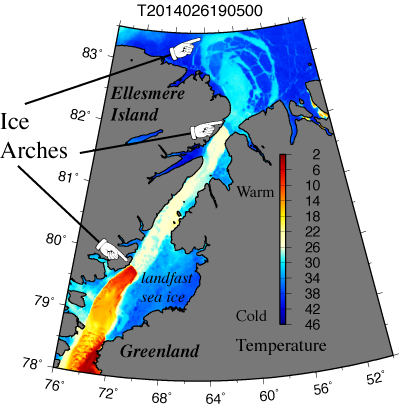
Ice arches of Nares Strait on January 26, 2014 from MODIS thermal imagery. Surface temperatures in degrees Celsius are all below zero despite the missing “-” sign stripped by Adobe Illustrator.
The colors above show the temperature that satellite sensors “see” at the surface of the ice. Red is warm, blue is cold, and grey is land, but “warm” here is still below the freezing point of sea water near -2 degrees Celsius, so even the red or “hot” spots are covered by ice. The 300 deep ocean in Nares Strait generally flows from north to south without trouble under the ice, but just behind the fixed arching ice bridges, it sweeps the newly formed thin ice away to the south. The “warm” spots that form to the south of each ice arches have their own stories:
Farthest to the north a massive ice arch spans almost 200 km (150 miles) across. It faces the open Arctic Ocean to the north and it formed a few days before Christmas 4-5 weeks ago. It was still shedding large ice floes from its edge as it tried, and finally succeeded, I think, to find a stable location. Nevertheless, one of its larger pieces of ice moved into Nares Strait on January-3, 2014 where it became stuck on both Greenland and Ellesmere Islands:
-

- Jan.-1, 2014
-
- Jan.-2, 2014
-

- Jan.-3, 2014
The large floe from the edge of the first ice arch becames firmly lodged on both sides of the 30-km wide entrance to Nares Strait on January-4 (not shown), perhaps aided by strong winds from the north with wind speeds exceeding 40 knots (20 m/s). This second northern arch then aided the formation of the third ice arch in the south. All three arches became first visible on January-8:

Jan.-8, 2014
A subsequent lull and short reversal of the winds brought warm southern air masses into Nares Strait while water and drainage pipes froze at my home in Delaware:
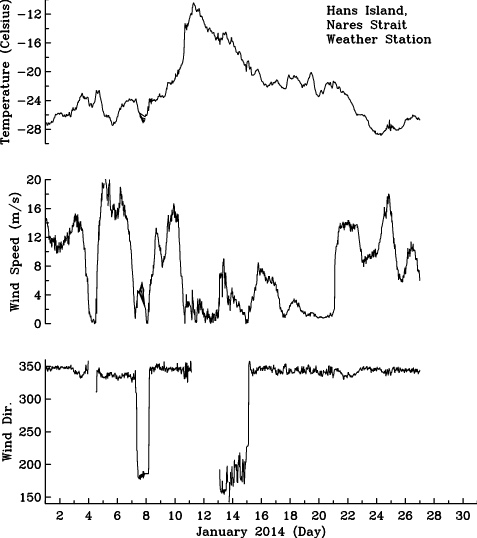
Weather record from Hans Island at the center of Nares Strait for January 2014. [Data from Scottish Marine Institute in Oban, Scotland.
“Warm” here refers to -10 degrees Centigrade (+14 Fahrenheit). Air temperatures in Nares Strait today are -21 degrees Celsius (-5 Fahrenheit) while ocean temperatures under sea ice are near -1.8 degrees Celsius (+29 Fahrenheit). It is these “hot” waters that “shine” through the thinner ice as the satellite senses the amount of heat that the ice surface radiates into space. More details on this one finds elsewhere.
I enjoy these elegantly arching ice bridges across Nares Strait, because they challenge me each year anew to question how sea ice, oceans, air, and land all interact to produce them. Nobody really knows. It is a hard problem to model mathematically and many graduate theses will be written on the subject. A student in our own program, Sigourney Stelma, just presented first results and movies of computer simulations of ice bridges forming. Perhaps I can convince her to post some of them on these pages?
Kozo, T.L. (1991). The hybrid polynya at the northern end of Nares Strait Geophys. Res. Let., 18 (11), 2059-2062 DOI: 10.1029/91GL02574
Kwok, R., Pedersen, L.T., Gudmandsen, P. and Peng, S.S. (2010). Large sea ice outflow into the Nares Strait in 2007 Geophys. Res. Let., 37 (L03502) DOI: 10.1029/2009GL041872
Muenchow, A. and H. Melling. (2008). Ocean current observations from Nares Strait to the west of Greenland: Interannual to tidal variability and forcing J. Mar. Res., 66 (6), 801-833 DOI: 10.1357/002224008788064612


Those bridges were was one of the first things I looked at when starting the Arctic Sea Ice Blog, and are still one of my favourite events in the Arctic.
Can I re-post this in a day or two on the ASIB, Andreas?
Neven: Absolutely, I would be honored.
Post is up. Thanks a lot for letting me re-blog.
Very interesting Andreas. I wonder if it might be possible to hear your thoughts on this year compared to others (allowing obviously for that there are few reliable benchmarks in this dynamic system)?
Our observations (eyeball and via charts/images) (we’re currently based in Qaanaaq and have been since mid-Dec) have been that:
– the North Water tip is very far north (nearer Kennedy Channel than Smith Sound) and the area to the south is clearing of ice, due to the currents, wind and lack of opportunity to freeze or refreeze.
– the middle arch which is usually the north arch, and further north at the entrance to the Lincoln Sea, is quite far south and that area of the mid and northern Kennedy Channel has been degrading since mid-Dec and only begun to re-consolidate in the last week or so. We’ve seen this being more predictable on previous charts (excepting the famous bad years) and not breaking and rebuilding so much, so as to make the conditions for surface travel there unwise this year, even close to the coasts.
– this second point is linked to the storm reported in mid-Dec in the Lincoln Sea and the enormous bulb of open water and massive leads caused in that region around Christmas, which has not had an opportunity to ‘heal’ and now forms this huge new arch far into the Arctic Ocean. The open water and brand new ice in the Lincoln Sea and Robeson Channel seems to be key in how the ice to the south is behaving.
– in summary we have seen more ‘freeze, break, freeze, break’ than normal and a few events which have not allowed a classic Dec-Feb fixed arch formation and consolidation within. The arches seem to still be very mobile (expect perhaps the southern one which is finally staying put at its very northerly location).
Thanks.
Quick thoughts:
1. The ice arches are stable right now for well over two weeks, latest imagery is posted at http://muenchow.cms.udel.edu/Nares2014/Band31;
2. The 2014 North Water extends 50-100 km farther north into Kane Basin than it does in most years. The ice arch is at the same location where it was in 2008, but it then only lasted for 2 months (April/May).
3. The middle arch at 82 N latitude is NOT the location of the Lincoln Sea arch, it is pretty much just a large multi-year floe that got stuck at a narrow segment of Robeson Channel at the right time;
4. The Lincoln Sea arch is at its usual location far out into the Arctic Ocean past 83 N latitude; it is generally not as stable as the North Water bridge with 2009 being the anomaly of a VERY stable Lincoln Sea ice arch persisting for almost 6 months without the southern North-Water arch ever forming.
Stay safe and don’t do a “Peary,” but perhaps a “Freuchen” instead 😉
P.S.: If you plan to travel through Nares Strait, the southern “North-Water” ice bridge is the only one that really matters. Once it forms, the northern stuff matters little, but once it breaks, everything to the north falls apart within a few days also.
Thanks very much Andreas. I may have not been clear and yes we agree with your point 3. Some of our sources don’t have daily updates (some weekly) so there is some variation as to when we ‘pin’ events as happening. Also, I guess there are various definitions of ‘stable’ and ‘fixed’ with regard to sea ice!
Anyhow, thanks from us all here at 77N and we’ll continue to try and make correct decisions, especially given the uncertainty of the region.
Whow … you really are in Qaanaaq, just read your post http://www.darkiceproject.com/blog/2014/1/31/siorapaluk on training travels last friday. Reads well and looks good. I am amazed at your connectivity that appears to be better than what we had access to aboard Canadian icebreakers up there in 2012 and before. I wish you well and may need to ping on you when you return later this year.
Andreas, this has been on my mind to write since this post first appeared but have been busy with my own projects and have only just got back to it.Your temperature chart for January 26 above matches others for later dates and seems to show a 16 C difference (-26 to -10) between upstream and downstream at a fixed location, as though there is a steady flow of warmer water under the ice that has not originated from the entrance of the straight to the North.
Yes, I do understand that we see comparative differences when the ice is moving, and I assume that is caused by impact and compression forces adding kinetic energy from large flows running into one another as we see with the January 8th illustration above. However, that temperature difference seems to be now fixed, (from looking at the listings on your 2014 Nares Strait MODIS Brightness Temperature (11.03 um)).
My questions are; has anyone quantified the energy delivered to the Nares Strait to create that temperature difference; particularly as a steady state system? How thick is the ice above? does that thickness change substantially at the junction between the two temperatures? How deep is the water below? and how deep is the assumed layer of warmer water below that ice?
I ask as it is known that the flow is North to South and thus in a steady state situation; there must be another system delivering that warmer water.
Is that warm flow stemming from under the Peterman Ice tongue?
Chris:
The large temperature gradient sensed by MODIS relates to the ocean which sweeps away all newly formed ice southward of the ice-arch. This then brings the “hot” ocean at its freezing temperature (-1.8 degrees Celsius) very close to the surface where all new ice forming is swept away southward by ocean currents. The very cold temperatures upstream (=northward) of the ice-arches are very close to the air temperatures. So, the thicker ice (2-3 meters) of the ice arch serves an insolation blanket for the “hot” ocean below. Downstream (=southward) of the ice arches, there is no blanket, no insolation, and lots of heat is moved from the ocean to the atmosphere … which also causes fog which freezes which is also swept downstream by the air flow. This is why you often see streaks of clouds emanating from the ice arch.
To sum up: The MODIS temperature gradients seen relate to the thickness of the ice, several meters where it cold, a few centimeters where it is warm.
Thank you Andreas,
In which case, the “hot” oceanic water is also flowing out of the Arctic Ocean into Nares Strait as a layer beneath the ice and, as such, when the ice breaks away from the surface, the cold surface ice is replaced with hot water from below.
It was just that my understanding of the overall flow, (the Arctic being the driver of the planets oceanic circulation from dense, cold, salt water sinking to the bottom and then flowing away down the Eastern seaboard of North America), meant that that dense cold water would also be the cause of the flow down Nares Strait.
And that view was, to my mind, reinforced by earlier MODIS data showing no “hot” surface as today.
It would help if you could point towards a paper that has clearly defined the flows in Nares Strait.
Please note, that the “hot” ocean surface waters are at the freezing point of seawater, about -1.8 C. These surface waters do indeed originate from the Arctic Ocean to the north and thus are also fresh relative to surface waters of the North Atlantic Ocean.
As for a reference on Nares Strait flows, I published a paper a few years ago that you can access at http://muenchow.cms.udel.edu/papers/MuenchowMelling2008JMR.pdf. I hope to update and extend our result before the summer starts with additional and better data we collected since then..
While it will be certain that you are very busy in the field, today, a Slate article has opened up to another view of the heat flow from under the ice to the South west of Greenland. (The article is all about El Nino, but the anomaly to spot is the water temperature at the tip of Greenland. http://www.slate.com/blogs/future_tense/2014/04/07/el_nino_2014_2015_forecasts_show_it_could_grow_into_a_monster.html
This image: http://www1.ncdc.noaa.gov/pub/data/oisst/navy-anom-bb.gif (mine shows for the 8th April), shows that the sea surface temperatures, where, as I understand it, (the ocean flows are driven by the Gulf Stream flow into the Arctic past the UK which then lose heat to the Arctic ice and then flows back out of the Arctic, between the North American continent and Greenland), and has an anomalous temperature some 3 degrees above the norm.
Considering you believe that this is simply warmer deep ocean water; surely that anomaly would be expressed end summer, not early spring?
Is anyone researching the flow rates and temperature differences between the exit flow from the Arctic Ocean and the exit flows at the other end of Greenland, where this anomaly is showing the temperature difference?
One has to be careful to interpret sea surface temperatures from satellites such as AVHRR and MODIS. The sensors only measure a tiny fraction of a millimeter and it is not always easy to connect these measurements to what the temperature is 10 or even 100 meters below the surface. Furthermore, for much of the polar North-Atlantic and Arctic, temperature has little effect on the density of sea water which is dominated by salinity (the opposite is true for tropical oceans).
So the “heat flow” you refer to is really a “buoyancy-driven flow” where buoyancy refers to density. In the ocean (and atmosphere) these “density driven flows” adjust to the earth’s rotation to form the high and low pressure systems (in both atmosphere and ocean) that we are used to see on the weather charts. So, as for the ocean around Greenland, sea surface temperatures are of very limited use to diagnose what happens below the surface.
It is just that my understanding of the flow, is that it is driven by a deep water flow down the North American Coast with Coriolis forces causing it to flow up against the coastline, (which would serve to explain the gap between the coast and the temperature anomaly as seen in the images); while at one and the same moment, being the driving force of the entire global ocean flow system. That the primary flow out of the Arctic is a deep water flow, down into the abyss. So my question remains; is anyone researching the flow at both ends of Greenland? Are there any inconsistencies between the flow rate and temperature out of the Arctic Ocean and the flow rate and temperatures at the other end of Greenland?
German scientists measured ocean flow over the deep section that separates Spitsbergen from Greenland since the late 1990ies into the present (Drs. Schauer, Fahrbach, Rabe). These measurements relate to the flow/flux both into and out of the Arctic over the deep basins that largely exclude about 100-200 km of shallow (but energetic) continental shelf areas.
These long-term measurements from ocean moorings have no bearing on daily sea surface temperature anomalies off southern Greenland.