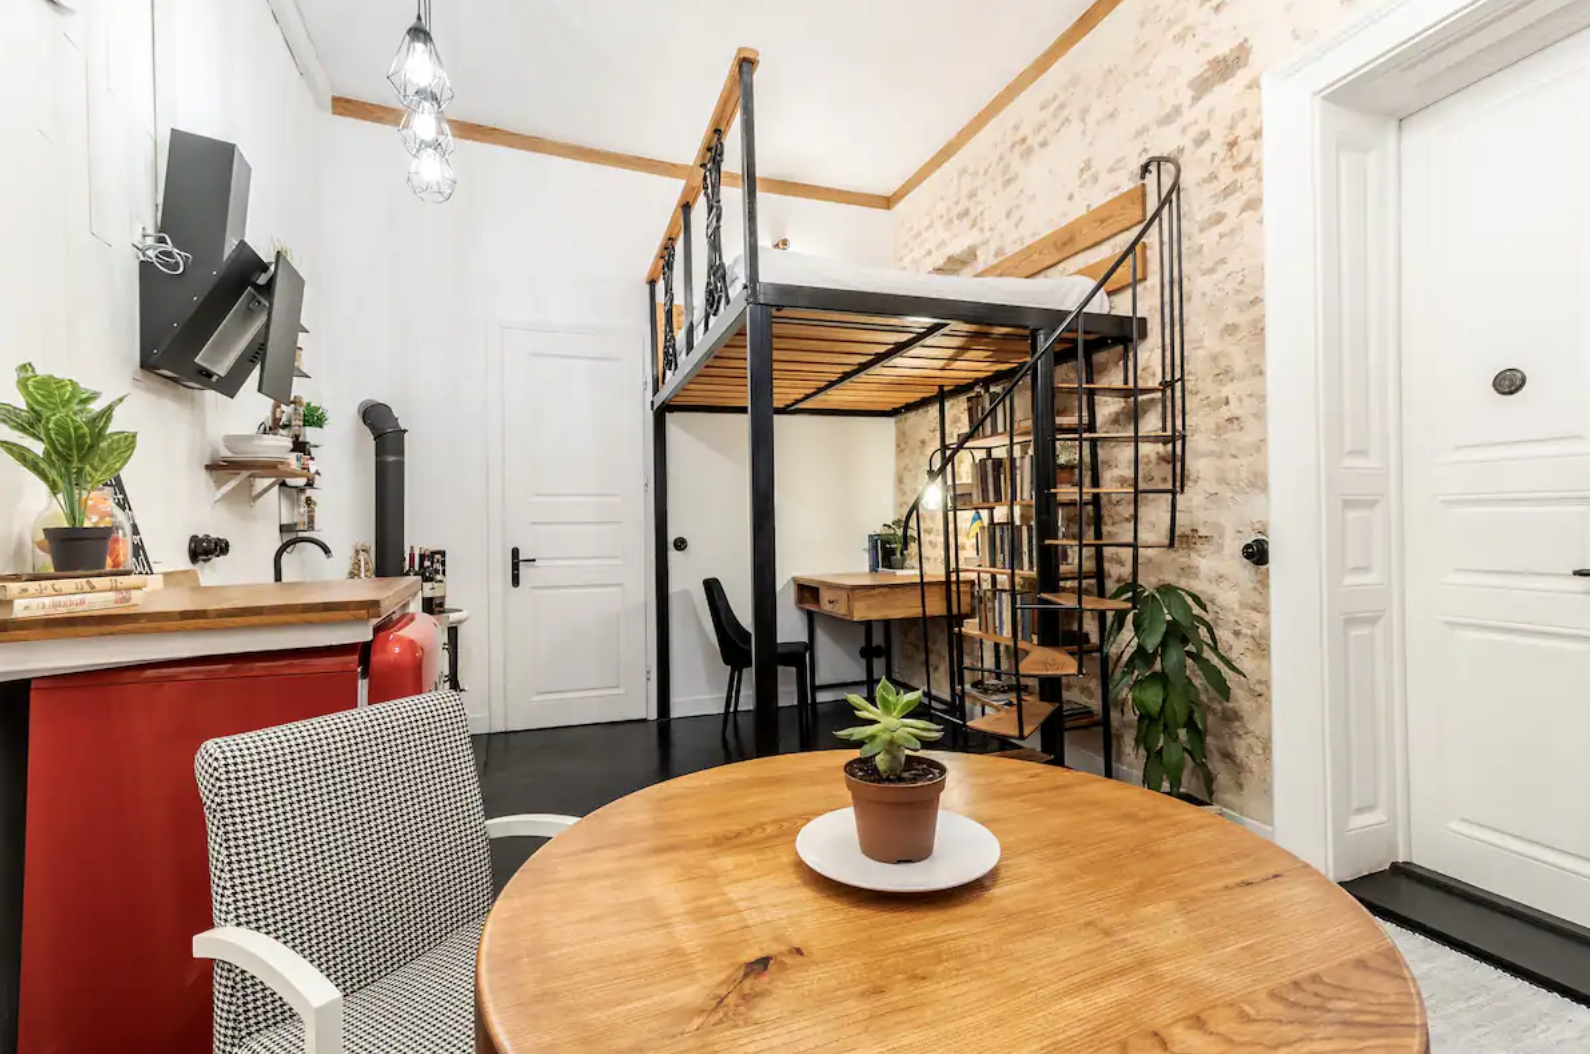
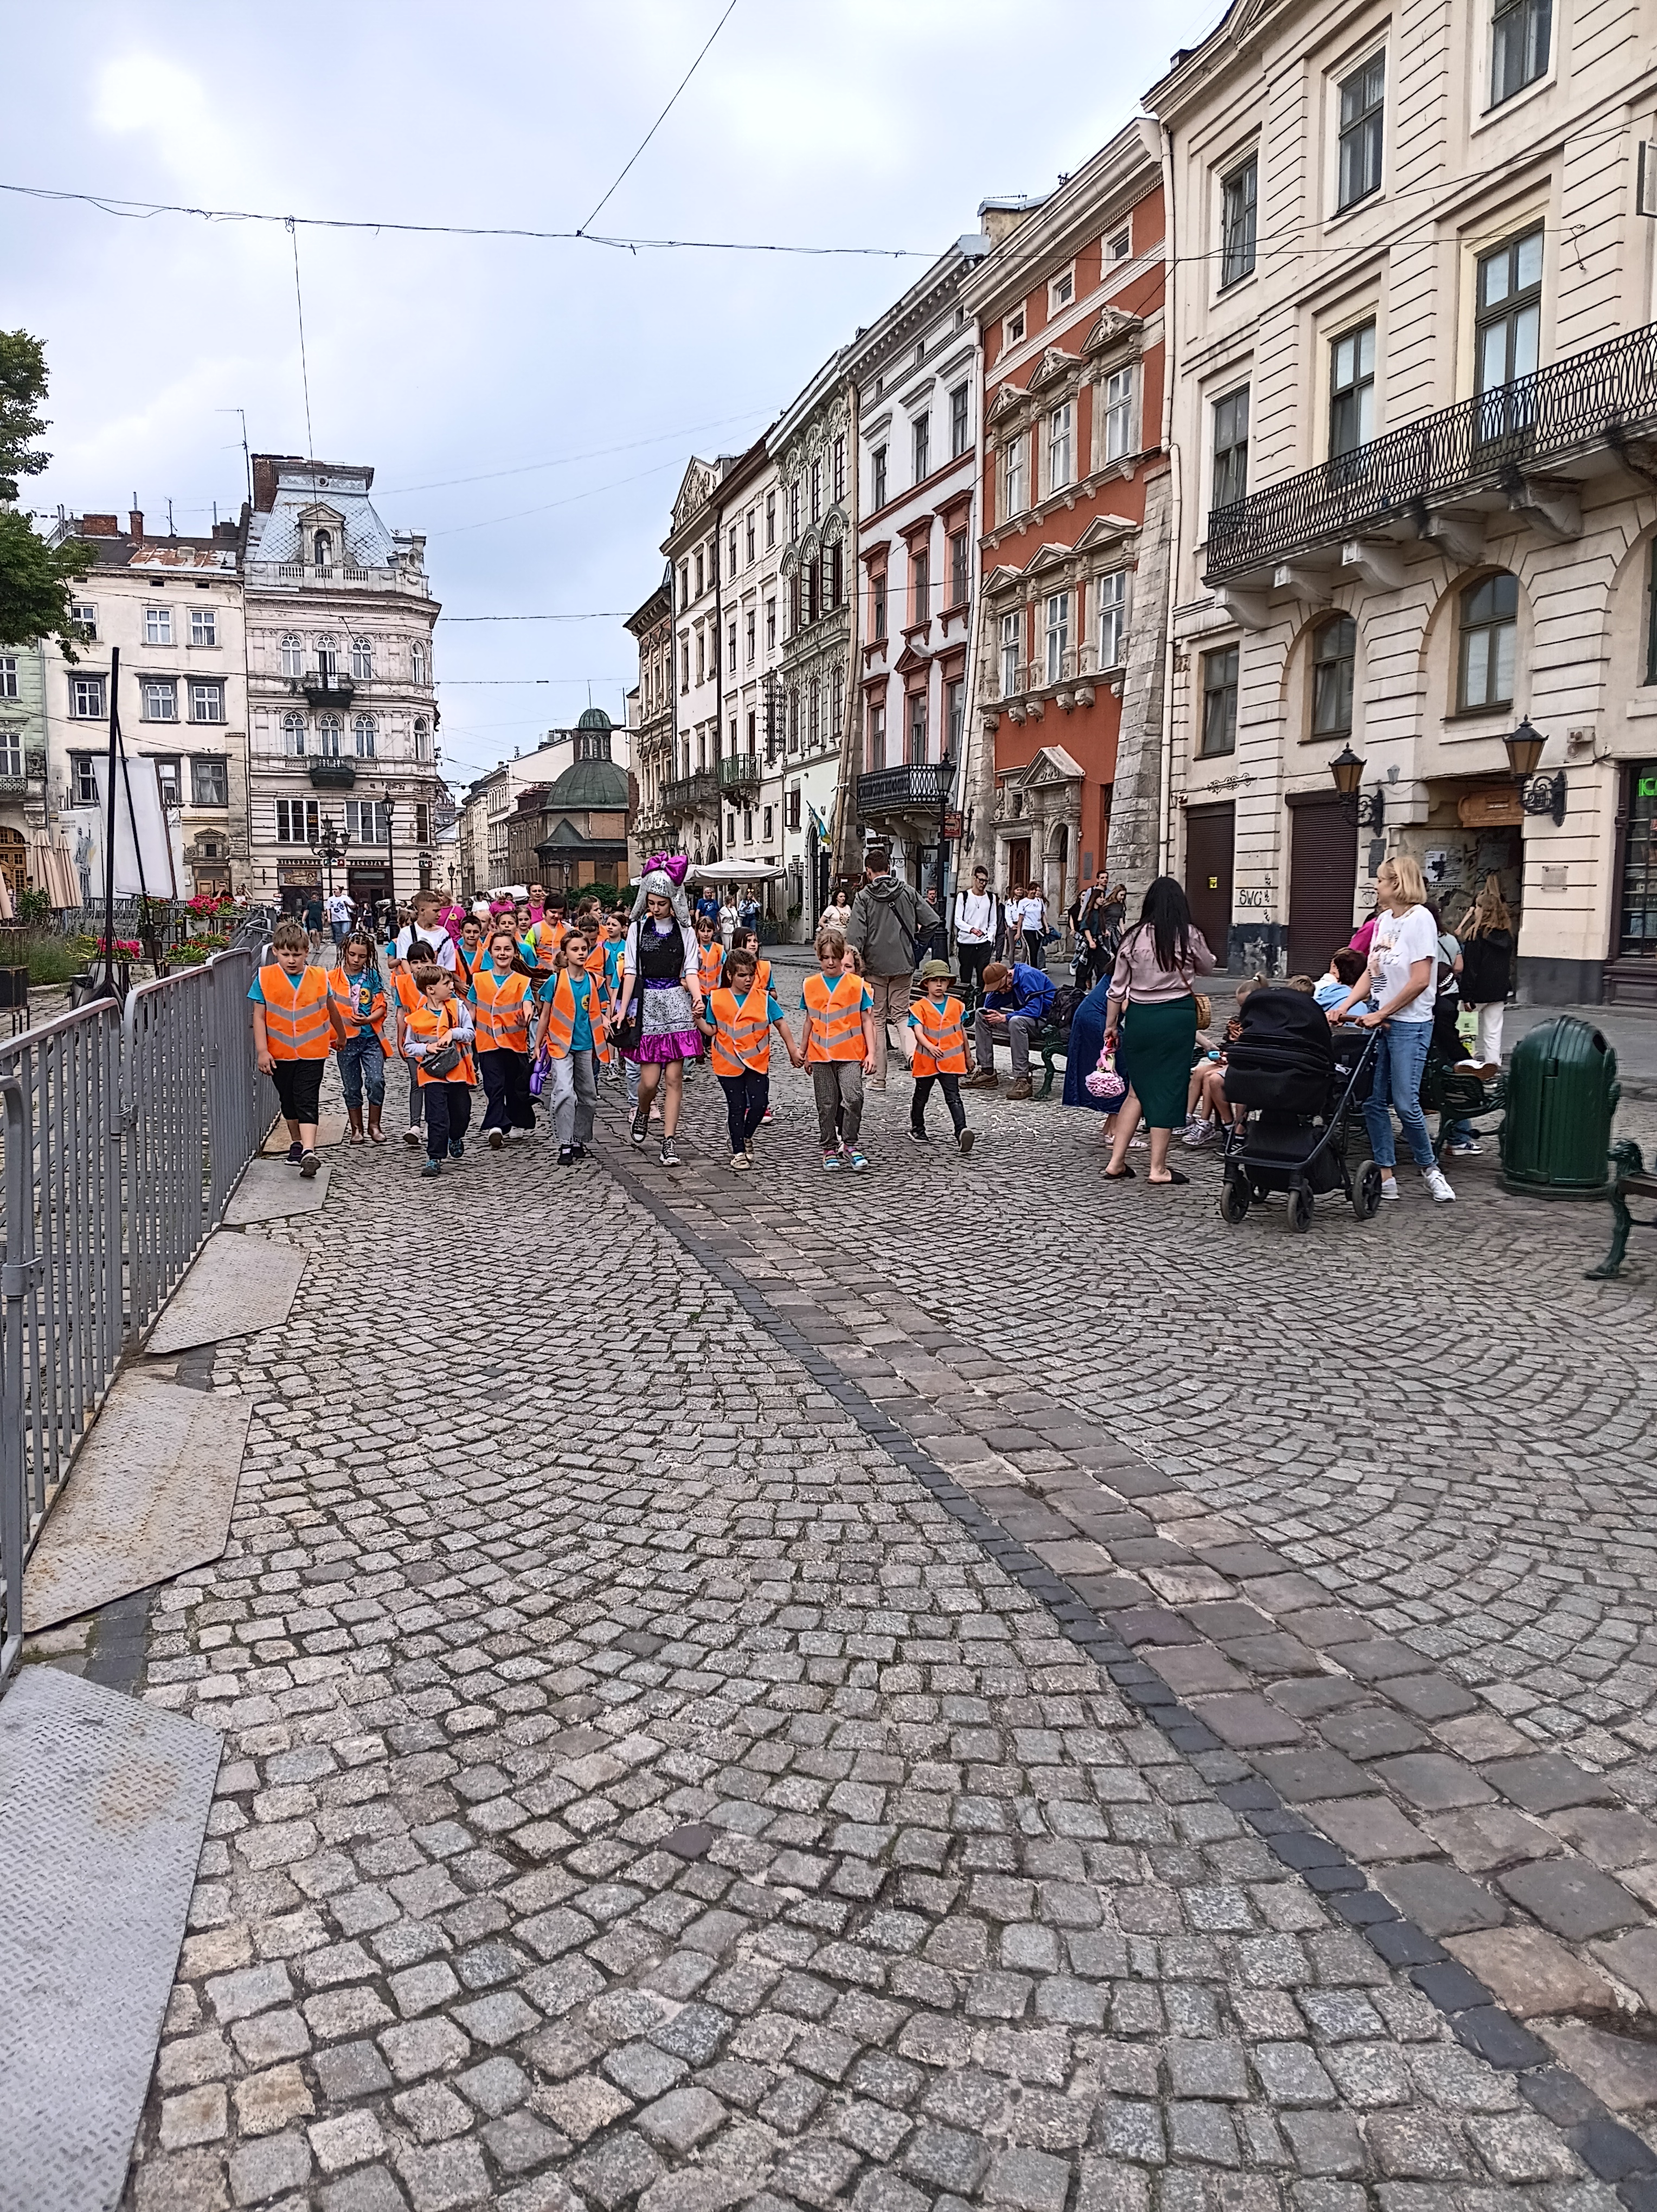
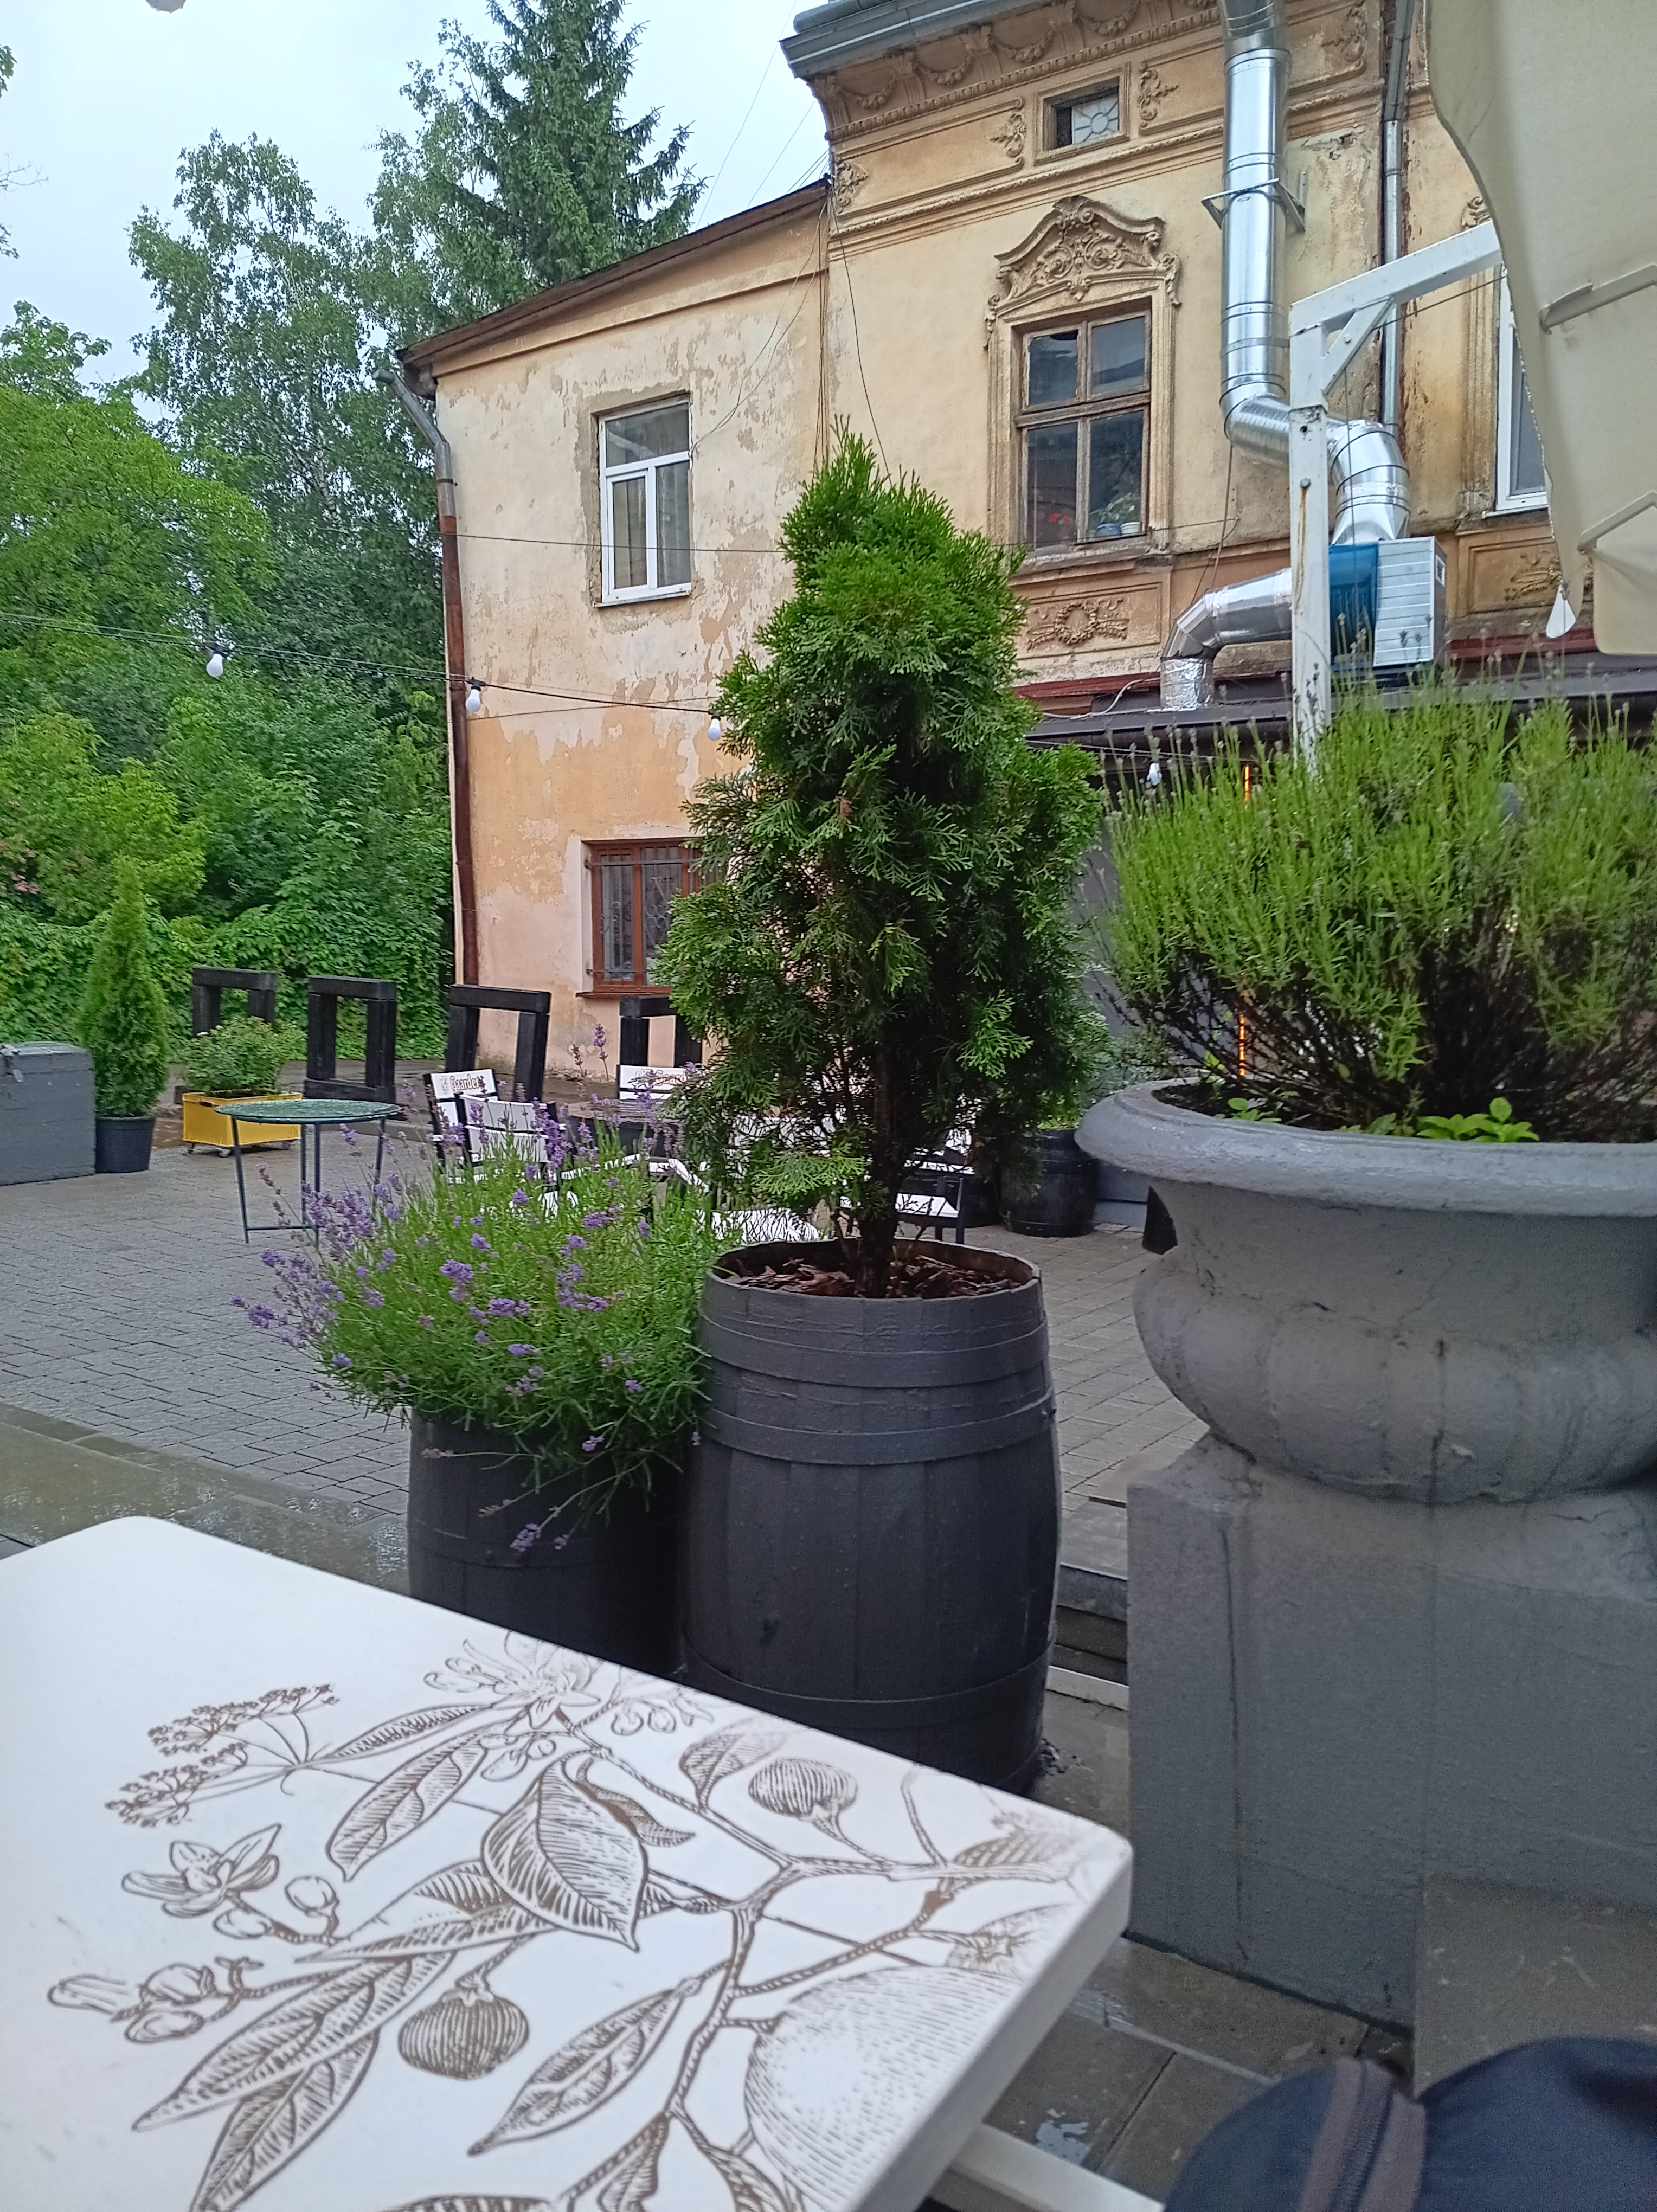
Cobble stones pave the streets of Lviv everywhere. The pedestrian Old Town merges sidewalks and streets with its center at Rynok Square. In Old Town restaurants, cafes, churches, museeums, and small shops all spill onto sidewalks in front of the 150-200 year old buildings. On the 2-3 floors up people live in appartments with 10 foot ceilings. My 1-room appartment was in one of these. Exiting the building and turning left, I reached Rynok Square within two minutes. Turning right, I entered Dominican Church within a minute. Along the short ways I pass several shops, cafes, and a small flea market. Electric trams but not cars zip across Old Town and for 20 Hryvnias ($0.50) one can hop on and go as far as the tram goes.
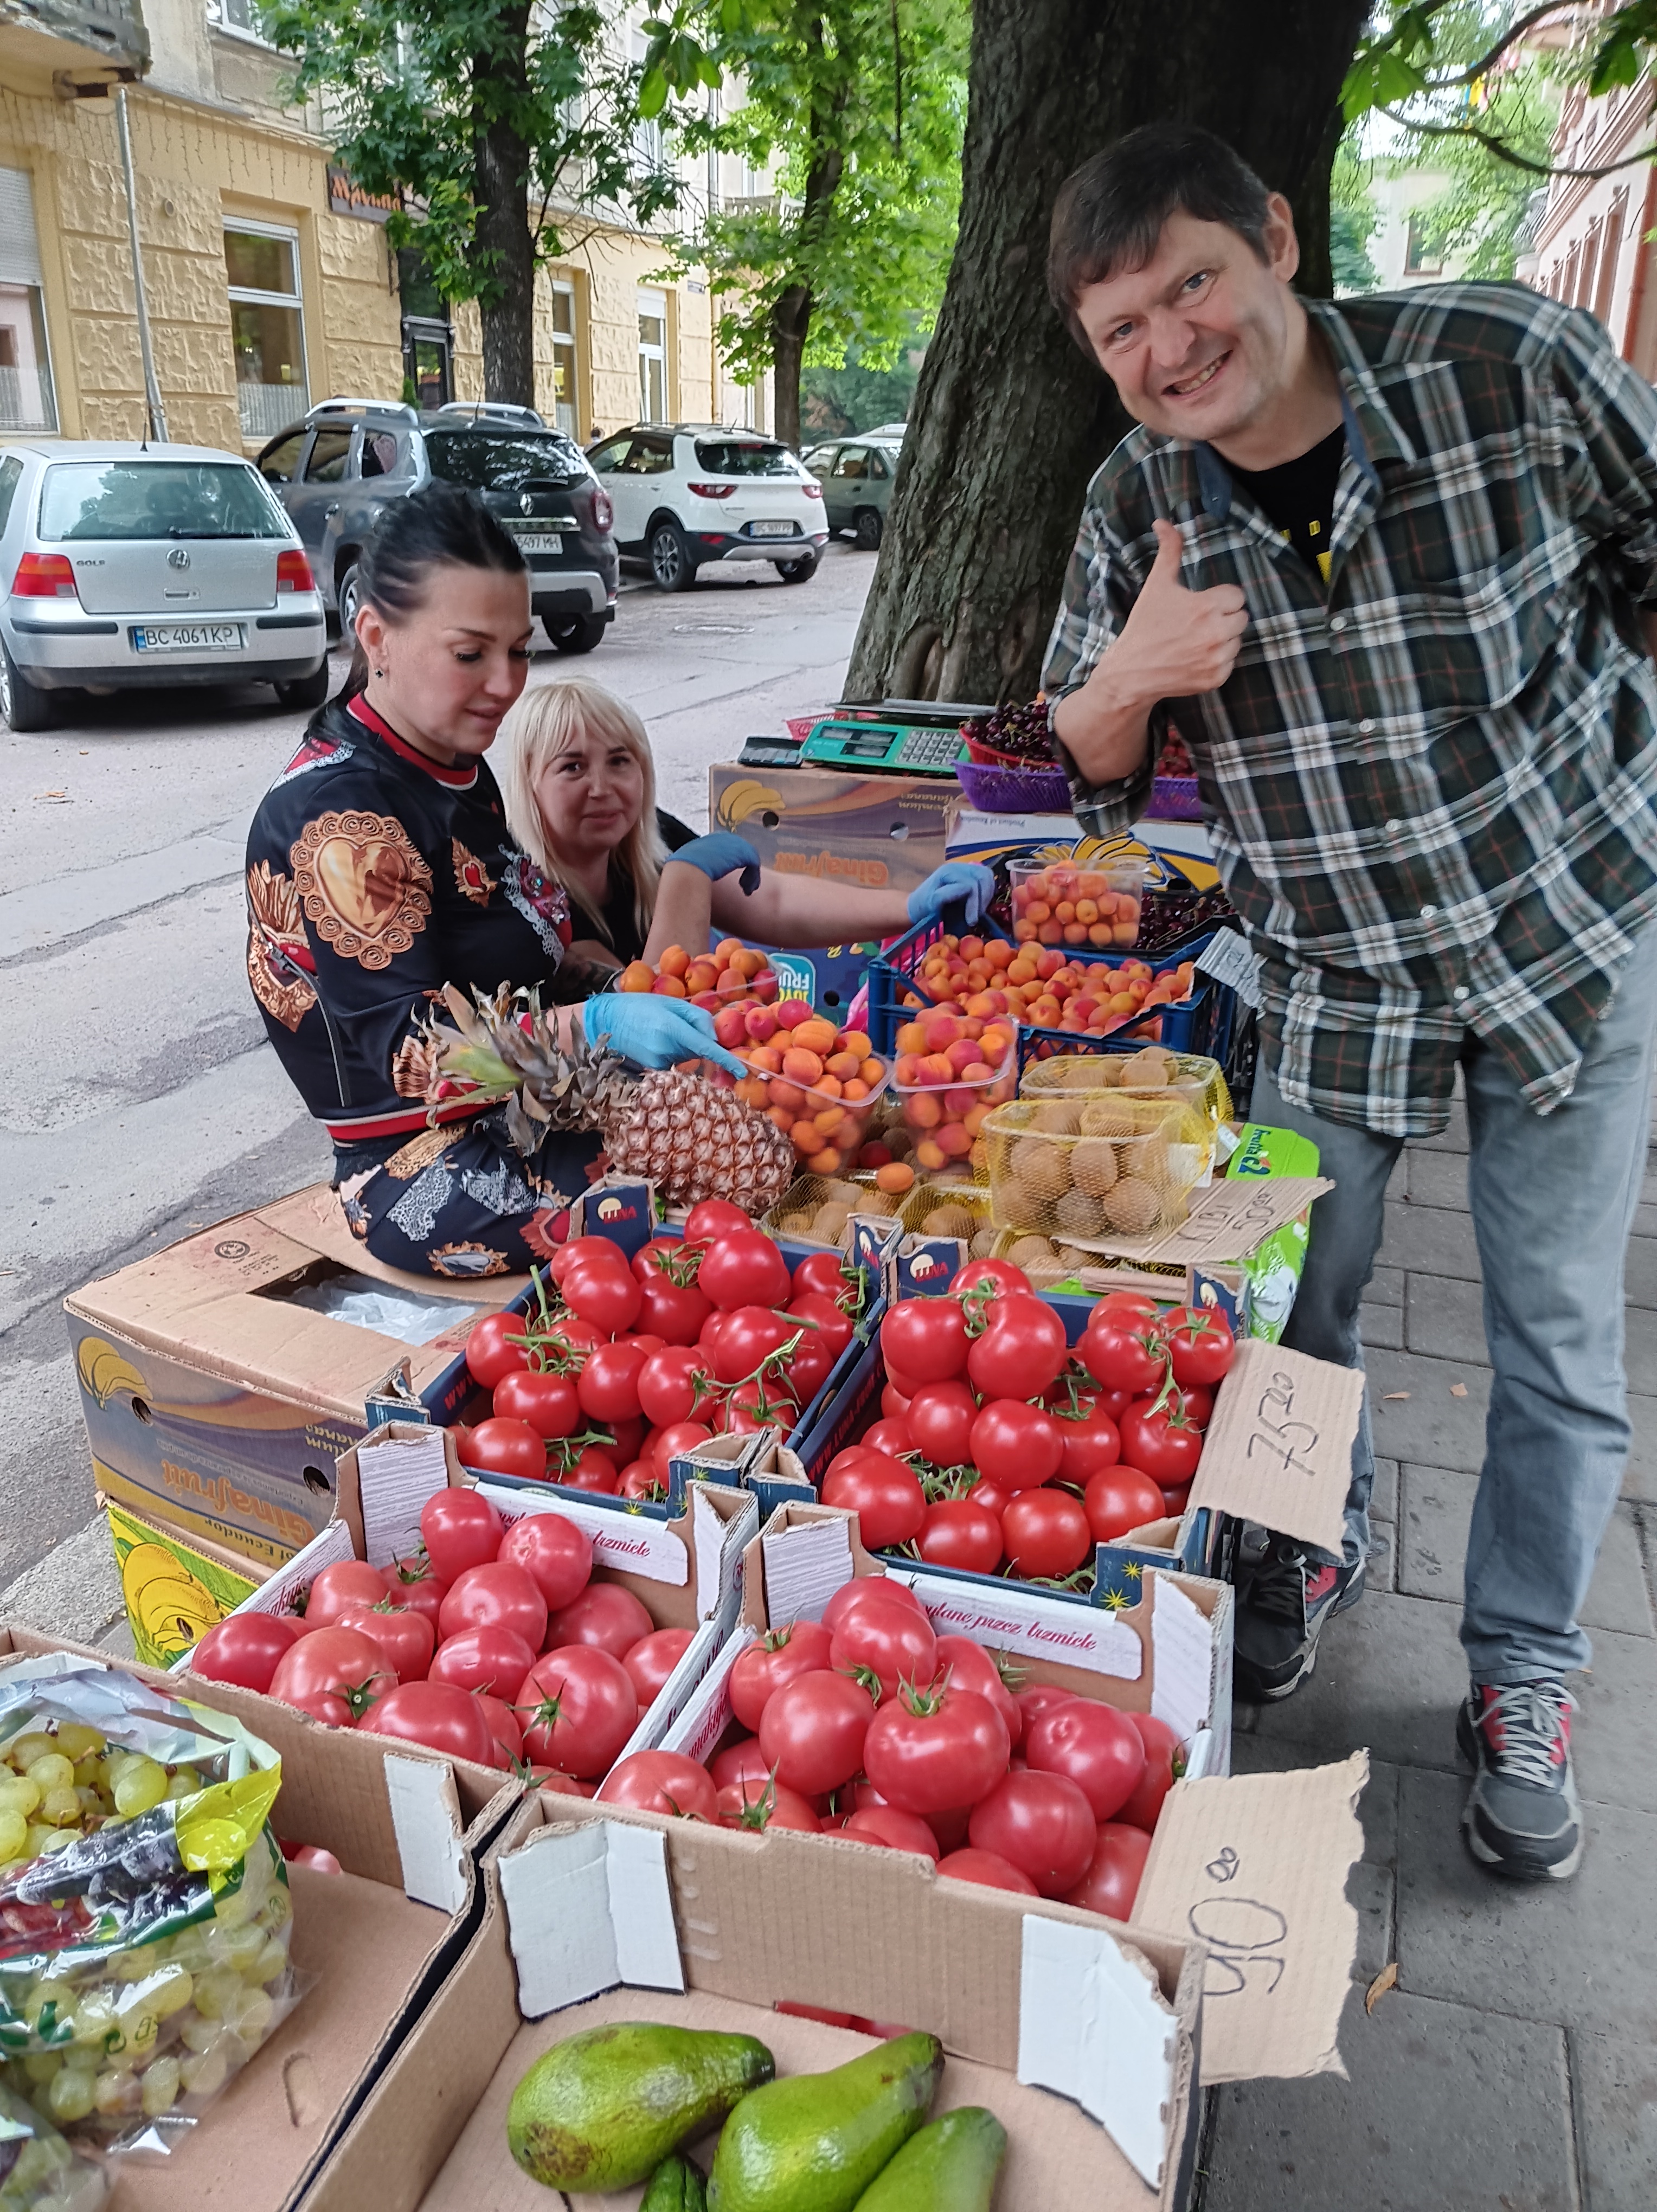
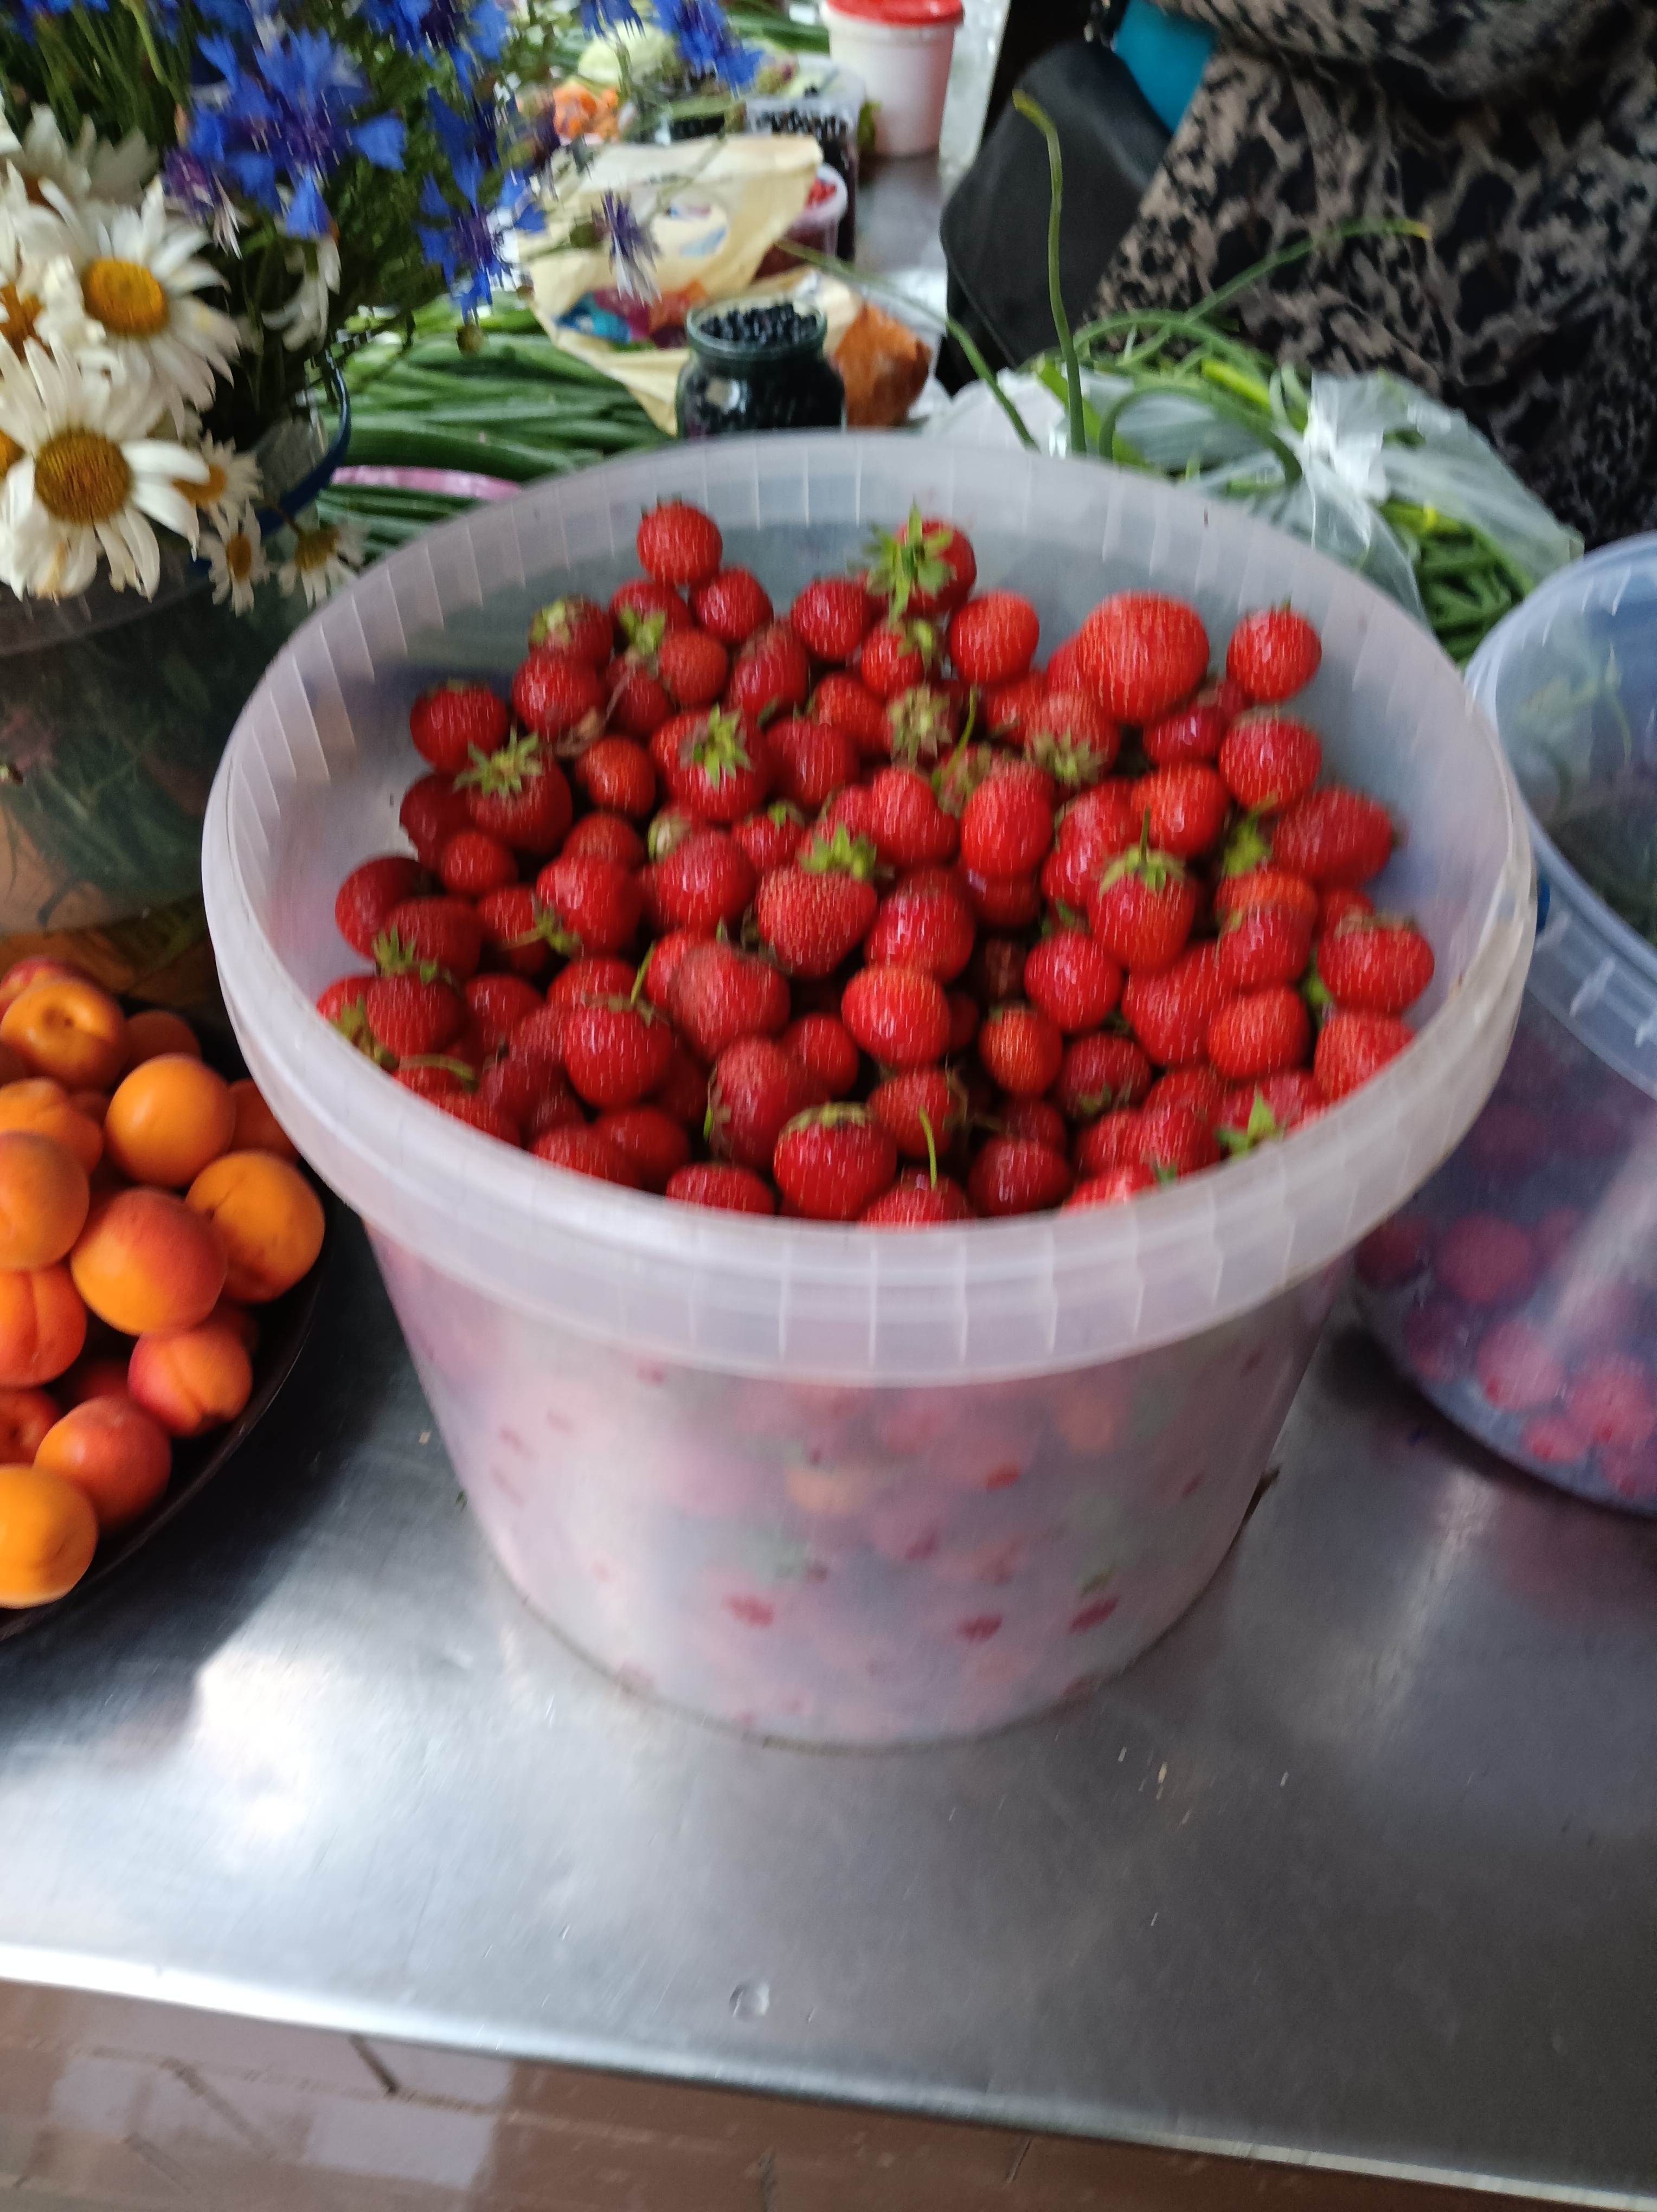
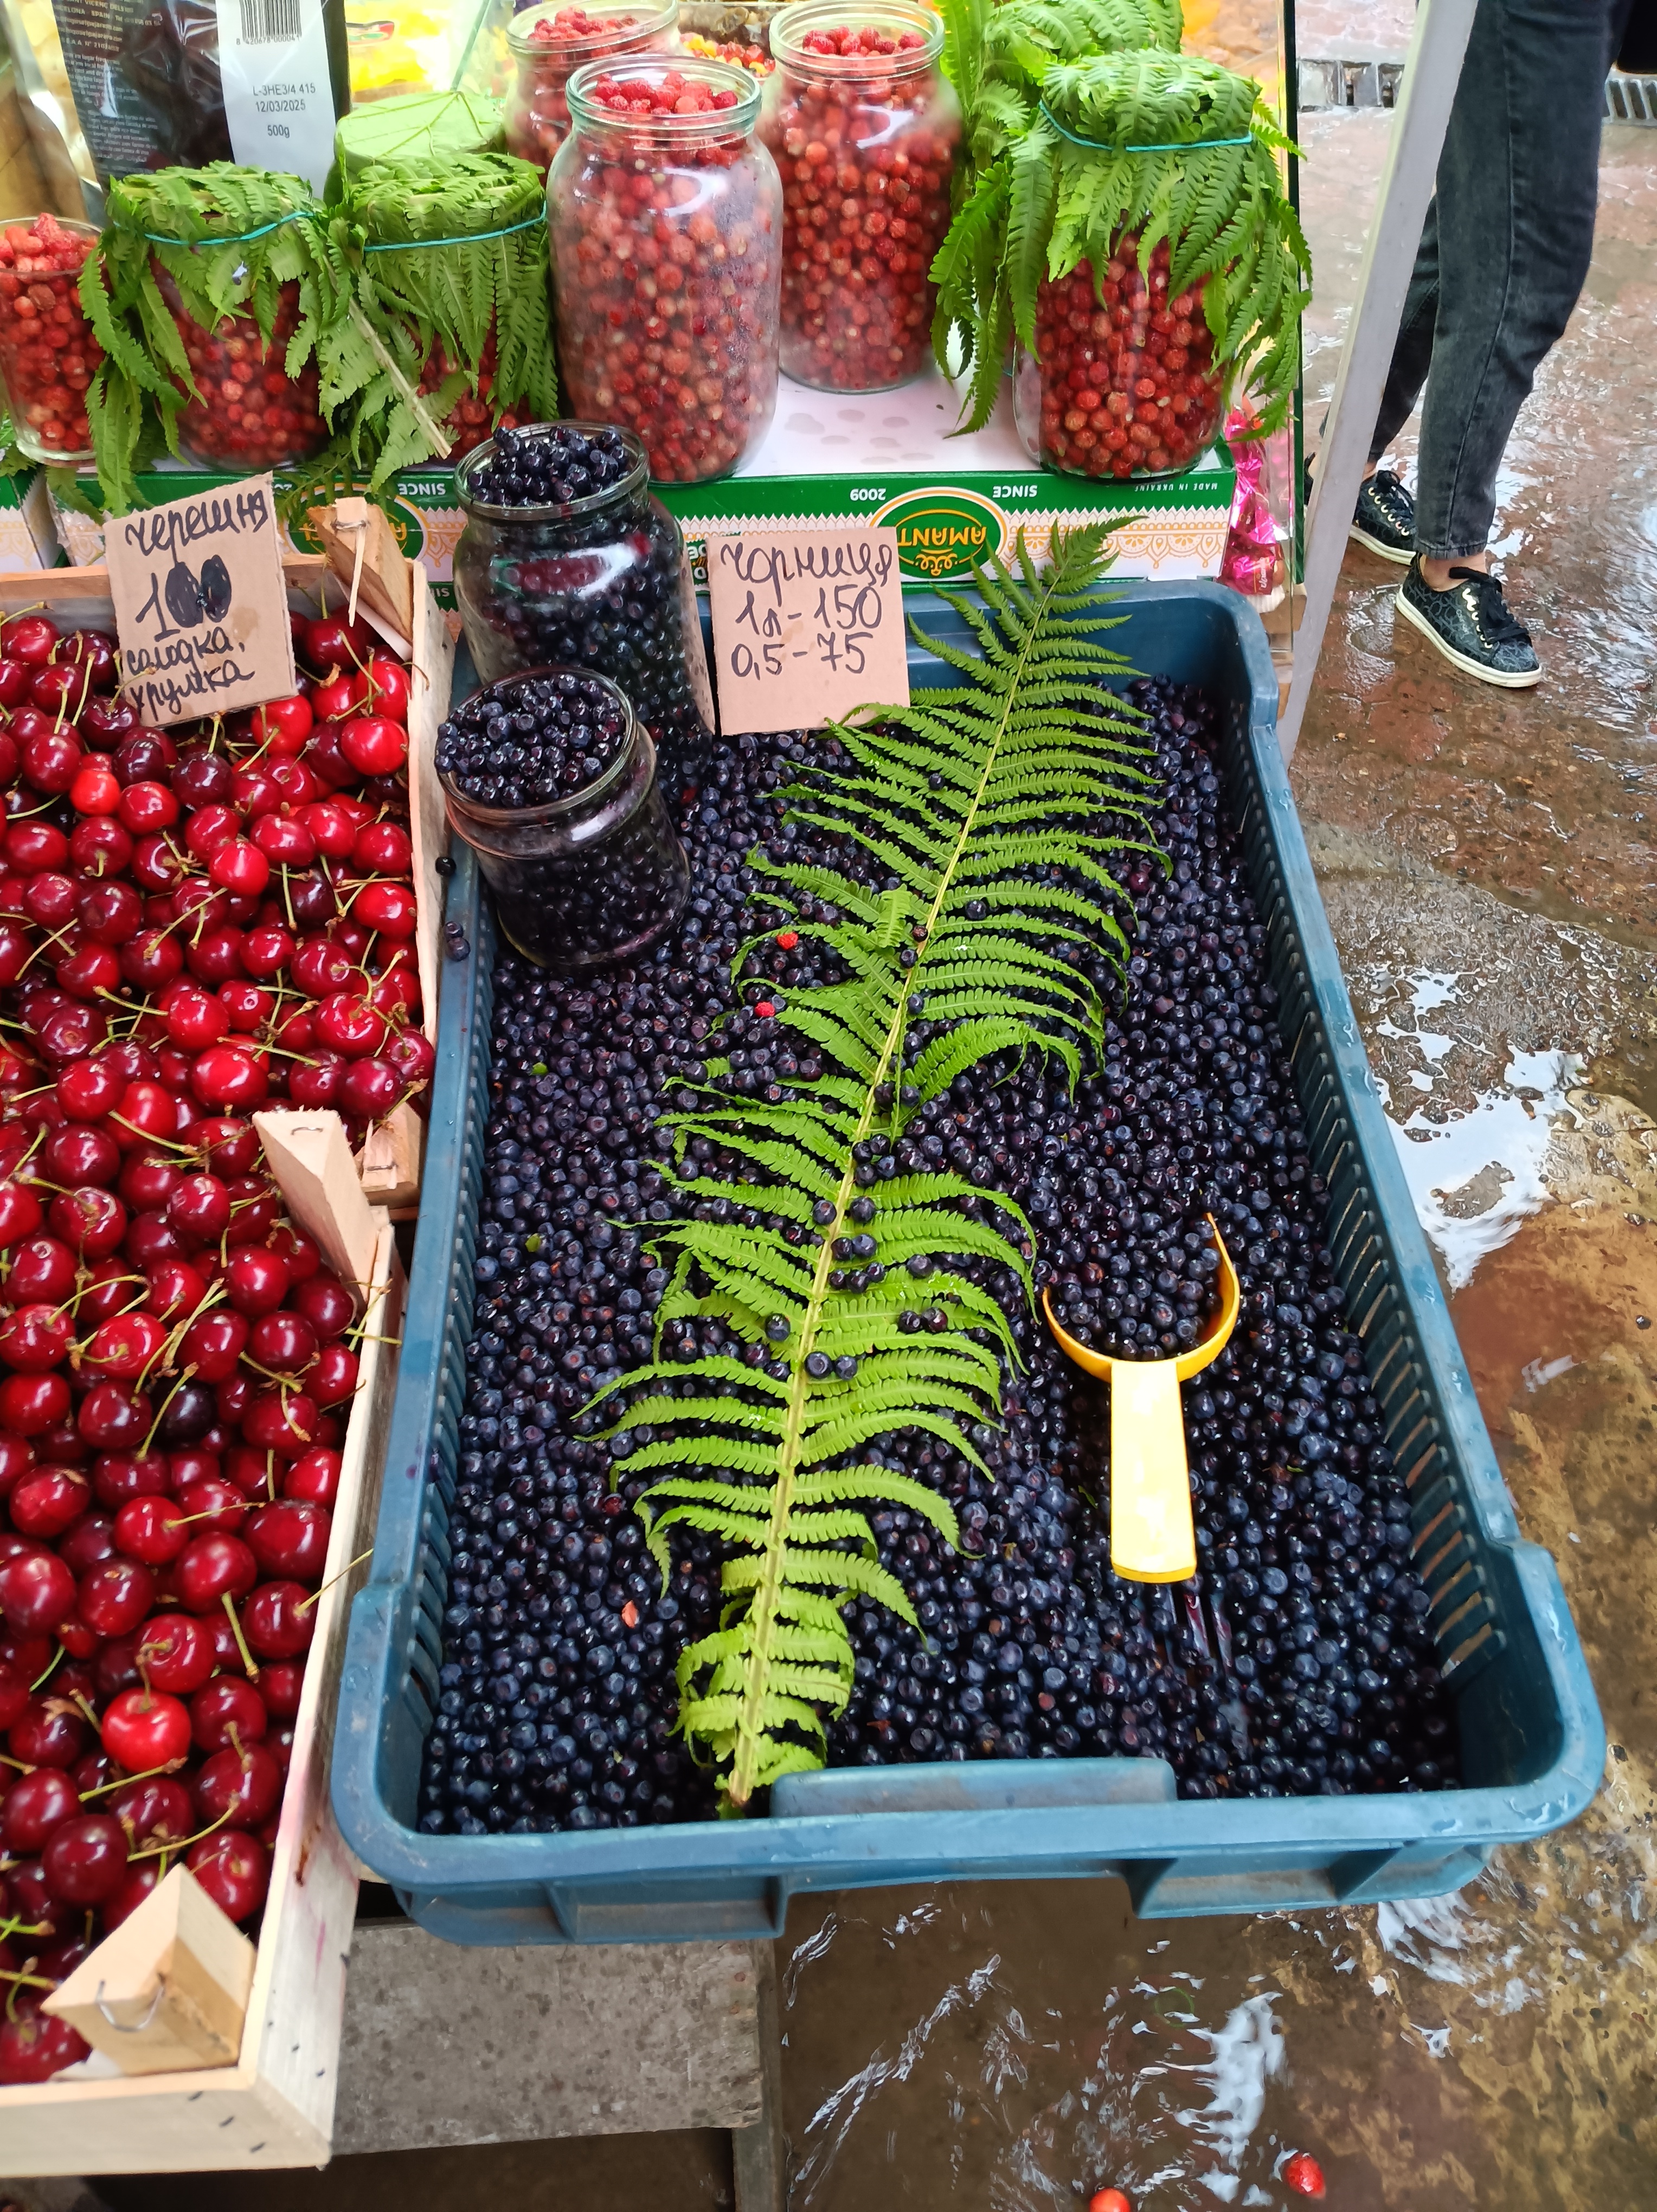
Walking past Old Town, I quickly found street vendors and a farmer’s market within a mile or so. Both local (currants, strawberries, cherries, gooseberries) and foreign fruit were sold. I bought half a pound of cherries and half a pound of “mirabellen” (small yellow plums) to eat during my first morning stroll through Lviv. Initially I spit the pits into the street, but I stopped when I noticed how clean both the streets and sidewalks were. This differs from all cities I have visited previously. Lviv expunges any and all litter in public places. So, my cherry pits went back into the bag.
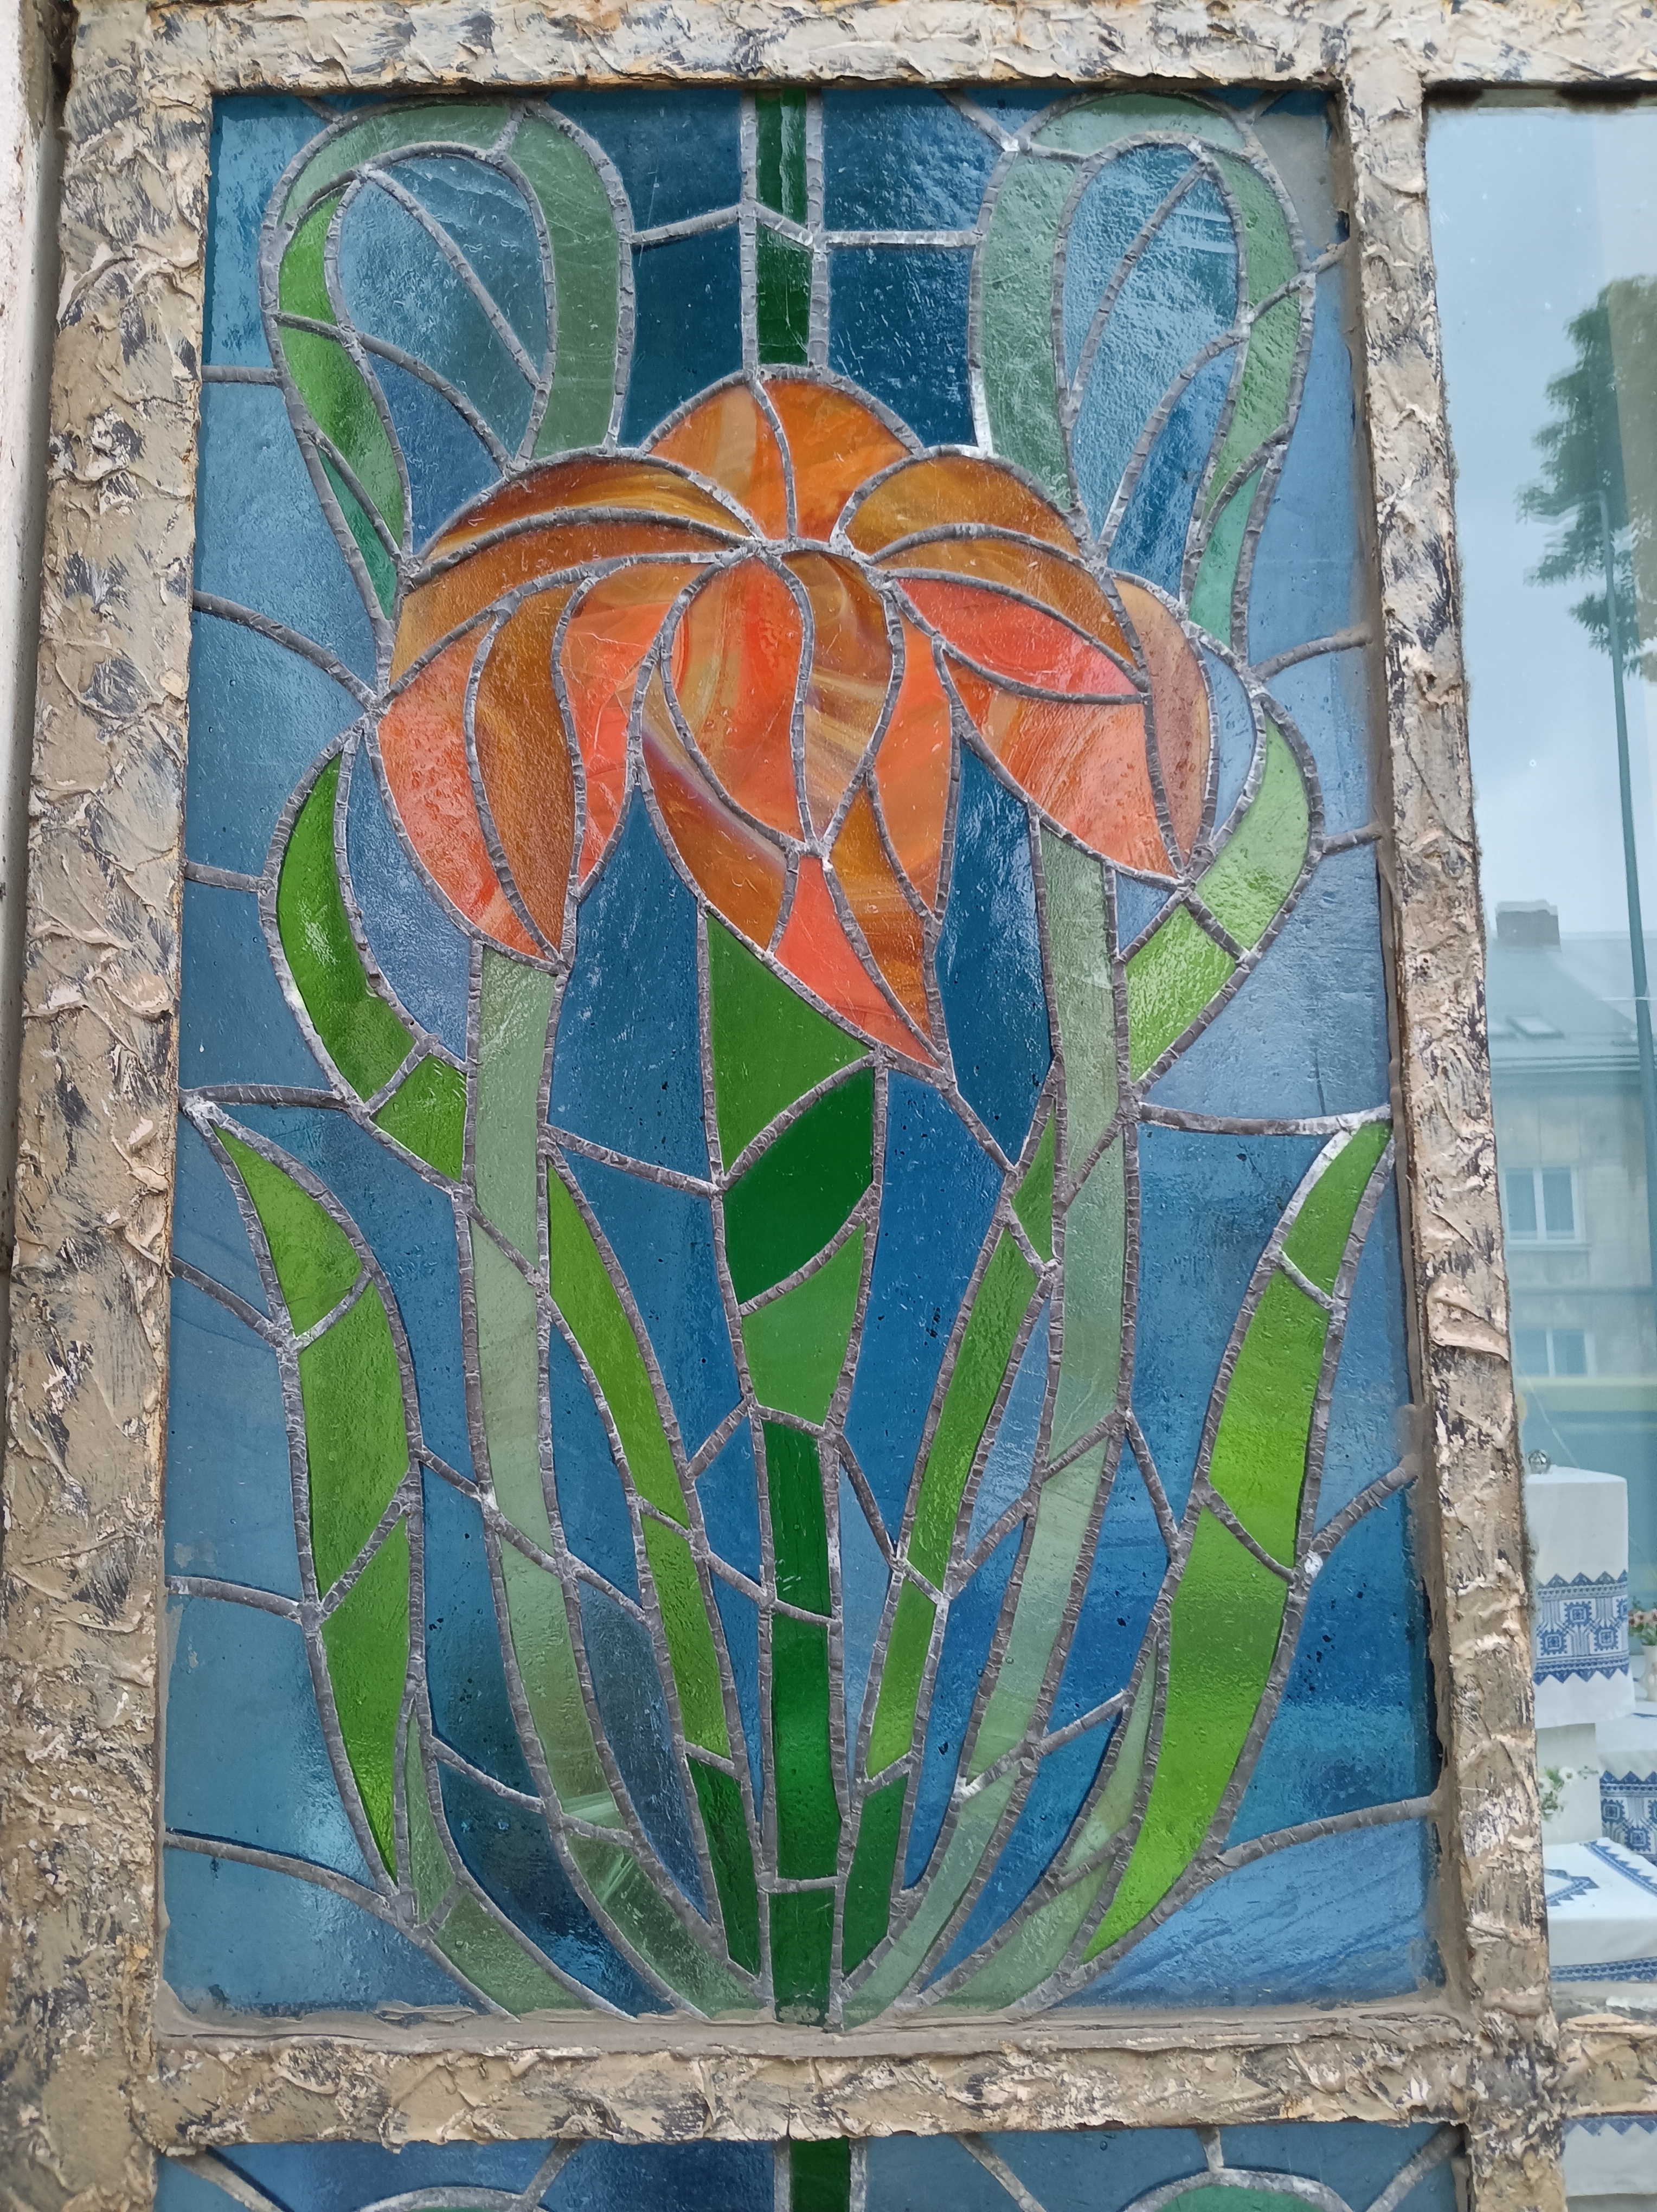
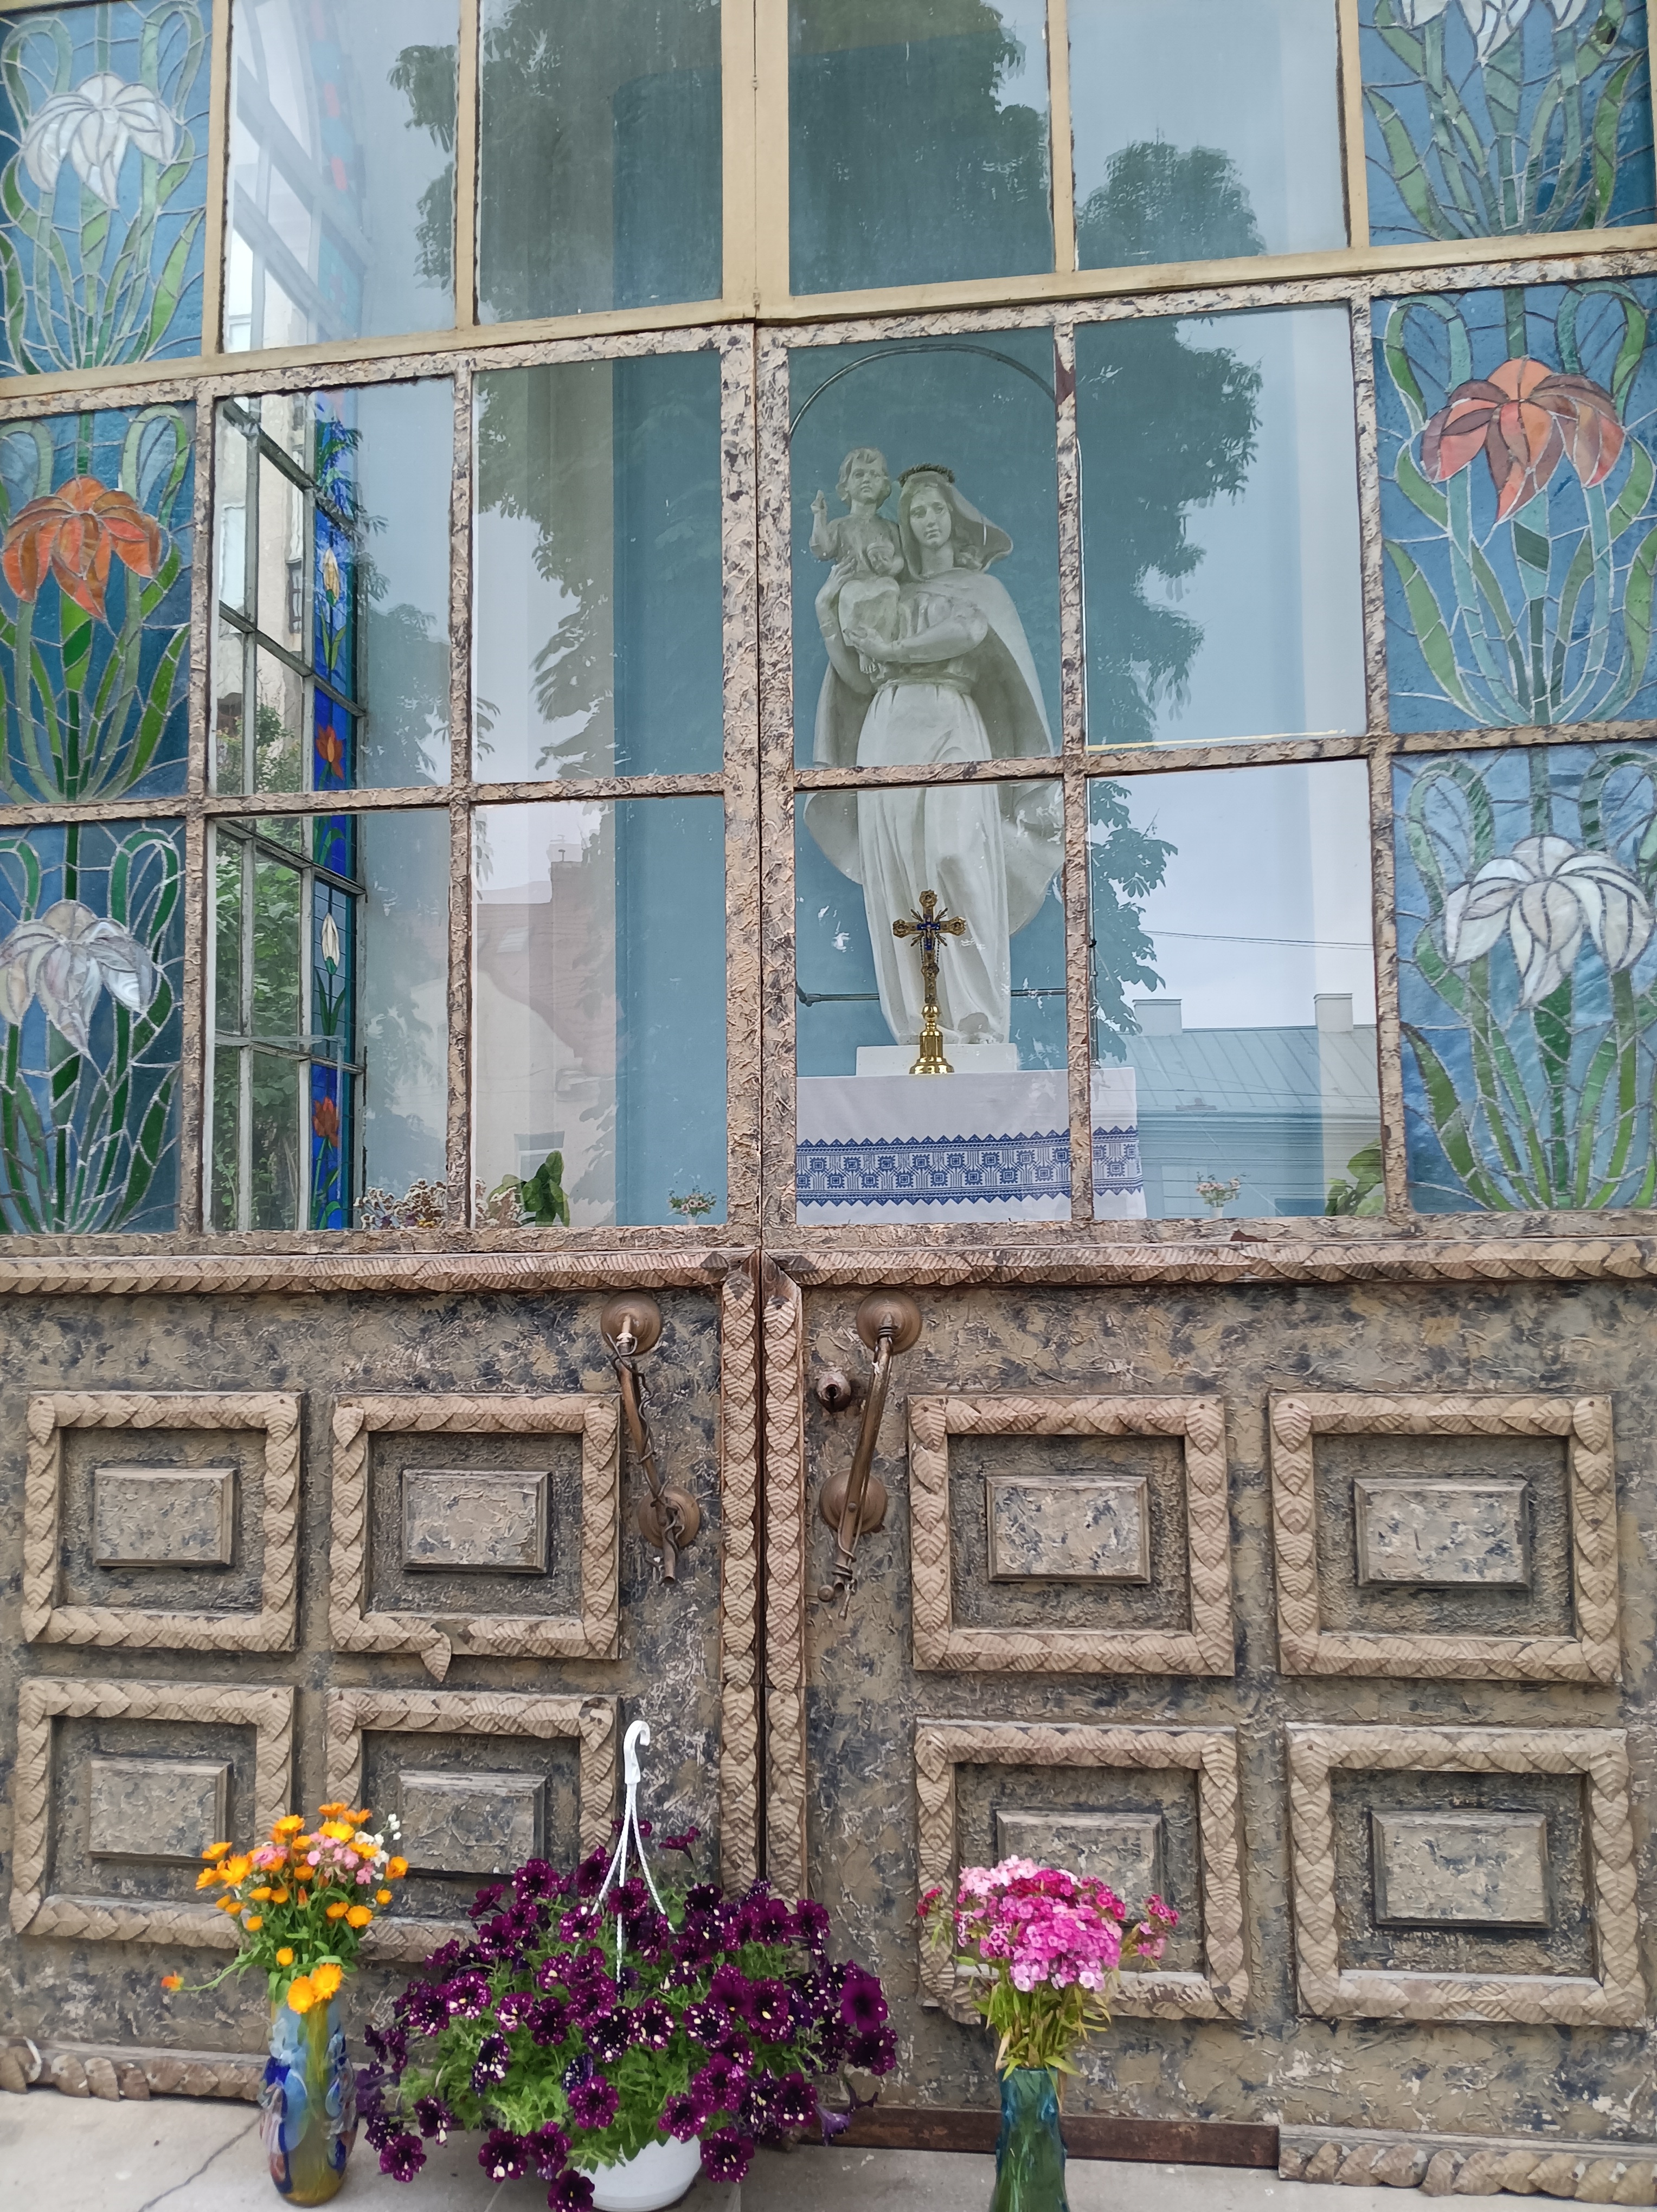
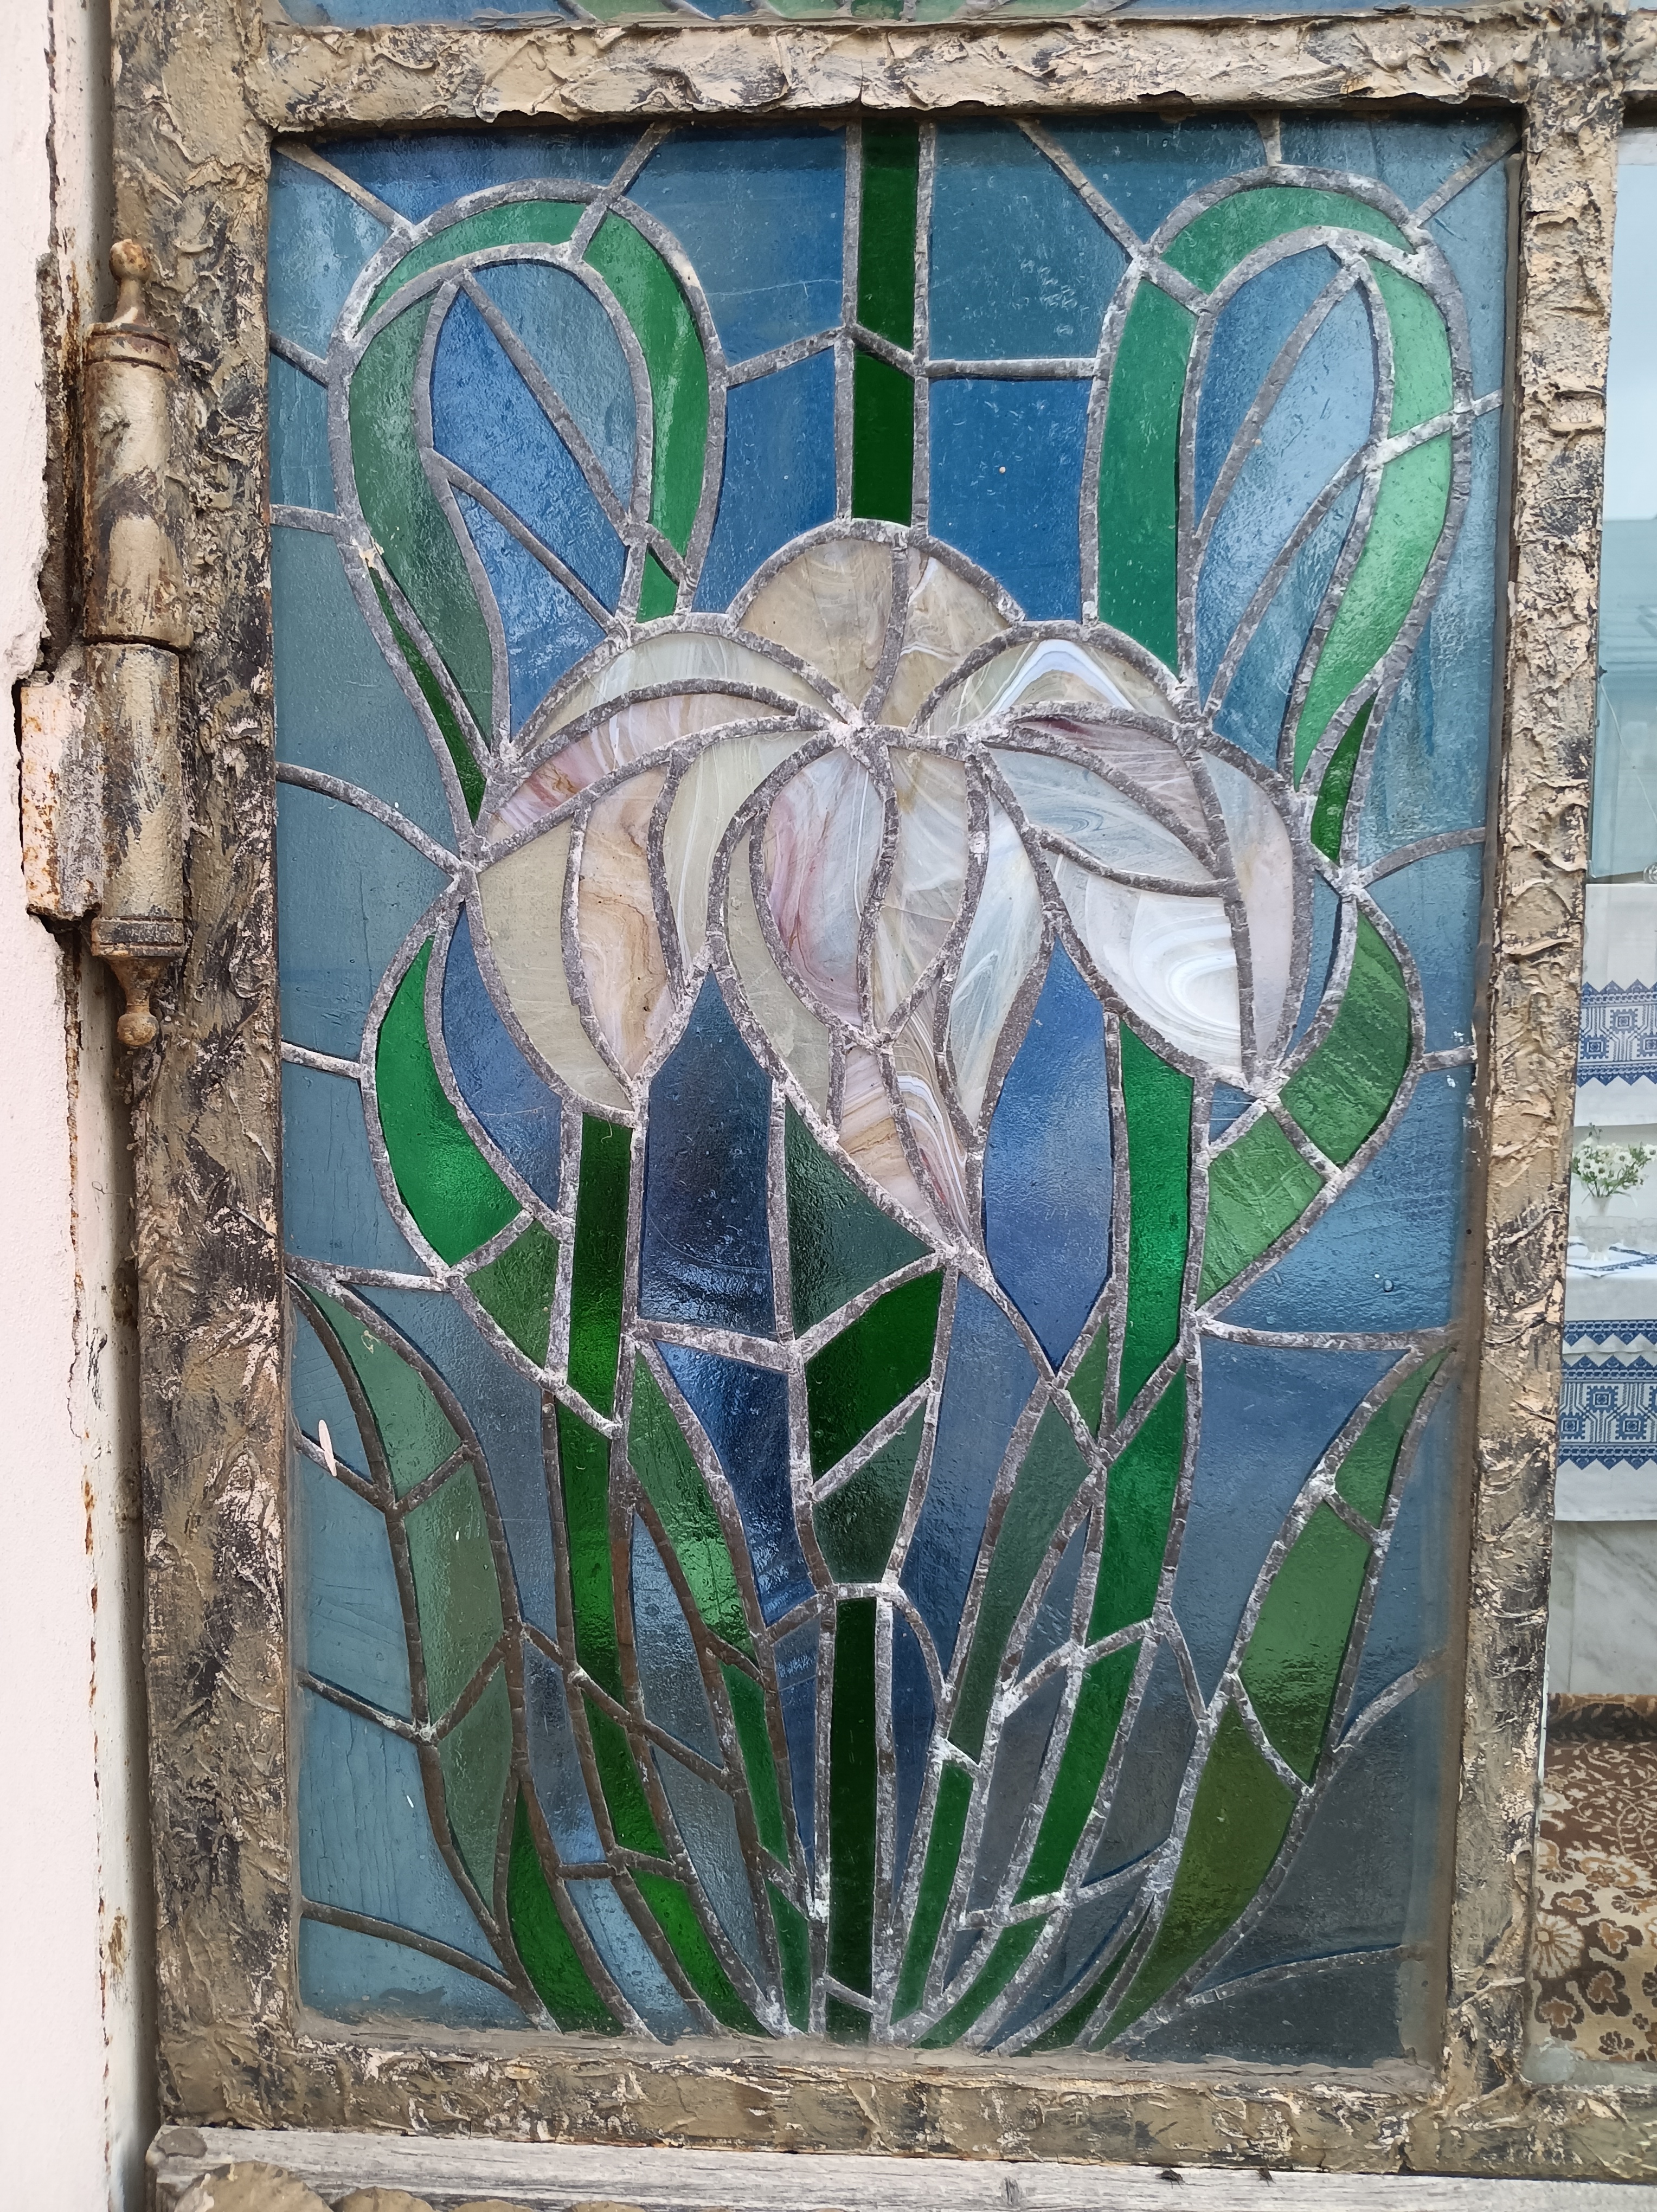
Later I discovered that fruit and vegetables are grown within city limits in small garden plots that people nurture. On half the space of my Delaware gardens they grow twice the fruit. The soil in the Lviv gardens is a dark and black. One such plot nestled in front of a large residential appartment complex adjacent to a religious shrine. Three sides of the shrine are framed with stained glass window pains similar to those my wife Dragonfly Leathrum makes. Looking closely, I discern identical designs of the flowers, however, the variation of the glass color and its arrangement is not. It is only now that I see the design and its symmetries, but I do recall the soothing and calming effect the shapes and colors had on me when I walked past it 15 days ago.
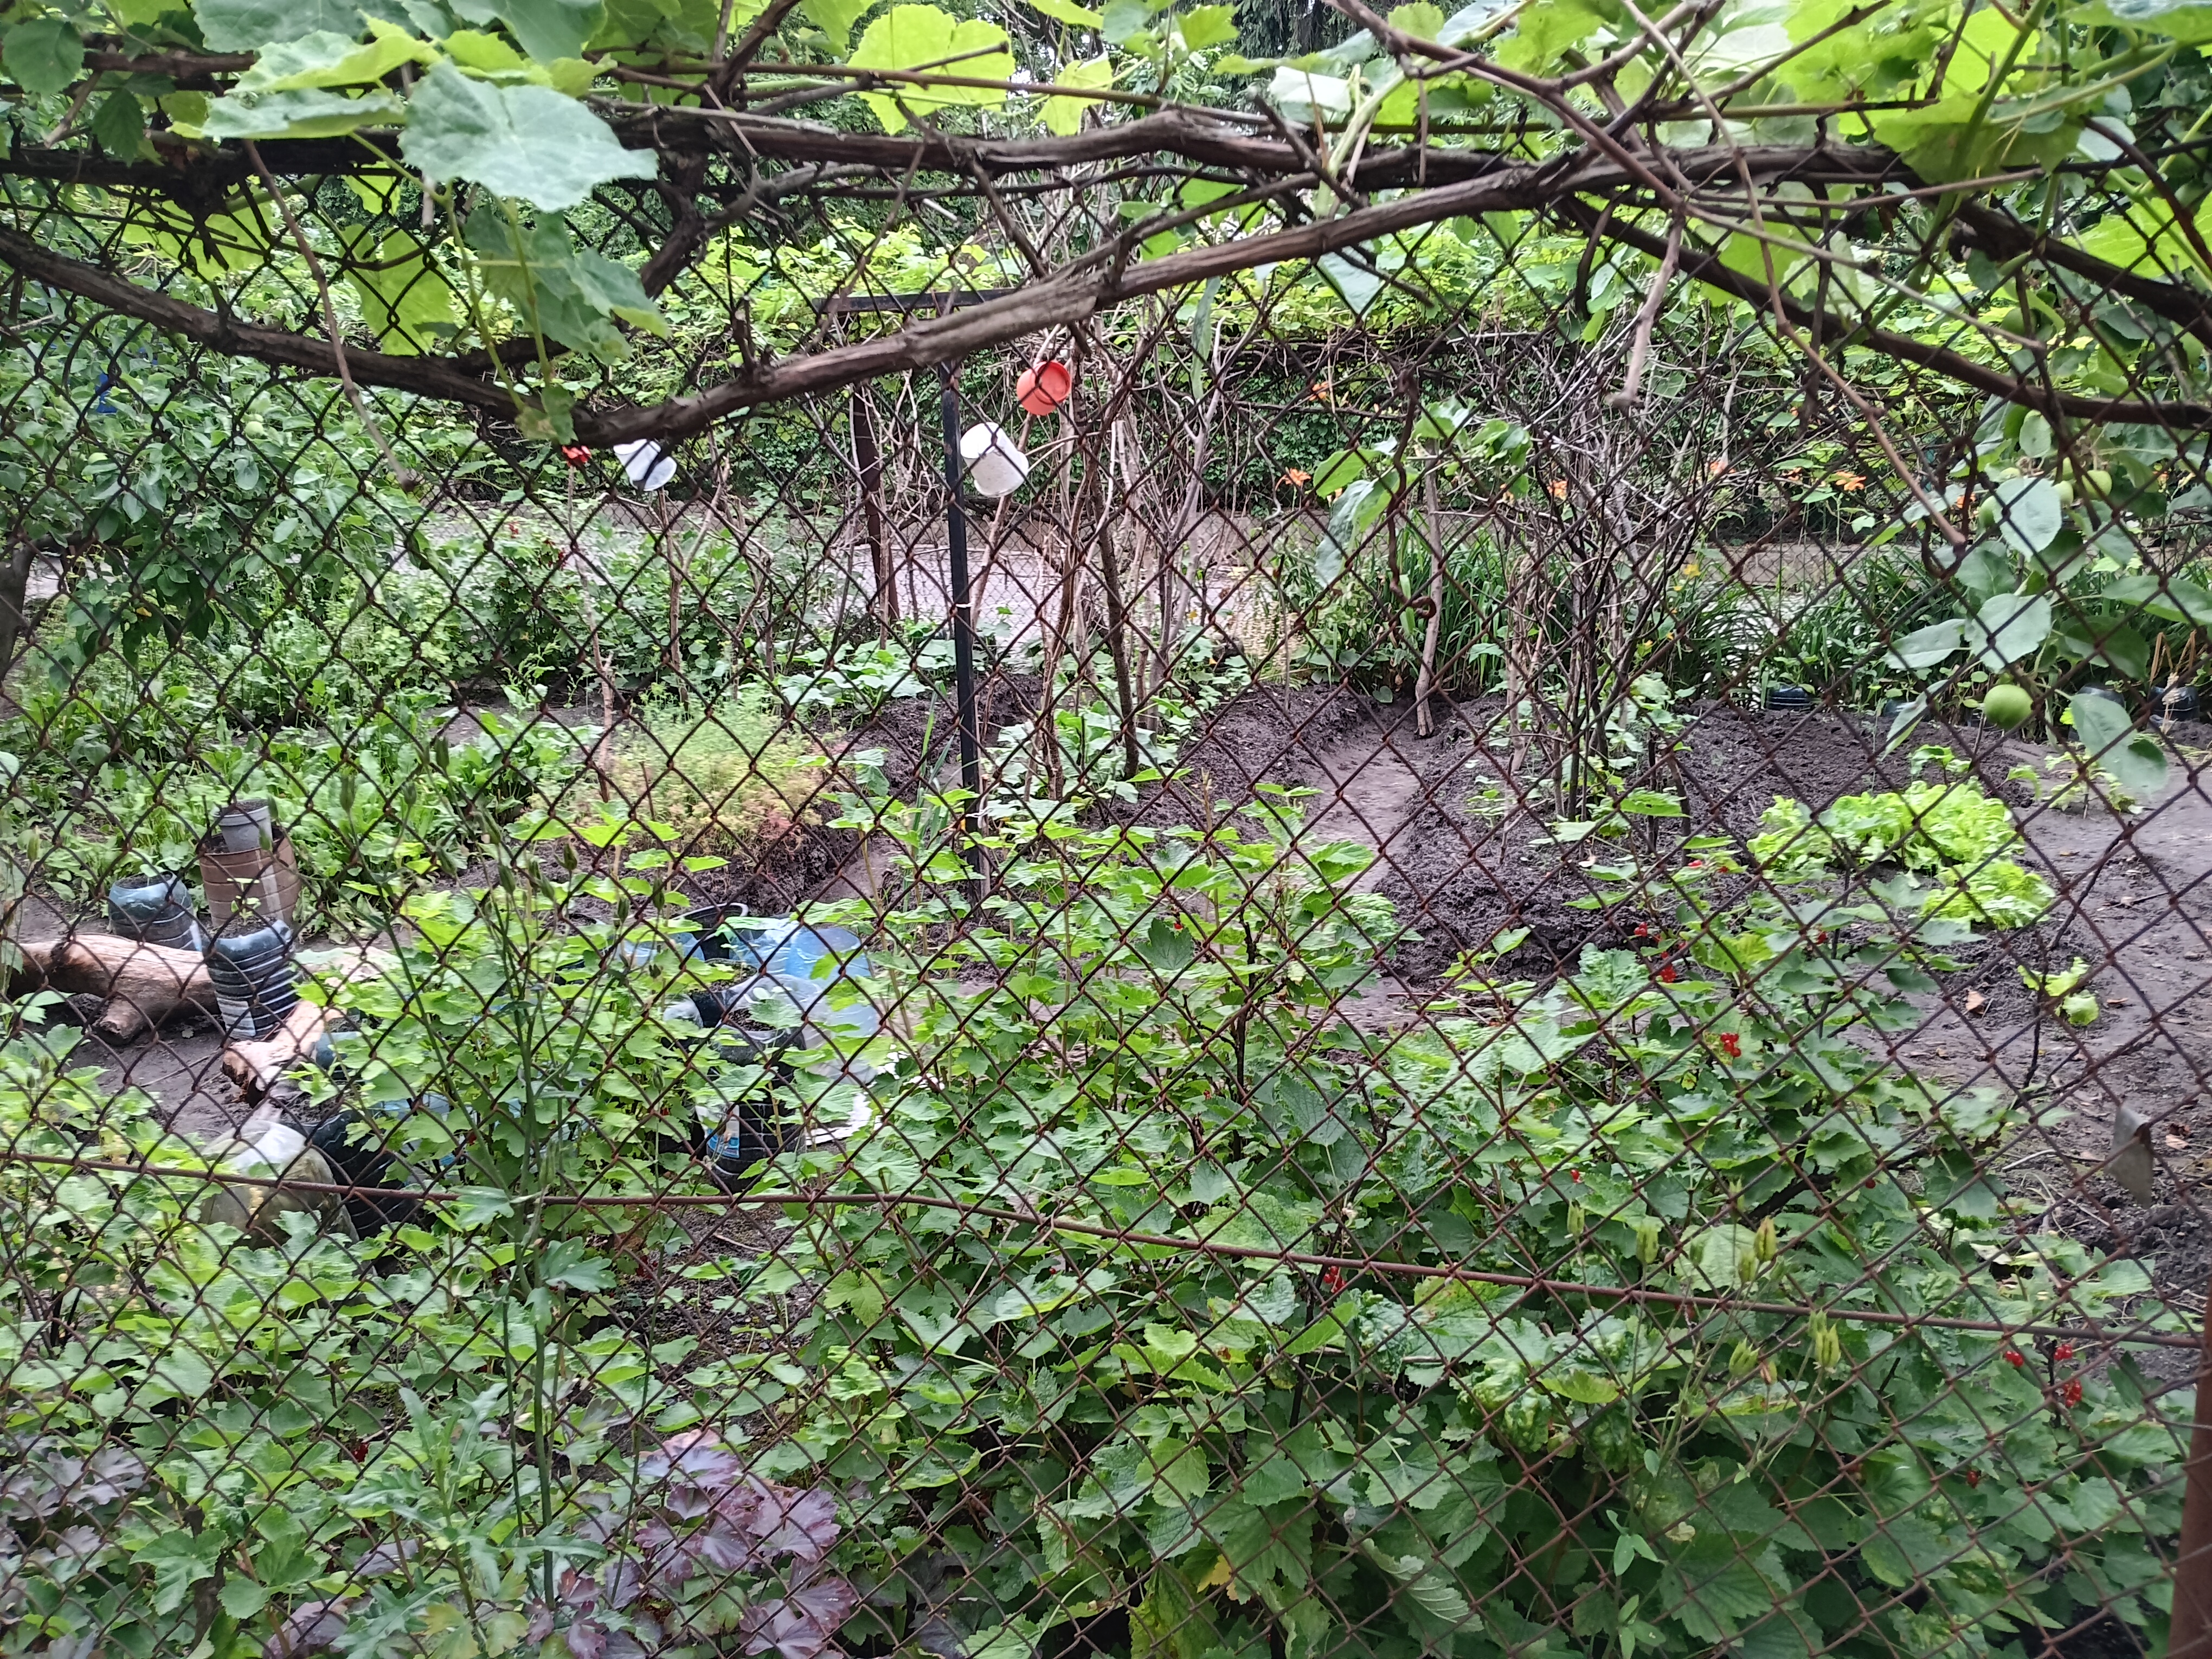

The tiny garden contained an apple tree, several Red Currants bushes, grapes growing up and along the fence, beans, carrots, beets, and cucumber. The stage of all these plants was similar to those that I grow in my own garden. A plastic bag of kitchen scraps for a compost was hanging over the door to enter the plot. It almost seems that neigbors left these for the owner to work into the soil. My sister Christina does the same for me when she visits sundays and leaves her kitchen scraps for my compost.
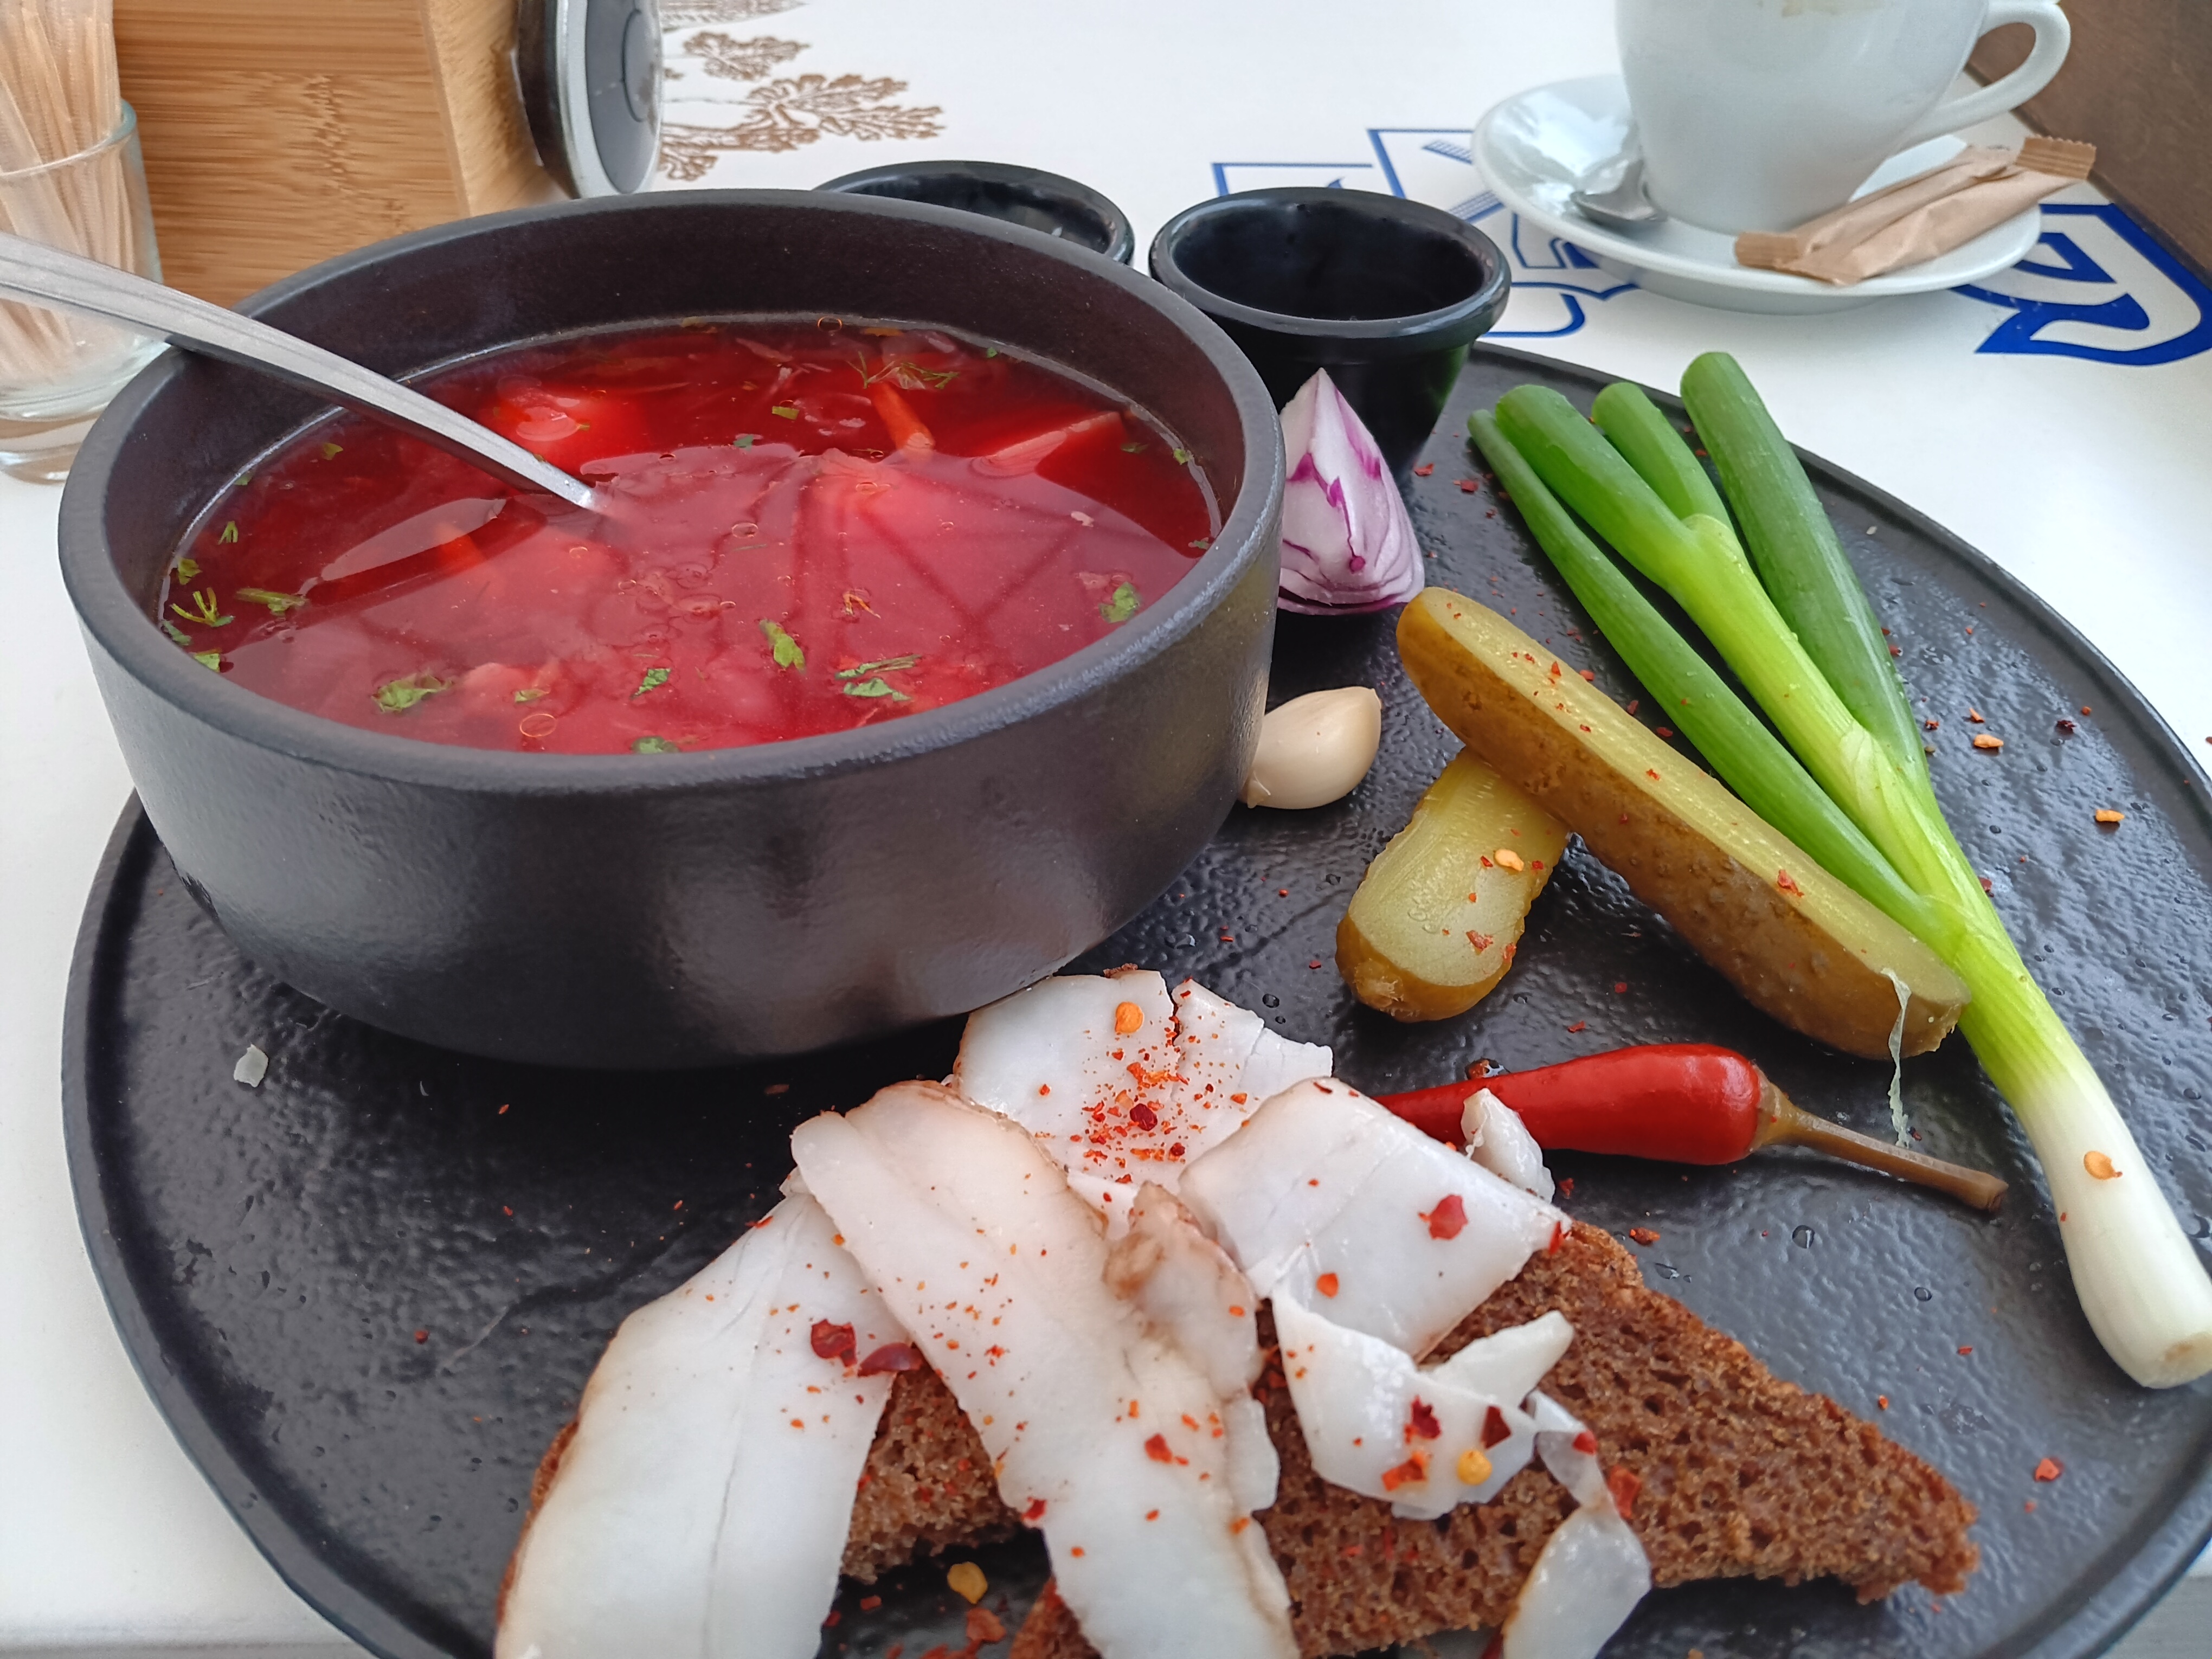
Rain moved me away from the shrine and its adjacent garden to seek shelter. I quickly found a restaurant with covered outdoor seating. My first meal since arriving in Ukraine was Borscht. Tiny rib bones with meat were in the soup, the pure white pork belly fat was on dark rye bread, and a shot of vodka came with it at the end. The presentation of the plate, too, reveals artful intent. The red onion, pepper, pickles, garlic, and scallion are all arranged carefully. Even the sprinkles of red chili flakes on the white fat are no accident and like a painting complement the red of the soup. The outstanding restaurant has a website, e.g., https://marinad-meat-bar.choiceqr.com/, as I just learnt 😉
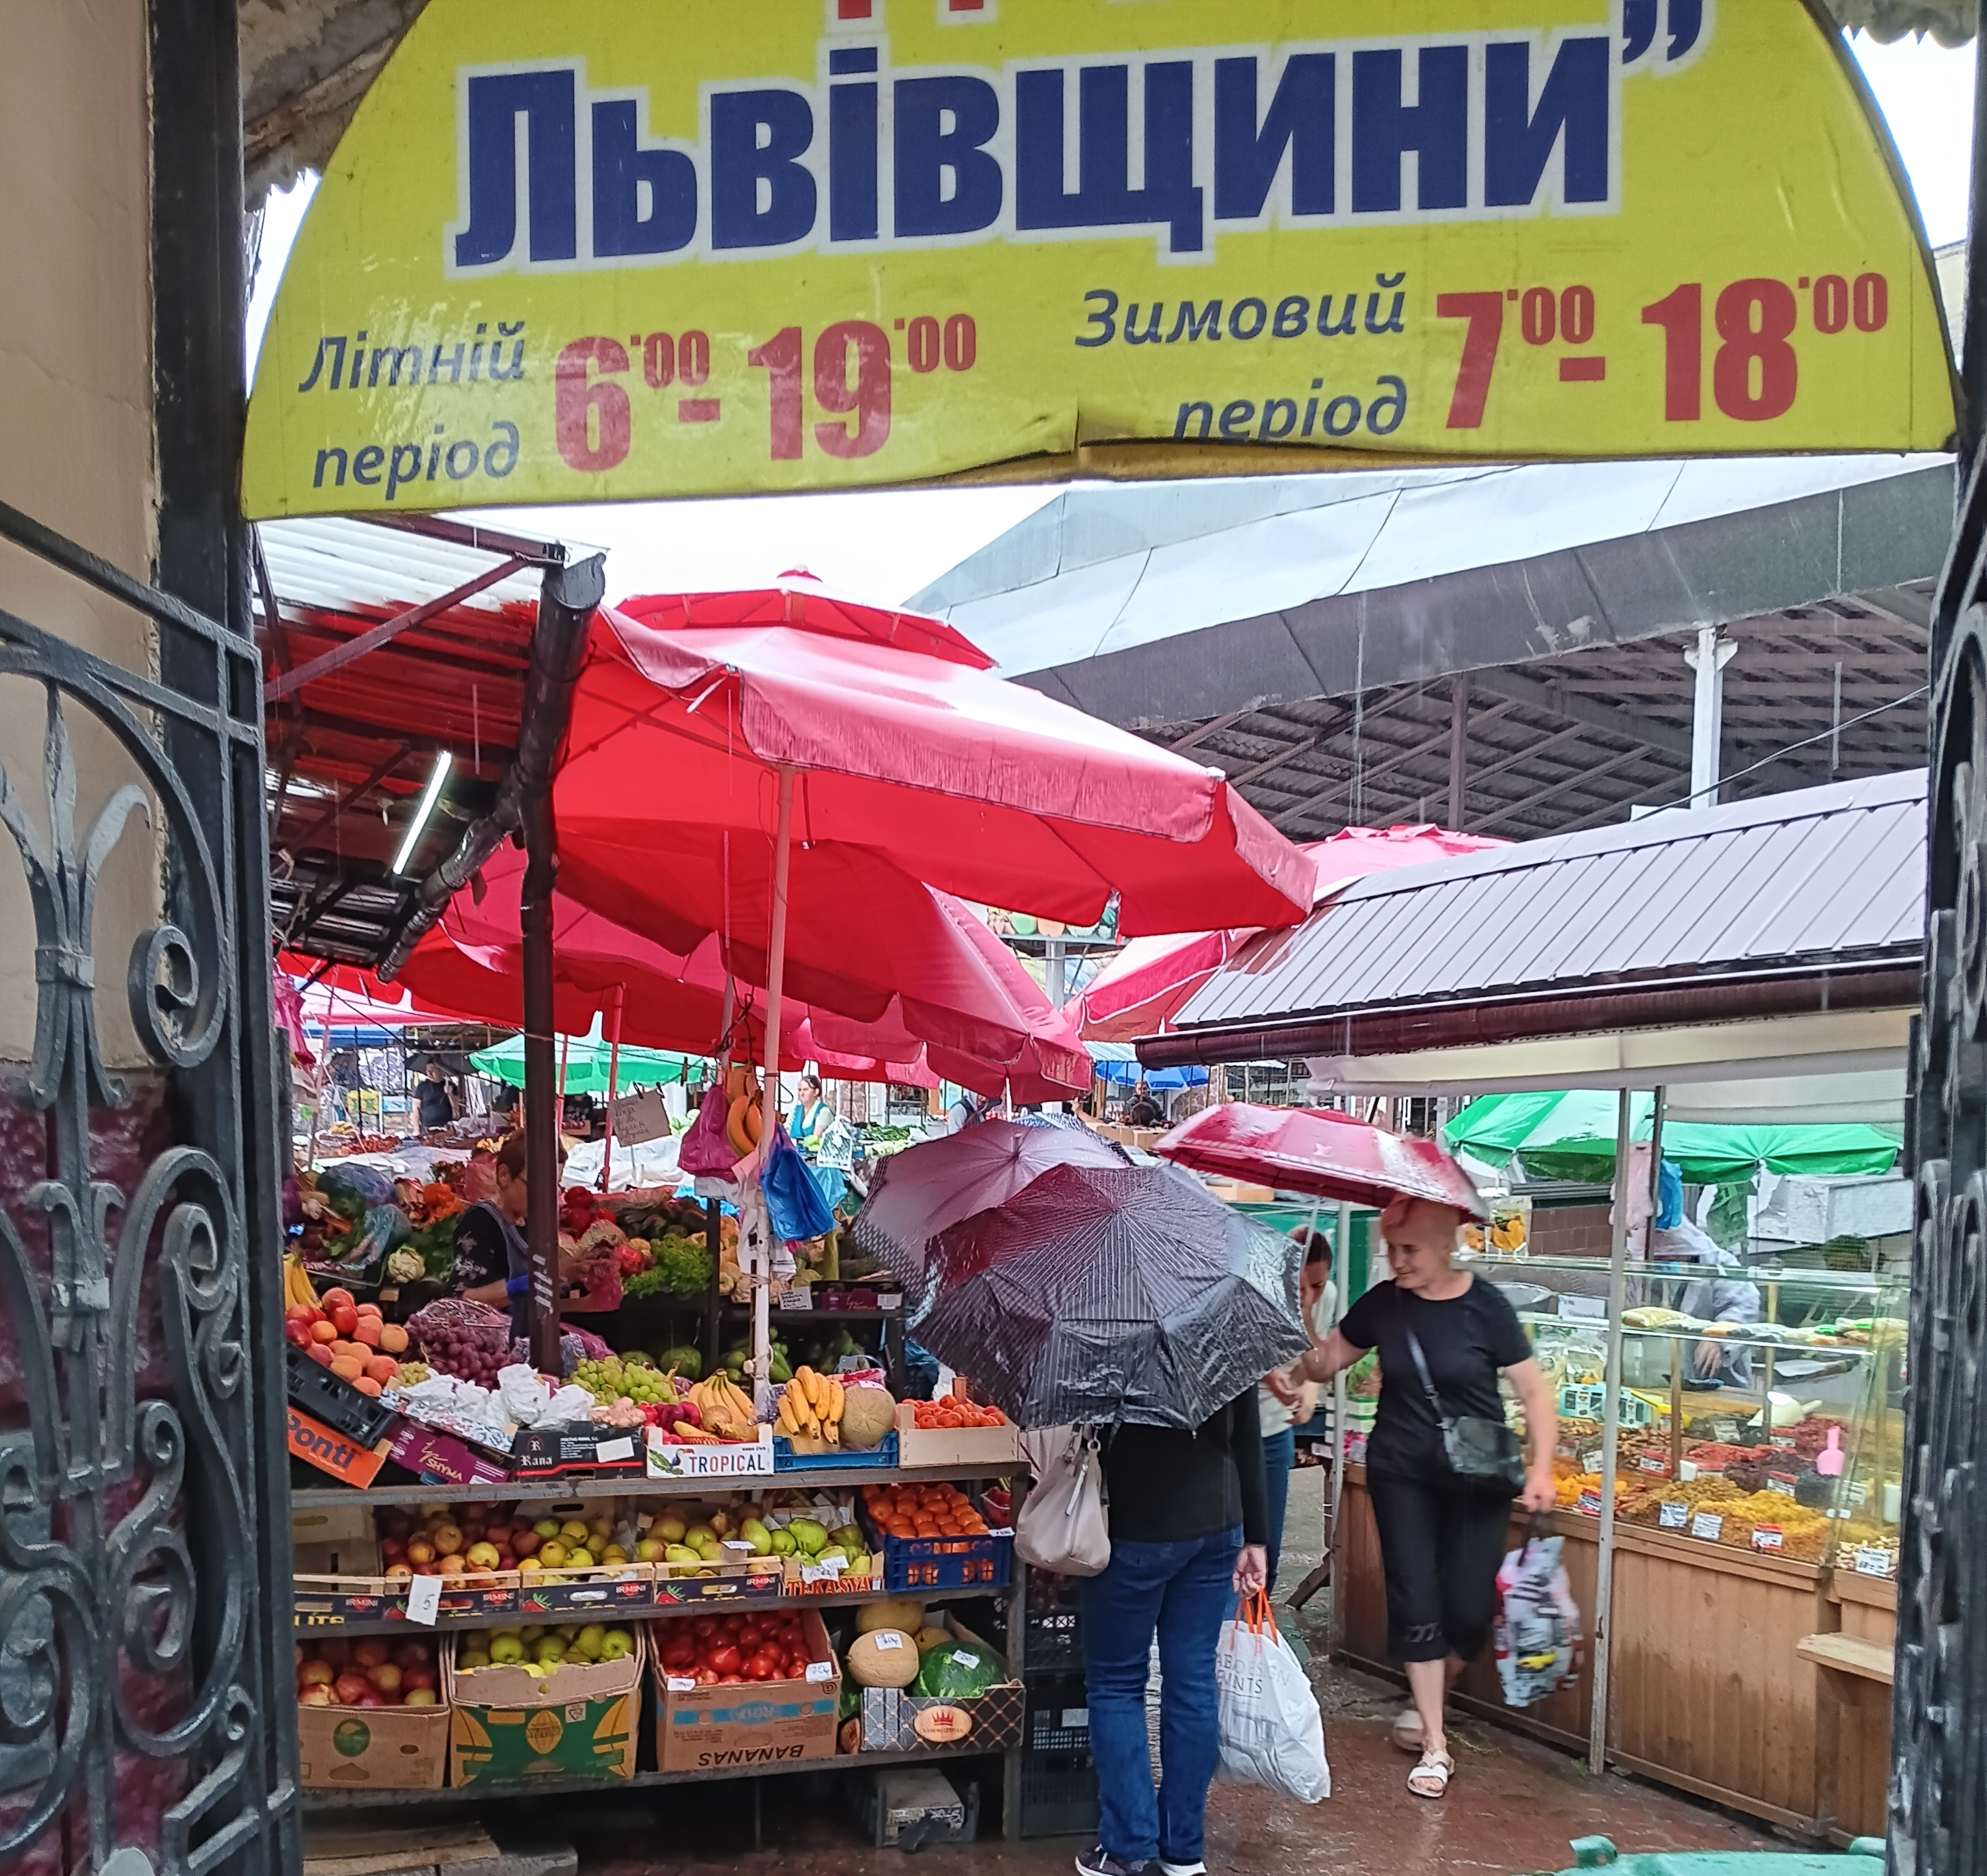
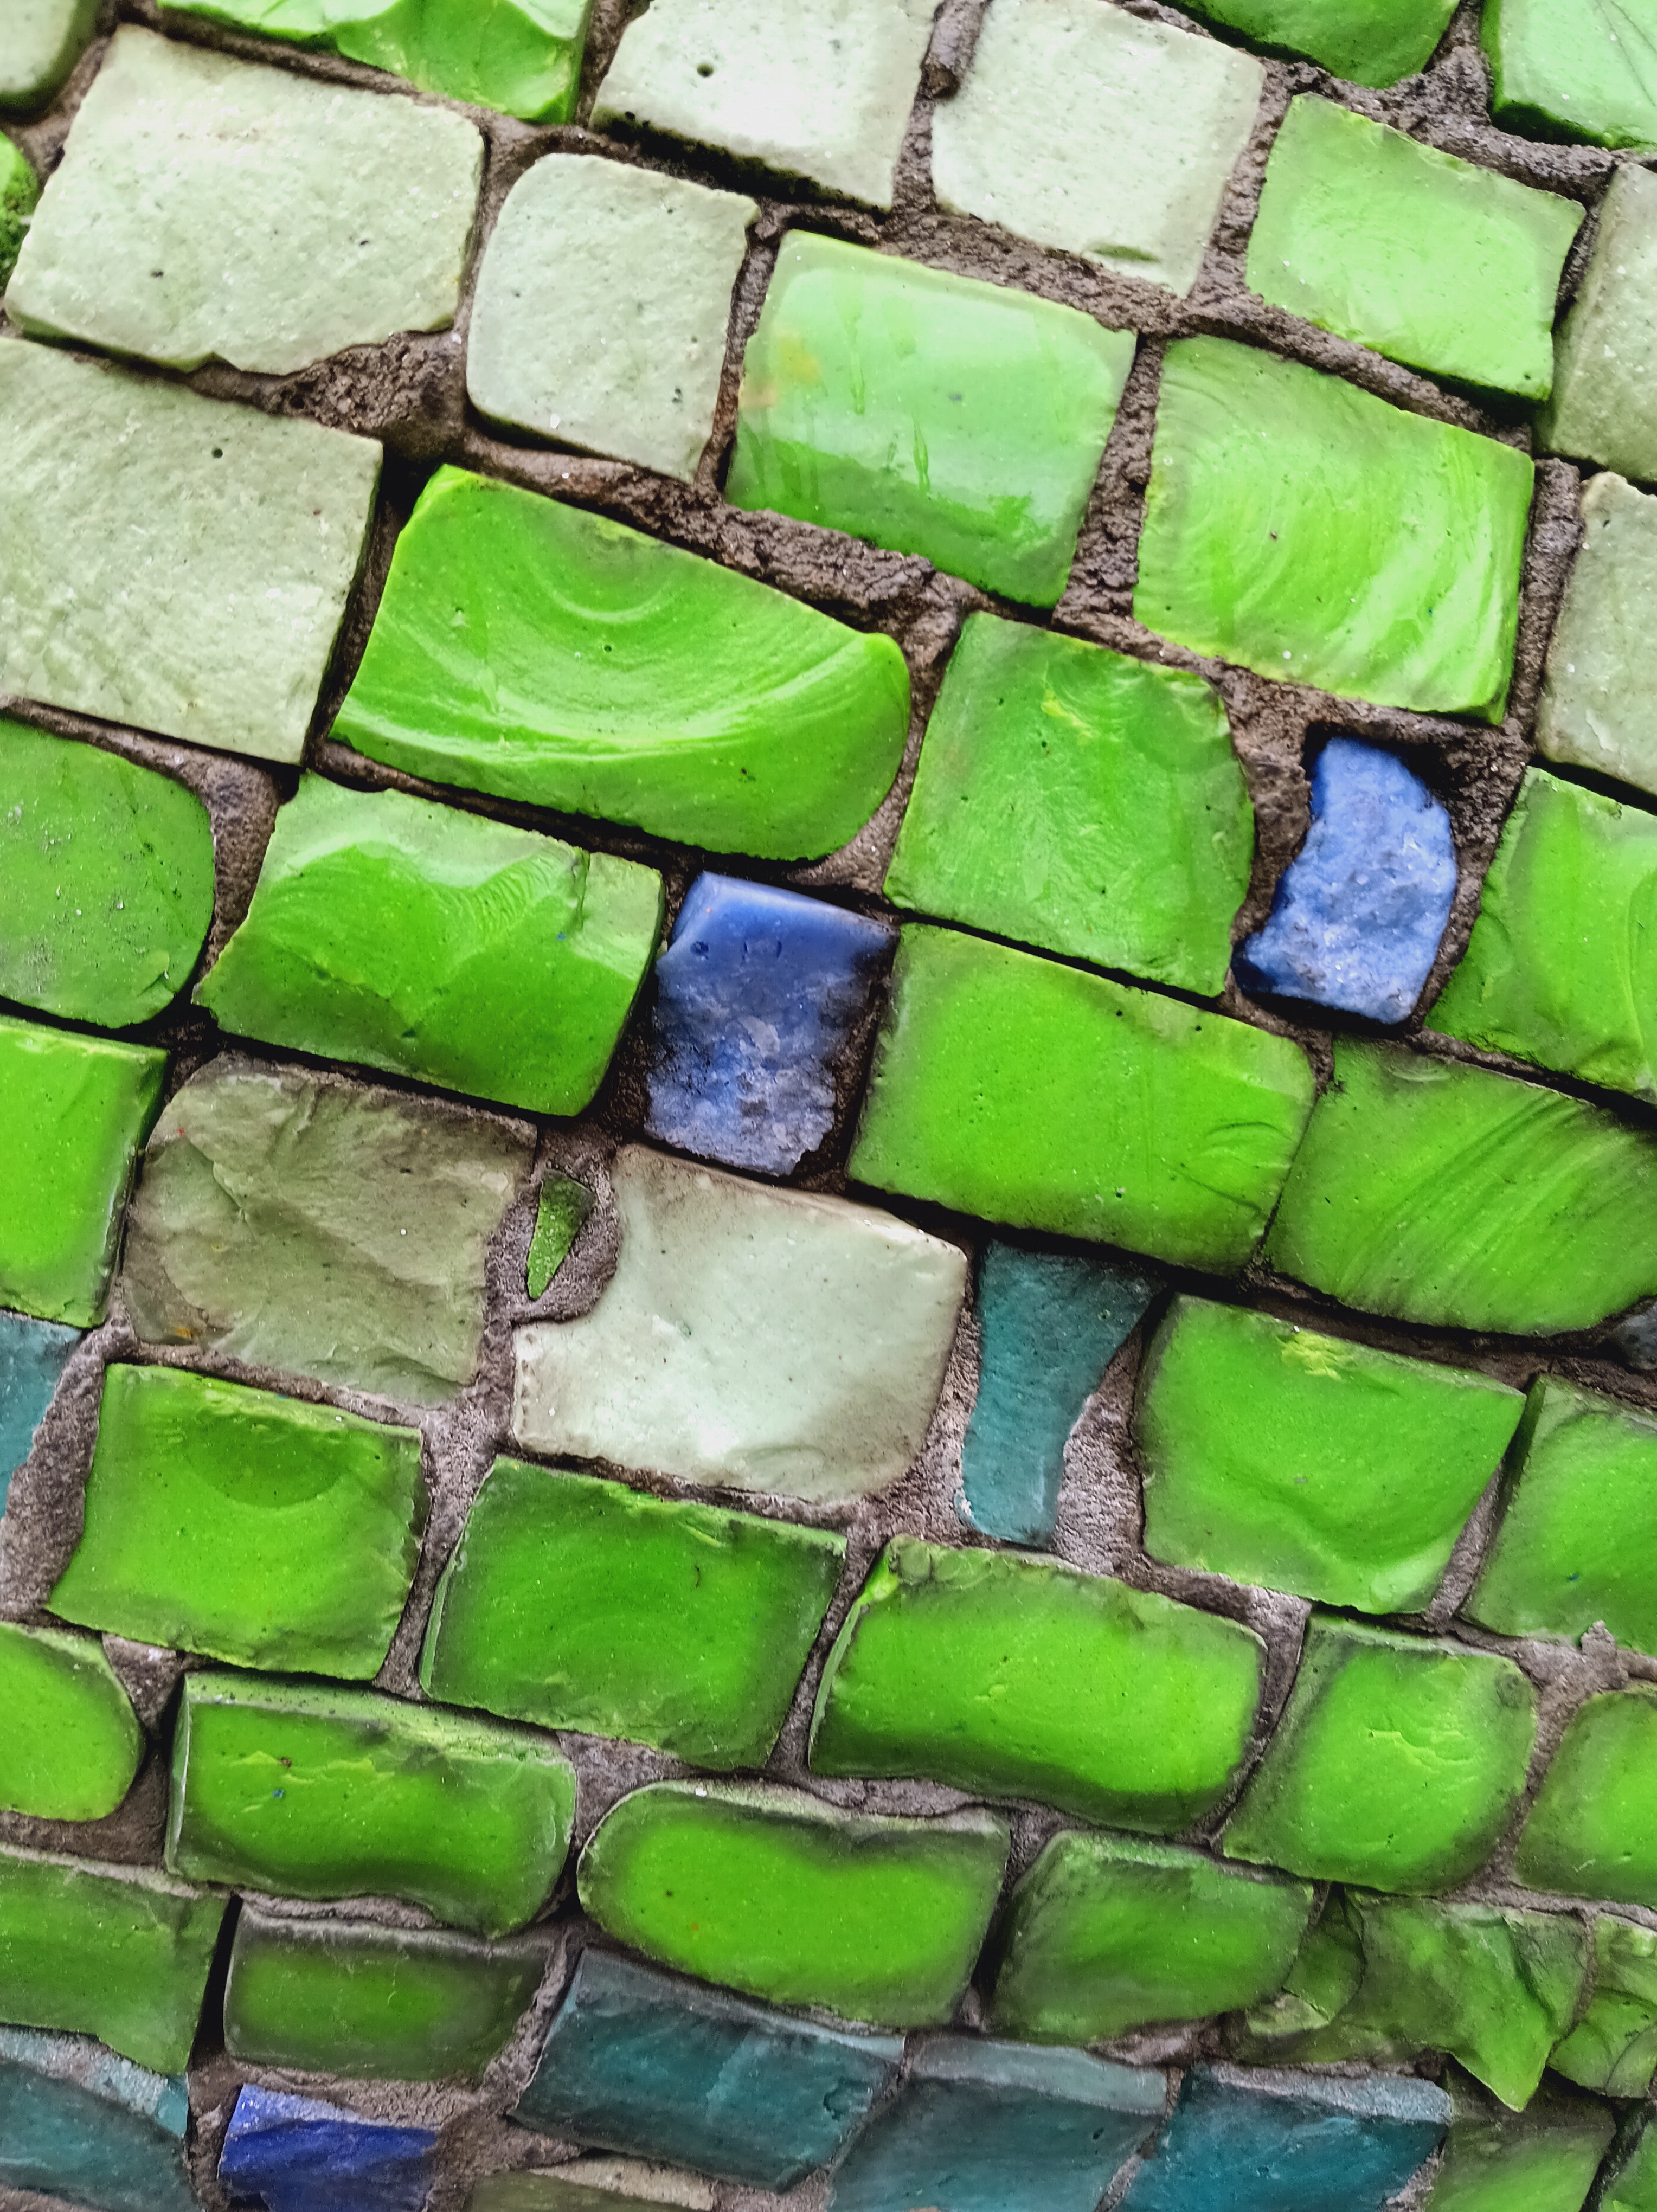
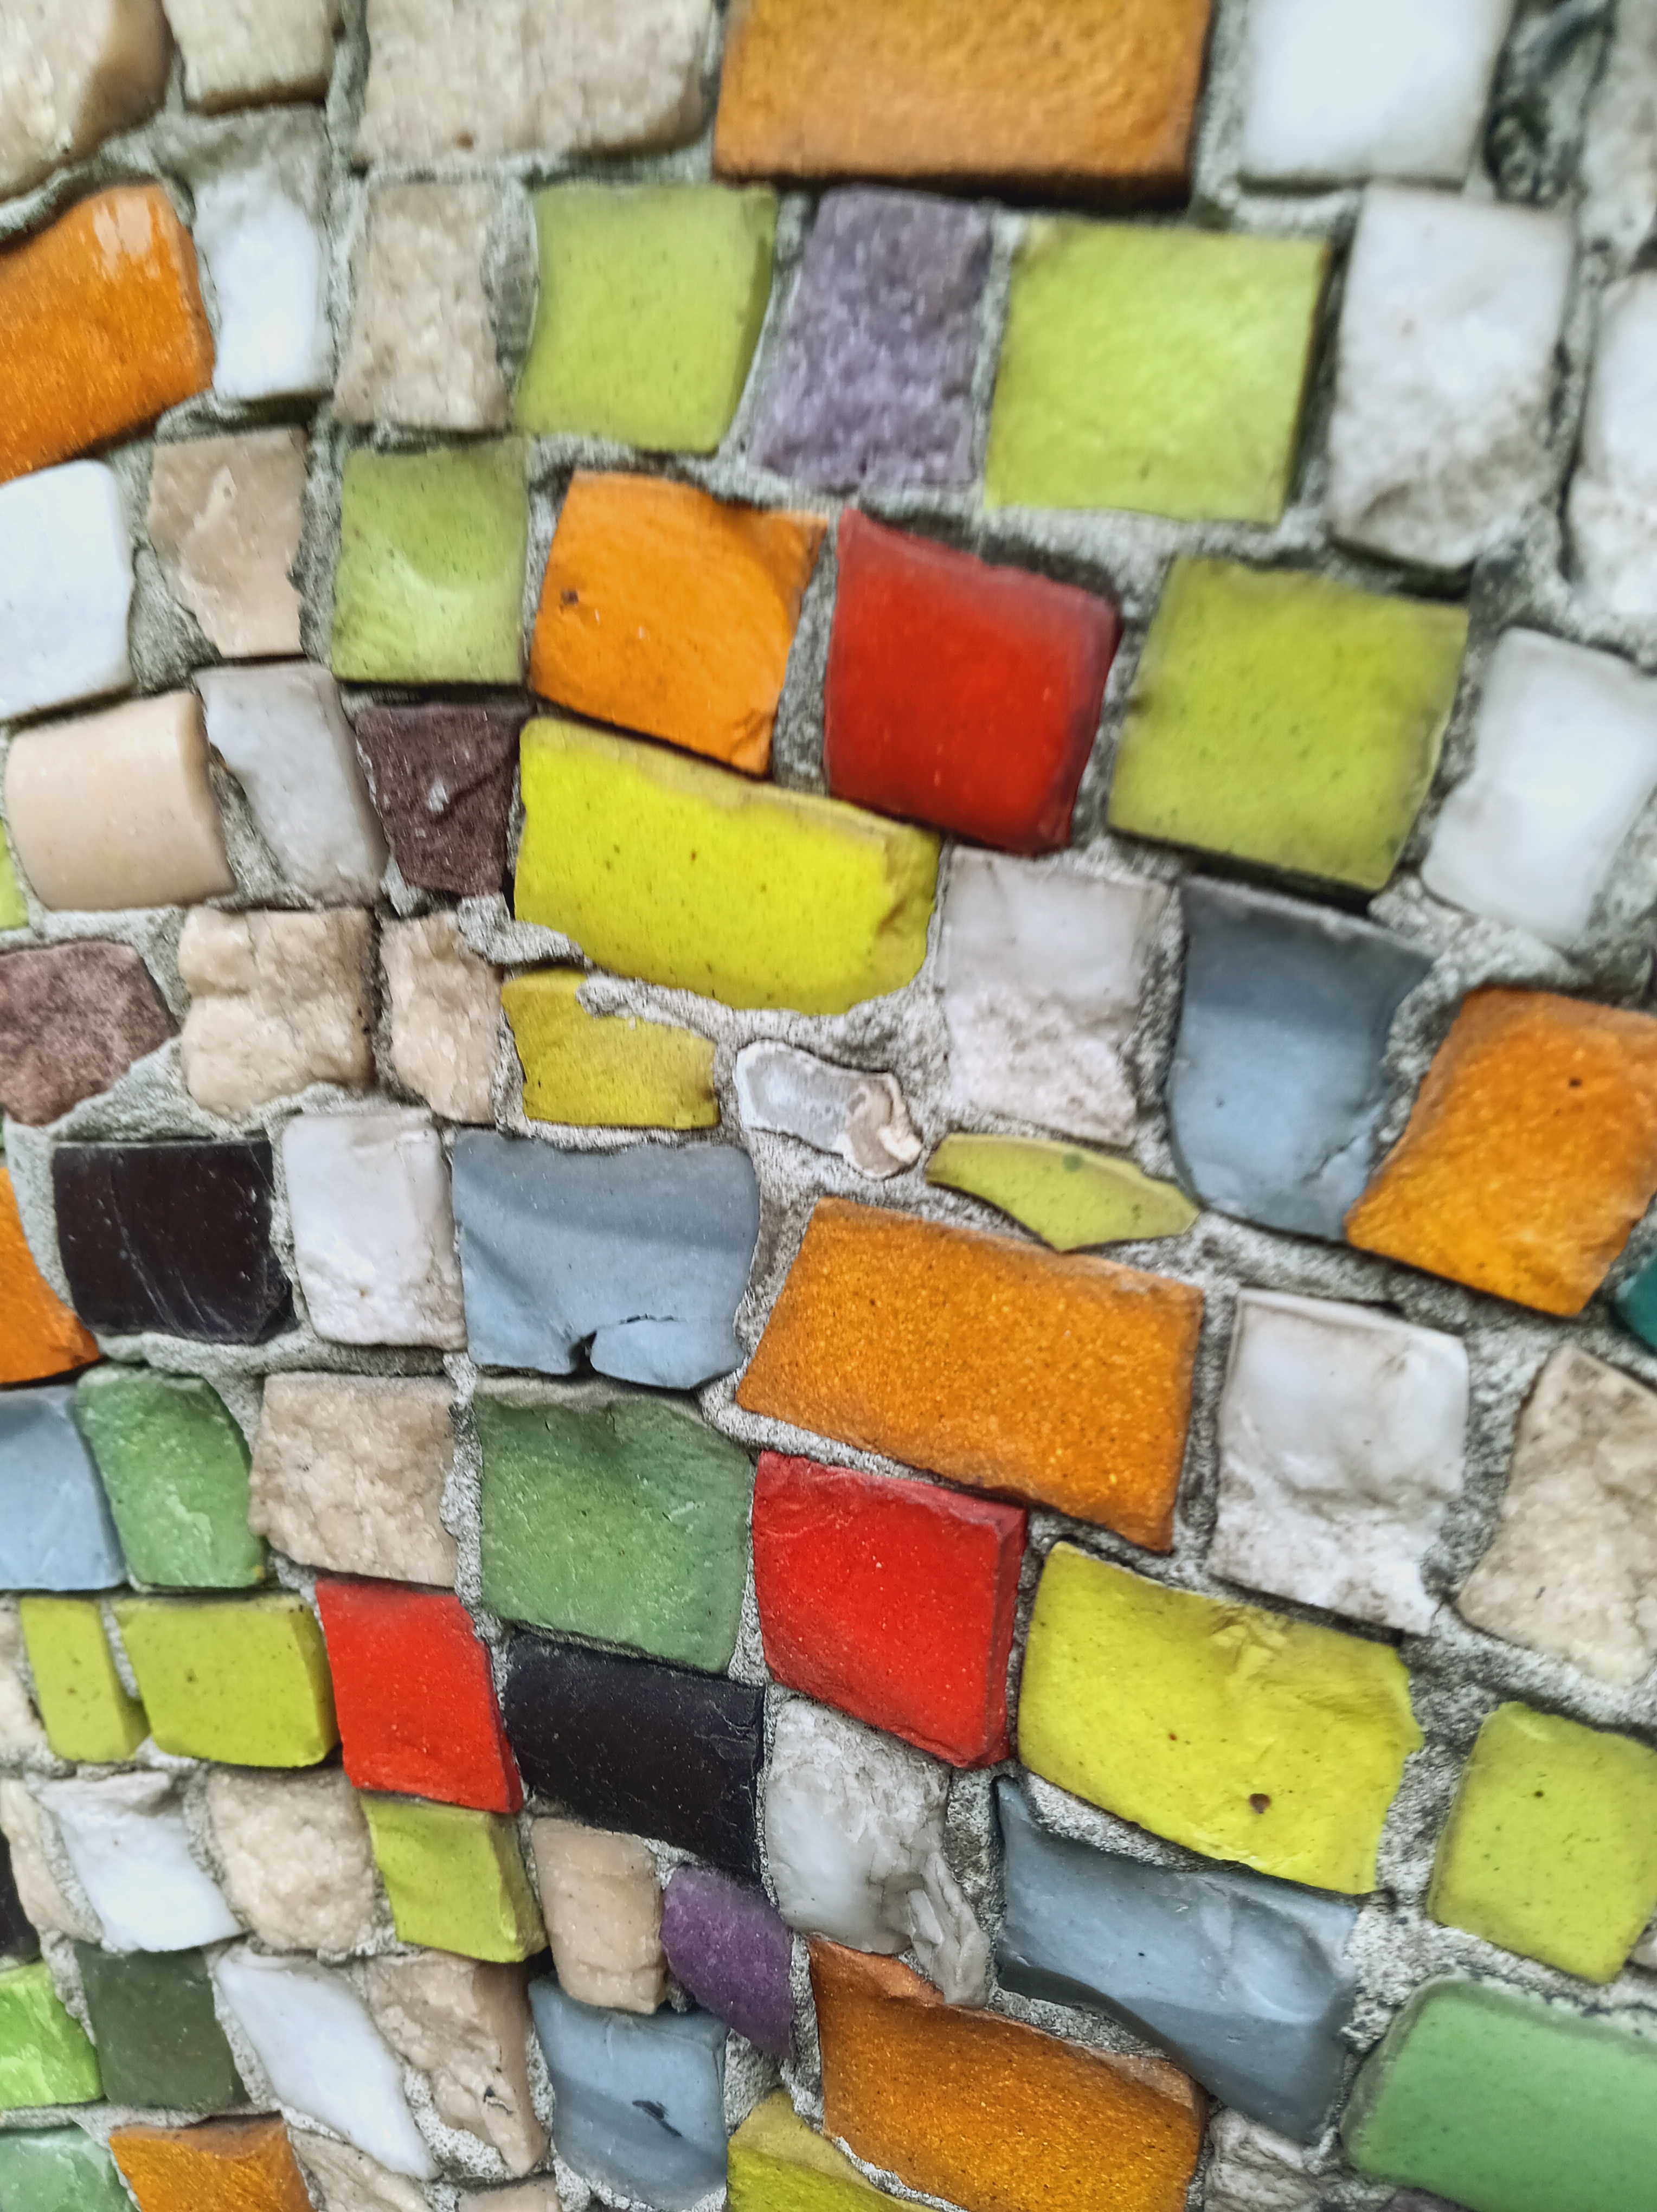
Talking about art in public places, I return to a mosaic sculpture at the farmer’s market. The market sits on a wide corner at the intersection of two large cobblestone streets. A tram line goes towards the shrine and the restaurant where I had my late lunch. A low wall encloses the fruit and vegetable stands inside and on one side this wall contains an exquisite mosaic of tiny colorful tiles. From afar colorful strands emerge that intersect and overlap smoothly without any color or strand dominating. Someone had to design this and someone had to put this together and I do not know who did this when, but I admire their love, care, and dedication to colorful and diverse cultures.
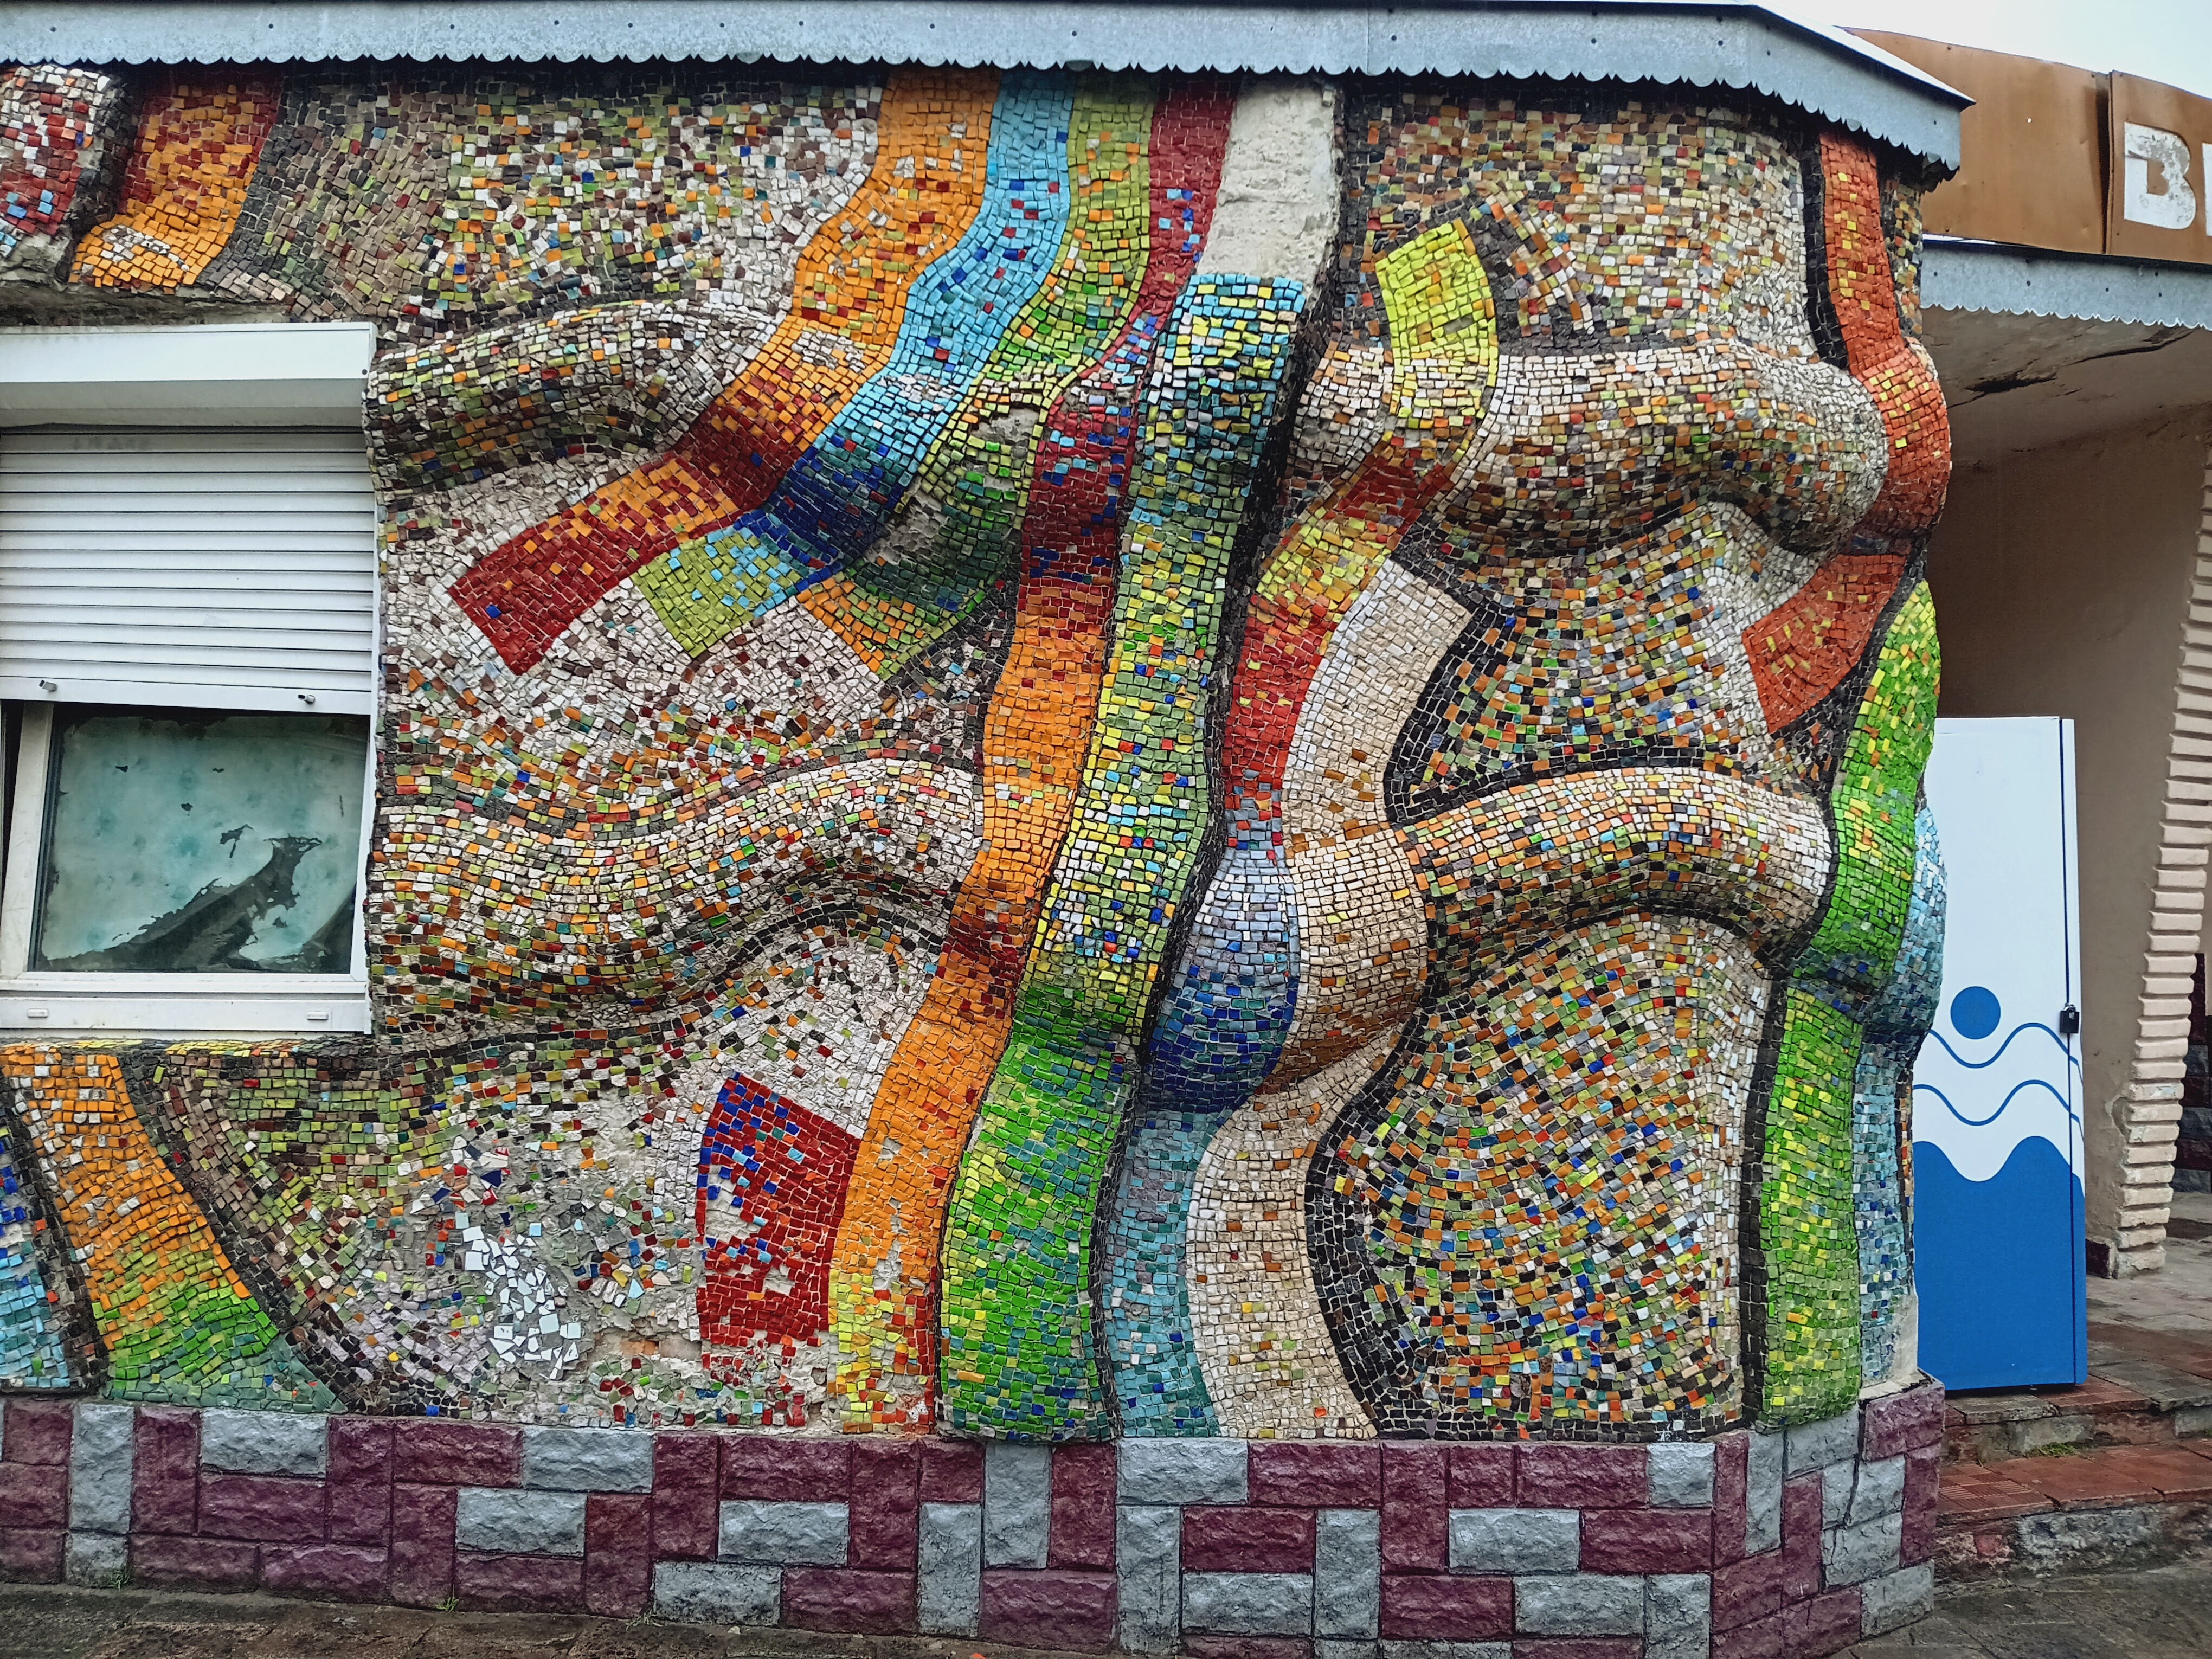
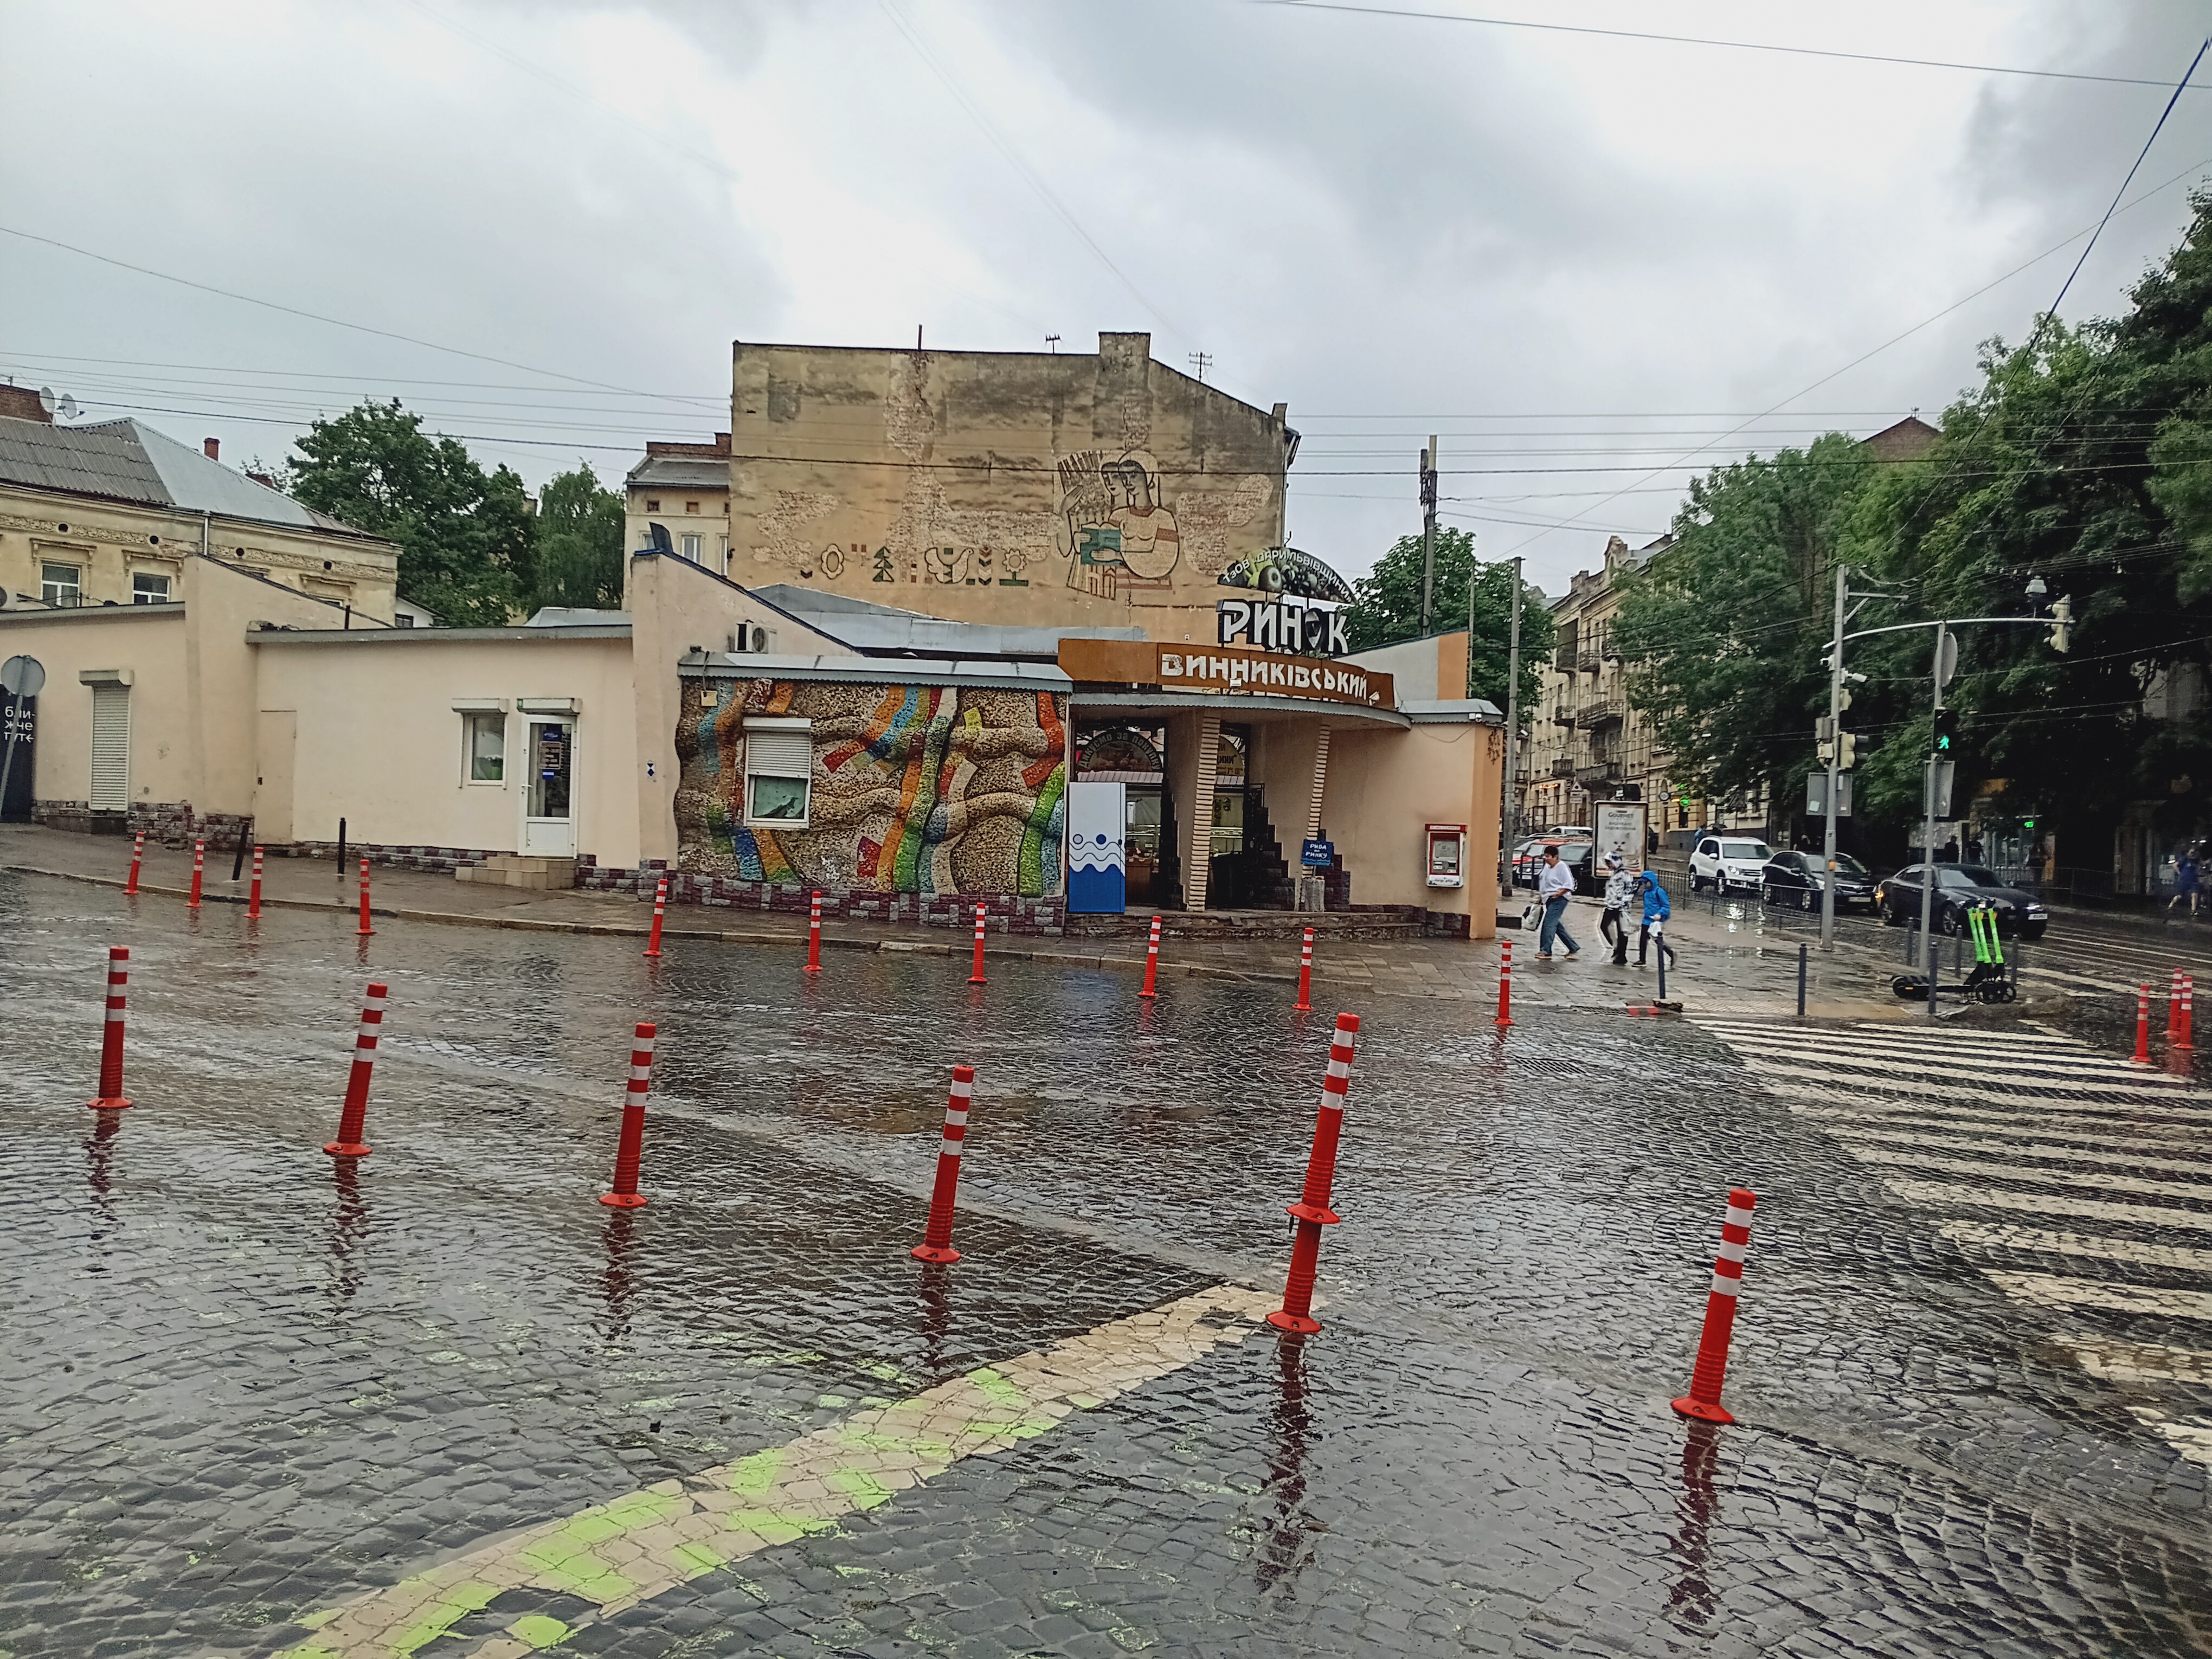
Notice also the mural on the wall above the market of the residential building. Two women tend to something and a line of symbols emerges along the base. Like most street art in Lviv, this one is not signed by the artist(s) either. I discern a peace dove and a sunflower … Again I only now notice this detail in the photo.