Vincent Van Gogh painted his most turbulent images when insane. The Labrador Current resembles Van Gogh’s paintings when it becomes unstable. There is no reason that mental and geophysical instability relate to each other. And yet they do. Russian physicist Andrey Kolmogorov developed theories of turbulence 70 years ago that Mexican physicist applied to some of Van Gogh’s paintings such as “Starry Sky:”
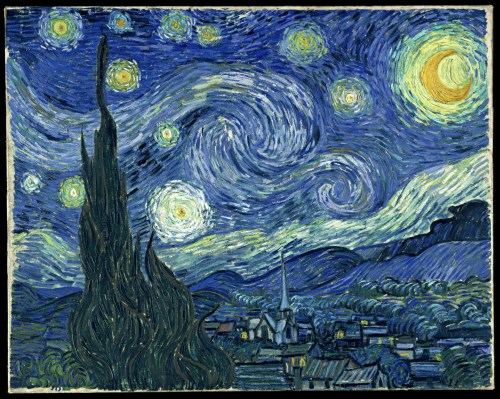
Vincent Van Gogh’s “Starry Sky” painted in June 1889.
The whirls and curls evoke motion. The colors vibrate and oscillate like waves that come and go. There are rounded curves and borders in the tiny trees, the big mountains, and the blinking stars. Oceanographers call these rounded curves eddies when they close on themselves much as is done by a smooth wave that is breaking when it hits the beach in violent turmoil.
Waves come in many sizes at many periods. The wave on the beach has a period of 5 seconds maybe and measures 50 meters from crest to crest. Tides are waves, too, but their period is half a day with a distance of more than 1000 km from crest to crest. These are scales of time and space. There exist powerful mathematical statements to tell us that we can describe all motions as the sum of many waves at different scales. Our cell phone and computer communications depend on it, as do whales, dolphins, and submarines navigating under water, but I digress.
The Labrador Shelf Current off Canada moves ice, icebergs, and ice islands from the Arctic down the coast into the Atlantic Ocean. To the naked eye the ice is white while the ocean is blue. Our eyes in the sky on NASA satellites sense the amount of light and color that ice and ocean when hit by sun or moon light reflects back to space. An image from last friday gives a sense of the violence and motion when this icy south-eastward flowing current off Labrador is opposed by a short wind-burst in the opposite direction:
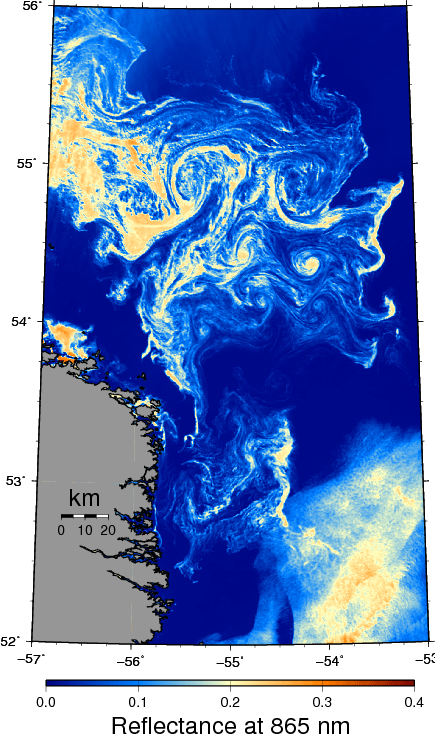
Ice in the Labrador Current as seen by MODIS-Terra on May 3, 2013. Blue colors represent open water while white and yellow colors represent ice of varying concentrations.
Flying from London to Chicago on April 6, 2008, Daniel Schwen photographed the icy surface of the Labrador Current a little farther south:
![Ice fields seen in Labrador Current April 6, 2008 from a plane. [Photo Credit: Daniel Schwen]](https://icyseas.org/wp-content/uploads/2013/05/labrador_current.jpg?w=500&h=333)
Ice fields seen in Labrador Current April 6, 2008 from a plane. [Photo Credit: Daniel Schwen]
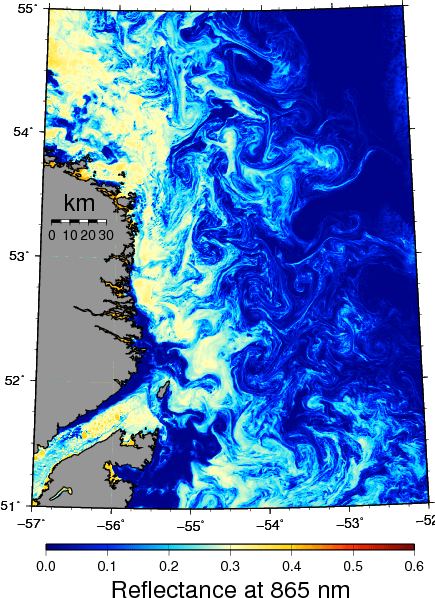
Ice in the Labrador Current as seen by MODIS-Terra on April 6, 2008. Blue colors represent open water while white and yellow colors represent ice of varying concentrations.
The swirls and eddies trap small pieces of ice and arrange them into wavy bands, filaments, and trap them. The ice visualizes turbulent motions at the ocean surface. Also notice the wide range in scales as some circular vortices are quiet small and some rather large. If the fluid is turbulent in the mathematical sense, then the color contrast or the intensity of the colors and their change in space varies according to an equation valid for almost all motions at almost all scales. It is this scaling law of turbulent motions that three Mexican physicists tested with regard to Van Gogh’s paintings. They “pretended” that the painting represents the image of a flow that follows the physics of turbulent motions. And their work finds that Van Gogh indeed painted intuitively in ways that mimics nature’s turbulent motions when the physical laws were not yet known.
There are two take-home messages for me: First, fine art and physics often converge in unexpected ways. Second, I now want to know, if nature’s painting of the Labrador Shelf Current follows the same rules. There is a crucial wrinkle in motions impacted by the earth rotations: While the turbulence of Van Gogh or Kolmogorov cascades energy from large to smaller scales, that is, the larger eddies break up into several smaller eddies, for planetary-scale motions influenced by the Coriolis force due to earth’s rotation, the energy moves in the opposite direction, that is, the large eddies get larger as the feed on the smaller eddies. There is always more to discover, alas, but that’s the fun of physics, art, and oceanography.
Aragón, J., Naumis, G., Bai, M., Torres, M., & Maini, P. (2008). Turbulent Luminance in Impassioned van Gogh Paintings Journal of Mathematical Imaging and Vision, 30 (3), 275-283 DOI: 10.1007/s10851-007-0055-0
Ball, P. (2006). Van Gogh painted perfect turbulence news@nature DOI: 10.1038/news060703-17
Wu, Y., Tang, C., & Hannah, C. (2012). The circulation of eastern Canadian seas Progress in Oceanography, 106, 28-48 DOI: 10.1016/j.pocean.2012.06.005

![Europe during the last ice age about 50,000 years before present when a massive ice sheet covered much of Scandinavia, Britain, and the Baltic. Note that North Germany and Denmark are ice-free in the west, but ice-covered in the east. [From WikiPedia]](https://icyseas.org/wp-content/uploads/2013/07/737px-weichsel-wc3bcrm-glaciation.png)
![An F-102 jet of the 332d Fighter-Interceptor Squadron at Thule AFB in 1960. [Credit: United States Air Force]](https://icyseas.org/wp-content/uploads/2013/06/332d_fighter-interceptor_squadron_-_f-102_-_thule_ab.jpg)

![Ice fields seen in Labrador Current April 6, 2008 from a plane. [Photo Credit: Daniel Schwen]](https://icyseas.org/wp-content/uploads/2013/05/labrador_current.jpg)


