
The Arctic Ocean is a puddle of water covered by ice that melts, moves, and freezes. Grand and majestic rivers of Siberia and America discharge into the puddle and make it fresher than Atlantic Ocean waters. The fate of the Arctic freshwater helps decide if Europe and the US become warmer or colder, experience more or less storms, droughts, or floods, and if global sea level will rise or fall. In a nutshell: the fate of Arctic freshwater determines climate.
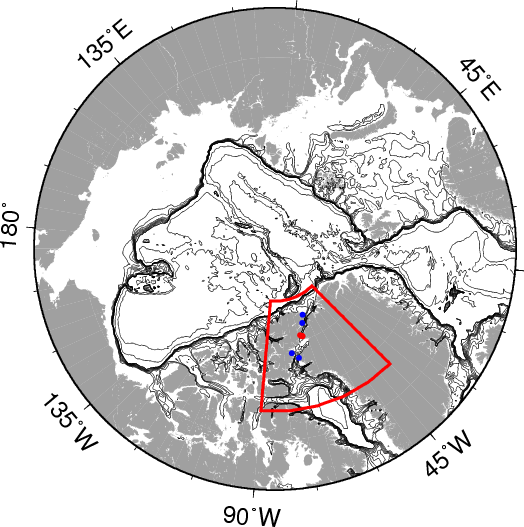
Arctic Ocean with Nares Strait study area (red box) with tide gauge locations as blue symbols and section of moored array as red symbol. Contours are bottom topography that emphasize ocean basins and continental shelf areas.
Nares Strait connects the Arctic and Atlantic Oceans to the west of Greenland. It is narrower than Fram Strait, but it transports as much fresh ocean water as does its wider sister facing Europe. Few people know this, including climate scientists who often model it with a bathymetry that is 10,000 years out of date from a time when Nares Strait did not yet exist. This is why the US National Science Foundation funded a group of oceanographers to use icebreakers, sensors, computers, and innovative engineering to collect and analyze data on the ice, the water, and the atmosphere.

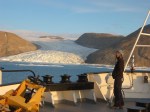
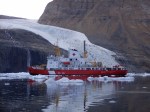
Acoustic Doppler Current Profiler mooring deployment in Nares Strait from aboard the CCGS Henry Larsen in 2009.
Within days of the start of the grant I had to appear before the US Congress to answer questions on Petermann Glacier that discharges into Nares Strait. In 2010 a large 4-times Manhattan-sized ice islands broke off and people wanted to know if global warming was to blame. I was asked how ocean temperatures and currents relate to this and other events and what may happen next. My few data points were the only existing data for this remote region, but I had not yet had the time to analyze and publish much. Two years later another large 2-Manhattan sized ice island formed from the same glacier, but this time we were better prepared and people world-wide went directly to our data, thoughts, and stories when this blog was sourced in news papers in France, Germany, and China. Al Jezeraa, BBC, and PBS reported on it, too, giving me chance to connect via TV, radio, and pod-casting to a larger public.
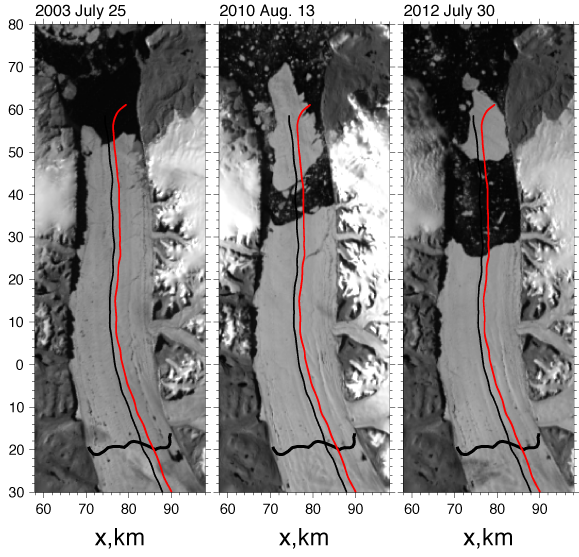
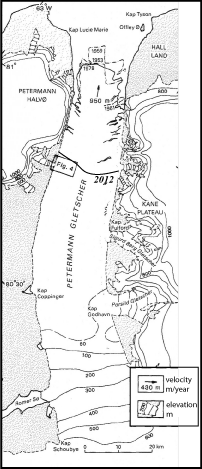
Petermann Gletscher in 2003, 2010, and 2012 from MODIS Terra in rotated co-ordinate system with repeat NASA aircraft overflight tracks flown in 2002, 2003, 2007, and 2010. Thick black line across the glacier near y = -20 km is the grounding line location from Rignot and Steffen (2008).
While it was exciting and fun to share Nares Strait and Petermann Gletscher physics with a global audience, it is not what we had planned to do. Our goal was to put real numbers to how much water, ice, and freshwater was moving from the Arctic to the Atlantic via Nares Strait. So the next 3 years we labored through our extensive records to first describe and then to understand what was happening in Nares Strait. We found that ocean currents move water always to the south no matter if ice covers Nares Strait or not, no matter if the ice is moving or not, no matter which way the wind is blowing. The physical cause for this southward flow is that the sea level is always a few inches higher in the Arctic Ocean than it is in Baffin Bay and the Atlantic Ocean to the south.
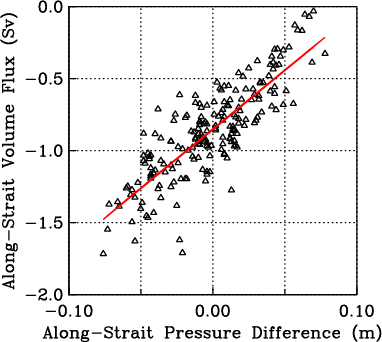
Linear regression of volume flux through Nares Strait from current meters with along-strait sea level difference from tide gauges. (unpublished).
We know, because we measured this with tide gauges that we placed in protected coastal bays. We recovered 3 sensors; most rewarding was the recovery of one sensor that we had failed to reach in 2005, 2006, 2007, and 2009, but in 2012 we finally got the instrument and 9-years of very good data. Batteries and computers inside were still running and recording. I have never seen as clean and as long a time series.

Results from a 2003-12 tide record shown as a power spectra with named tidal constituents at diurnal (~24 hours) and semi-diurnal (~12 hours) periods. Data are shown as the relative amplitudes of oscillations at frequencies in cycles per day or cpd. The red line is a modeled red noise spectra (unpublished).
From satellite data that we analyzed as part of this grant, we know when the ice moves and when it stops moving. The freeze-up of Nares Strait comes in one of three forms: 1. Ice stops moving in winter, because an ice barrier (ice arch or ice bridge) forms in the south that blocks all southward motion of ice; 2. only new and young ice moves southward, because an ice barrier forms in the north that blocks all entry of Arctic ice into Nares Strait; and 3. Arctic ice moves freely through Nares Strait, because no ice barriers are present. Our 2003-12 study period covers years for each of these different ice regimes. And each of these regimes leads to very different ocean (and ice) flux as a result of very different ocean physics.
Data alone cannot make definite statements on what will happen next with our climate, but we know much new physics. The physics suggest certain balances of forces and energy for which we have mathematical equations, but these equations must be solved on computers that can only approximate the true physics and mathematics. These computer models are our only way to make predictions ito the future. The data we here collected and our analyses provide useful checks on existing models and will guide improved models.
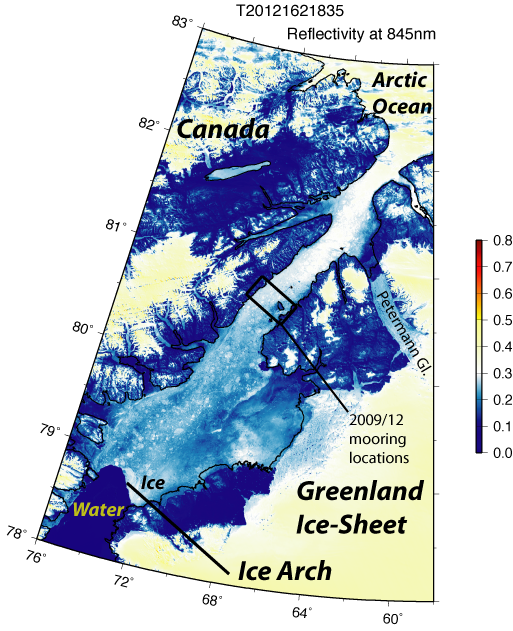
June-10, 2012 MODIS-Terra image showing location of moored array that was deployed in Aug. 2009.
Johnson, H., Münchow, A., Falkner, K., & Melling, H. (2011). Ocean circulation and properties in Petermann Fjord, Greenland Journal of Geophysical Research, 116 (C1) DOI: 10.1029/2010JC006519
Münchow, A., Falkner, K., Melling, H., Rabe, B., & Johnson, H. (2011). Ocean Warming of Nares Strait Bottom Waters off Northwest Greenland, 2003–2009 Oceanography, 24 (3), 114-123 DOI: 10.5670/oceanog.2011.62
Münchow, A., Padman, L., & Fricker, H. (2014). Interannual changes of the floating ice shelf of Petermann Gletscher, North Greenland, from 2000 to 2012 Journal of Glaciology, 60 (221), 489-499 DOI: 10.3189/2014JoG13J135
Münchow, A., Falkner, K., & Melling, H. (2014). Baffin Island and West Greenland Current Systems in northern Baffin Bay Progress in Oceanography DOI: 10.1016/j.pocean.2014.04.001
Rabe, B., Johnson, H., Münchow, A., & Melling, H. (2012). Geostrophic ocean currents and freshwater fluxes across the Canadian polar shelf via Nares Strait Journal of Marine Research, 70 (4), 603-640 DOI: 10.1357/002224012805262725
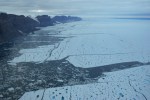
![North-eastern section of Petermann Glacier on Aug.-11, 2012, the meandering river is the centerline, view is almost due east. [Photo Credit: Canadian Coast Guard Ship Henry Larsen.]](https://icyseas.org/wp-content/uploads/2012/08/petermannglacier_cghl-360_20.jpg)
![Seaward front of Petermann Glacier Aug.-11, 2012. View is from a small side-glacier towards the south-east across Petermann Fjord with Petermann Gletscher to the left (east). [Photo Credit: Erin Clarke, Canadian Coast Guard Ship Henry Larsen]](https://icyseas.org/wp-content/uploads/2012/11/p1080580.jpg)

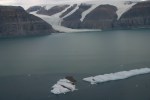
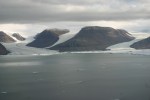

![Northern Kennedy Channel near the entrance to Petermann Fjord with Kap Morton in cloud banks. [Credit: Andreas Muenchow]](https://icyseas.org/wp-content/uploads/2013/05/img_0032.jpg)


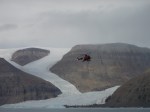
![The merging of Sigurd Berg and Hubert Glaciers which discharge into Petermann Gletscher on its eastern wall. The view is landward towards the north-east as the helicopter flies in from Petermann. [Credit: Barbara O'Connell, Canadian Coast Guard]](https://icyseas.org/wp-content/uploads/2013/05/img_4690.jpg)
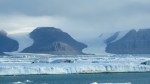
![Petermann Gletscher and Fjord in Aug.-2012. View is to the north-west with Faith Glacier (top left) and Kap Lucie Marie (top right) showing the western wall of Petermann. [Photo Credit: CCGS Henry Larsen]](https://icyseas.org/wp-content/uploads/2013/05/peterman-040.jpg)
![Looking down Belgrave Glacier discharging into Petermann Gletscher at its terminus in Aug. 2012 [Credit: CCGS Henry Larsen]](https://icyseas.org/wp-content/uploads/2013/05/peterman-050.jpg)

