
Greenland’s tidewater glaciers are losing mass, through thinning and retreat, at an increasing rate. Greenland’s glaciers located north of 78 North latitude often end in ice shelves, floating extensions of the glaciers extending up to several tens of km into the adjacent fjords. While most ice shelves of North Greenland have been relatively stable, Petermann Gletscher lost more than 40% of its ice shelf area (36 giga tons) during two major calving events in 2010 and 2012. What remains of Greenland’s ice shelves is threatened by a changing climate, because both regional air and ocean temperatures continue to increase while Arctic sea ice cover continues to decline.
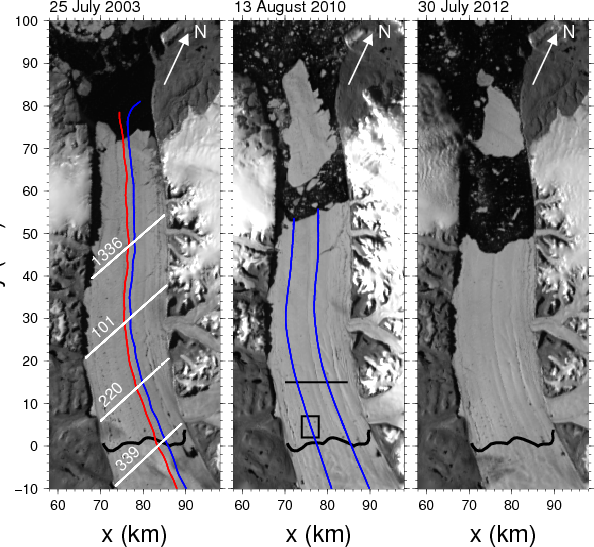
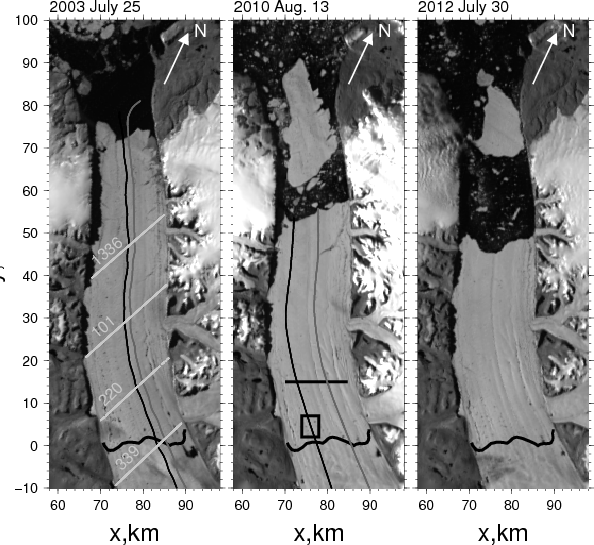
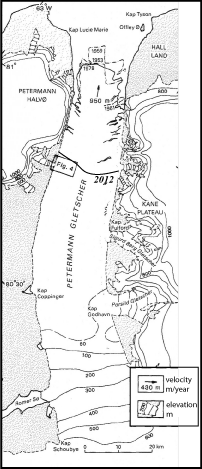
Petermann Gletscher through calving events. White lines show ICESat tracks; blue (ambient ice shelf) and red (central channel) show repeat-track airborne surveys.
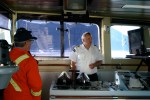
Using lasers and ice sounding radars aboard NASA planes (Operation IceBridge) as well as lasers on a now defunct satellite (ICESat), oceanographer Laurie Padman, glaciologist Helen A. Fricker, and I just passed peer-review with a study that estimates how much Petermann Gletscher has shrunk and melted over the last decade or so. The quick answer is about 5 meters per year:
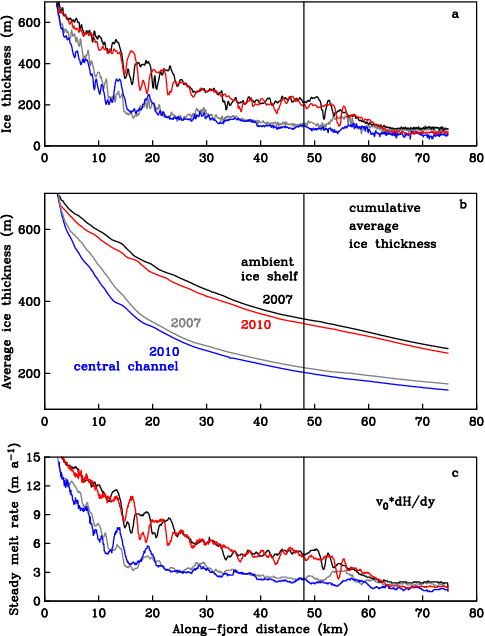
(top) Change in ice thickness from 2007 to 2010 from repeat airborne missions. (middle) along-track mean thickness. (bottom) steady-state melt.
In our study we distinguished between 1. a thinning of the floating ice shelf that moves along the glacier as new ice moves from the Greenland ice sheet on land out into the ocean and 2. a non-steady thinning at fixed locations as time passes. The situation is somewhat similar to the flow through a pipe (or river, if you wish) with a constriction. If the same amount of water entering the pipe comes out at the other end, then the flow has to speed up where the pipe becomes narrow. A floating glacier is not quite like water flowing through a pipe, because the ocean underneath and the air above can melt ice making the floating ice shelf thinner as it flows along. If the ice thickness changes along the floating glacier, then melting must take place for a glacier moving seaward at a constant rate. The ice thickness changes along the glacier, but stays constant at a fixed location. This is the steady-state melt.
The non-steady state thinning is the change in ice thickness at a fixed point observed at different times. We estimated this from observations taken along exactly the same tracks that the NASA aircraft flew in 2007 and 2010 before the break-up of Petermann Gletscher. Prior studies could not measure this, because the tracks were not the same or because the signal processing was not up to the task. We find that both the steady and the non-steady contribution is about 5 m per year each. These rates do not vary much between a thin central channel or a thick ambient ice shelf. This came as a little bit of a surprise, because the central channel is often also refered to as a “melt channel,” but it actually melts no different from any other section of the ice shelf. So, the question remains as to what causes the central and many other channels to be there in the first place. The place to look, I feel, is the area where the bed rock, the glacier ice, and the Arctic Ocean meet in what is called the grounding zone. It is here that the gigantic forces of water and ice pulverize rock while a mixture of rock and pressurized water is sand-blasting the ice. Talking about a rock and a hard place …
Our study will appear later this year in the Journal of Glaciology, but pre-prints can be downloaded here. The U.S. tax-paying public funded this study via grants that we received from NASA and NSF. They also funded substantial efforts to make sure, that all data reside in the public domain accessible to anyone anywhere.
-
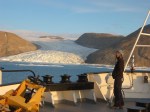
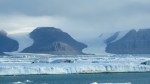
- North-eastern wall of Petermann Fjord in Aug.-2009. [Photo credit: David Riedel, CCGS Henry Larsen]
-

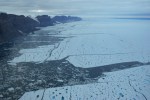
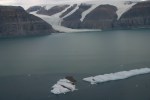
- North-eastern portion of Petermann Glacier on Aug.-11, 2012, the meandering river is the centerline, view is almost due east. [Photo Credit: Canadian Coast Guard Ship Henry Larsen.]
-

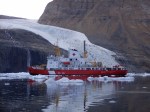
- Petermann Ice Island 2012 (PII-2012) as seen Aug.-11, 2012 at the entrance of Petermann Fjord. The view is to the north-west. [Photo Credit: Canadian Coast Guard Ship Henry Larsen.]
Münchow, A., Padman, L., and Fricker, H.A. (2014). Interannual changes of the floating ice shelf of Petermann Gletscher, North Greenland from 2000 to 2012, Journal of Glaciology, in press
Johnson, H., Münchow, A., Falkner, K., & Melling, H. (2011). Ocean circulation and properties in Petermann Fjord, Greenland Journal of Geophysical Research, 116 (C1) DOI: 10.1029/2010JC006519
Rignot, E., & Steffen, K. (2008). Channelized bottom melting and stability of floating ice shelves Geophysical Research Letters, 35 (2) DOI: 10.1029/2007GL031765
![North-eastern section of Petermann Glacier on Aug.-11, 2012, the meandering river is the centerline, view is almost due east. [Photo Credit: Canadian Coast Guard Ship Henry Larsen.]](https://icyseas.org/wp-content/uploads/2012/08/petermannglacier_cghl-360_20.jpg)
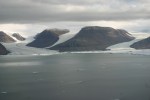
![Seaward front of Petermann Glacier Aug.-11, 2012. View is from a small side-glacier towards the south-east across Petermann Fjord with Petermann Gletscher to the left (east). [Photo Credit: Erin Clarke, Canadian Coast Guard Ship Henry Larsen]](https://icyseas.org/wp-content/uploads/2012/11/p1080580.jpg)


![Northern Kennedy Channel near the entrance to Petermann Fjord with Kap Morton in cloud banks. [Credit: Andreas Muenchow]](https://icyseas.org/wp-content/uploads/2013/05/img_0032.jpg)


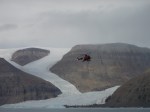
![The merging of Sigurd Berg and Hubert Glaciers which discharge into Petermann Gletscher on its eastern wall. The view is landward towards the north-east as the helicopter flies in from Petermann. [Credit: Barbara O'Connell, Canadian Coast Guard]](https://icyseas.org/wp-content/uploads/2013/05/img_4690.jpg)
![Petermann Gletscher and Fjord in Aug.-2012. View is to the north-west with Faith Glacier (top left) and Kap Lucie Marie (top right) showing the western wall of Petermann. [Photo Credit: CCGS Henry Larsen]](https://icyseas.org/wp-content/uploads/2013/05/peterman-040.jpg)
![Looking down Belgrave Glacier discharging into Petermann Gletscher at its terminus in Aug. 2012 [Credit: CCGS Henry Larsen]](https://icyseas.org/wp-content/uploads/2013/05/peterman-050.jpg)

