Category Archives: Ice Arch

Oceanography of Nares Strait Ice Flushing

I need the ice out of Nares Strait, a 20 mile wide and 300 miles long pathway to the North Pole between northern Canada and Greenland. The ice blocks our way to Petermann Fjord where a large glacier pushes thick ice out so sea as a floating ice shelf. We plan to drill through the floating section of the glacier that is about as thick as the Empire State Building is high. The ship to get us there is the Swedish icebreaker Oden (Location Map). She is passing the Faroe Islands to the north-west of Scotland and will arrive in 2 weeks at Thule Air Force Base where we will meet her.

Image of northern Greenland (top right) and Ellesmere Island (center) showing open water as black, land as gray, and sea ice as gray/white. The two red dots are Thule Air Force Base in the south and Petermann Glacier in the north. Note the bands of black water along the coast of Ellesmere Island that result from east to west blowing winds that move ice offshore.

Image of northern Greenland (top right) and Ellesmere Island (center) showing open water as black, land as gray, and sea ice as gray/white. The two red dots are Thule Air Force Base in the south and Petermann Glacier in the north. Note the bands of black water along the coast of Ellesmere Island that result from east to west blowing winds that move ice offshore and reduce the southward flow in Nares Strait.

The voyage from Thule to Petermann usually takes about 2-3 days, but if the sea ice does not flush out with the generally southward currents, then it may take a week or two wrecking havoc to our busy science schedule. So, why is the ice still lingering in Nares Strait this year?

Nares Strait ice cover in July of 2015 (left), 2014 (center), and 2013 (right) from MODIS Terra.

Nares Strait ice cover in July of 2015 (left), 2014 (center), and 2013 (right) from MODIS Terra.

There are three parts to the answer: First, a sturdy ice arch at the southern entrance of Nares Strait has to break. It has done so only last week. Second, a strong and perhaps oscillating flow has to thoroughly collapse the large pieces of ice at a narrow choke point that is Smith Sound. This has not happened yet. And third, a persistent flow to the south has to flush out ice into Baffin Bay to the south faster than it enters from the Arctic Ocean in the north. This flow is much weaker at the moment than is normal, because winds in the Arctic Ocean have been from east to west right now. These winds moved water (and ice) offshore to the north, so sealevel along northern Greenland and Canada drops. We can see this in today’s satellite imagery as prominent black bands of open water along the coast of northern Canada.

Lets take a closer look of this same image and zoom in on the southern part of Nares Strait as it looked this morning.

Collapsing ice arch at the southern entrance to Nares Strait on 13 July 2015 from MODIS AQUA.

Collapsing ice arch at the southern entrance to Nares Strait on 13 July 2015 from MODIS AQUA.

What used to be a solid frozen mass of ice along the Greenland coast (bottom right) has become a broken and loose mass of smaller ice floes. The larger blocks farther from the coast are now sliding southward as the loose ice along the coast reduces friction or lubricates the edges. The sides lose their grip on the ice and the entire construction fails and collapses. A most beautiful video on the stability of arches is posted by Open University here about lines of action or thrust.

All we now need for the ice to flush out of Nares Strait is a weakening or reversal of the winds at the other northern entrances to Nares Strait. Much of the generally southward flow is caused by the ocean’s surface being higher in the north than it is in the south. There are details that I am skipping, but basically much of the flow rolls downhill like a ball. And with the winds up north being from east to west, there is not much of a hill that the water can flow down, so we got somewhat stagnant waters. I have actually measured the height of this “hill of water” many times over the many years with ocean sensors that measure how much water is above them. This figure summarizes 3 years of data collected every 3 hours or so

Graph showing how water flow (called “volume flux”) varies with the steepness of the hill (called “pressure gradient”). The “hill” is at most 10 centimeters or 3 inches) high. [Adapted from Muenchow, 2015]

Now there is more to the “hill” story that is modified near the surface by the earth’s rotation in a fluid that has different densities at different depths. In a nutshell, the surface flow is 2-3 times as strong as the depth averaged flow. Furthermore, the surface flow on the Canadian side of Nares Strait is often twice as strong as that closer to Greenland, but all these spatial variations in flow actually help to smash large pieces of ice by moving and rotating them different sides of the same large piece of ice differently.

So, lets all hope that we get a few days of strong winds from the north flowing south, that should clear Nares Strait quickly before Oden arrives there in 2 weeks time. Those winds from the north not only flush out ice from Nares Strait, they also keep it nicely on one, the Canadian side. Earth rotation does wonderful and magical things to fluids such as water and air.

Muenchow, A, 2015: Volume and freshwater flux observations from Nares Strait to the west of Greenland at daily time scales from 2003 to 2009. J. Phys. Oceanogr., re-submitted July 2015, .pdf

Sun Set in Nares Strait, Greenland

The sun bathed the southern reaches of Nares Strait in light again after four months of total darkness of the polar night. It is still cold, about -30 degrees centigrade, but the long shadows cast by mountains, hills, and even icebergs from Humbold Glacier are a feast for my eyes:

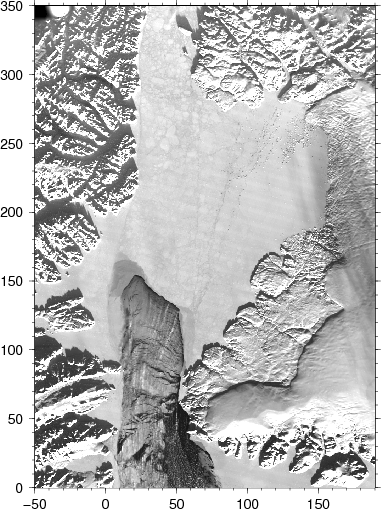
Kane Basin with Humbold Glacier, Greenland in the east, Ellesmere Island, Canada in the west as well as Smith Sound in the south, and Kennedy Channel of Nares Strait in the north. The visible image was taken Mar.-2, 2015 at 17:30 UTC by MODIS Terra.

Kane Basin with Humbold Glacier, Greenland in the east, Ellesmere Island, Canada in the west as well as Smith Sound in the south, and Kennedy Channel of Nares Strait in the north. The visible image was taken Mar.-2, 2015 at 17:30 UTC by MODIS Terra.

The sun dipped above the southern horizon just for a few hours. The light reflected by the ice and snow of North Greenland was captured by a satellite overhead. From these data I constructed the above image with the axes in km. The frame is big enough to fit both Denmark and Massachusetts into it. The image shows the southern entrance to Nares Strait with its prominent ice arch and the “North Water” polynya in the south. You can “see” individual ice floes in this image as well as rows of sea smoke over the thin ice of the polynya that are all resolved at the 250-m pixel size. Petermann is still dark and not shown, but give it a week, and we’ll get sun there also.

I will be watching this ice arch closely, because together with a group of 50 international scientists I am scheduled to sail these icy waters aboard the Swedish icebreaker Oden this summer for a multitude of experiments to take place in Petermann Fjord with data sampling of adjacent ice, ocean, and land. As a group we will try to reconstruct climate and its physical processes that impact change from tidal to glacial cycles.

A Short Summary of Nares Strait Physics

The Arctic Ocean is a puddle of water covered by ice that melts, moves, and freezes. Grand and majestic rivers of Siberia and America discharge into the puddle and make it fresher than Atlantic Ocean waters. The fate of the Arctic freshwater helps decide if Europe and the US become warmer or colder, experience more or less storms, droughts, or floods, and if global sea level will rise or fall. In a nutshell: the fate of Arctic freshwater determines climate.

Arctic Ocean with Nares Strait study area (red box) with tide gauge locations as blue symbols and section of moored array as red symbol. Contours are bottom topography that emphasize ocean basins and continental shelf areas.

Arctic Ocean with Nares Strait study area (red box) with tide gauge locations as blue symbols and section of moored array as red symbol. Contours are bottom topography that emphasize ocean basins and continental shelf areas.

Nares Strait connects the Arctic and Atlantic Oceans to the west of Greenland. It is narrower than Fram Strait, but it transports as much fresh ocean water as does its wider sister facing Europe. Few people know this, including climate scientists who often model it with a bathymetry that is 10,000 years out of date from a time when Nares Strait did not yet exist. This is why the US National Science Foundation funded a group of oceanographers to use icebreakers, sensors, computers, and innovative engineering to collect and analyze data on the ice, the water, and the atmosphere.

Acoustic Doppler Current Profiler mooring deployment in Nares Strait from aboard the CCGS Henry Larsen in 2009.

Acoustic Doppler Current Profiler mooring deployment in Nares Strait from aboard the CCGS Henry Larsen in 2009.

Within days of the start of the grant I had to appear before the US Congress to answer questions on Petermann Glacier that discharges into Nares Strait. In 2010 a large 4-times Manhattan-sized ice islands broke off and people wanted to know if global warming was to blame. I was asked how ocean temperatures and currents relate to this and other events and what may happen next. My few data points were the only existing data for this remote region, but I had not yet had the time to analyze and publish much. Two years later another large 2-Manhattan sized ice island formed from the same glacier, but this time we were better prepared and people world-wide went directly to our data, thoughts, and stories when this blog was sourced in news papers in France, Germany, and China. Al Jezeraa, BBC, and PBS reported on it, too, giving me chance to connect via TV, radio, and pod-casting to a larger public.

Petermann Gletscher in 2003, 2010, and 2012 from MODIS Terra in rotated co-ordinate system with repeat NASA aircraft overflight tracks flown in 2002, 2003, 2007, and 2010. Thick black line across the glacier near y = -20 km is the grounding line location from Rignot and Steffen (2008).

Petermann Gletscher in 2003, 2010, and 2012 from MODIS Terra in rotated co-ordinate system with repeat NASA aircraft overflight tracks flown in 2002, 2003, 2007, and 2010. Thick black line across the glacier near y = -20 km is the grounding line location from Rignot and Steffen (2008).

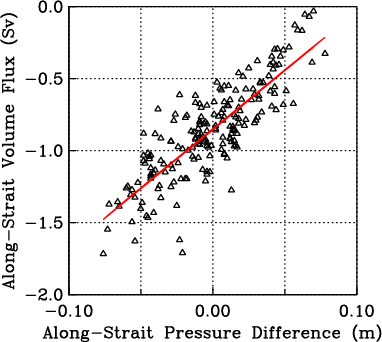
While it was exciting and fun to share Nares Strait and Petermann Gletscher physics with a global audience, it is not what we had planned to do. Our goal was to put real numbers to how much water, ice, and freshwater was moving from the Arctic to the Atlantic via Nares Strait. So the next 3 years we labored through our extensive records to first describe and then to understand what was happening in Nares Strait. We found that ocean currents move water always to the south no matter if ice covers Nares Strait or not, no matter if the ice is moving or not, no matter which way the wind is blowing. The physical cause for this southward flow is that the sea level is always a few inches higher in the Arctic Ocean than it is in Baffin Bay and the Atlantic Ocean to the south.

Linear regression of volume flux  through Nares Strait from current meters with along-strait sea level difference from tide gauges (unpublished).

Linear regression of volume flux through Nares Strait from current meters with along-strait sea level difference from tide gauges. (unpublished).

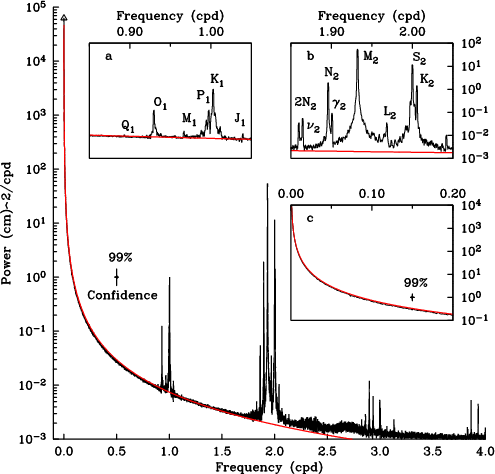
We know, because we measured this with tide gauges that we placed in protected coastal bays. We recovered 3 sensors; most rewarding was the recovery of one sensor that we had failed to reach in 2005, 2006, 2007, and 2009, but in 2012 we finally got the instrument and 9-years of very good data. Batteries and computers inside were still running and recording. I have never seen as clean and as long a time series.

Results from a 2003-12 tide record shows as power spectra with named tidal constituents at diurnal (~24 hours) and semi-diurnal (~12 hours) periods. The red line is a modeled red noise spectra (unpublished).

Results from a 2003-12 tide record shown as a power spectra with named tidal constituents at diurnal (~24 hours) and semi-diurnal (~12 hours) periods. Data are shown as the relative amplitudes of oscillations at frequencies in cycles per day or cpd. The red line is a modeled red noise spectra (unpublished).

From satellite data that we analyzed as part of this grant, we know when the ice moves and when it stops moving. The freeze-up of Nares Strait comes in one of three forms: 1. Ice stops moving in winter, because an ice barrier (ice arch or ice bridge) forms in the south that blocks all southward motion of ice; 2. only new and young ice moves southward, because an ice barrier forms in the north that blocks all entry of Arctic ice into Nares Strait; and 3. Arctic ice moves freely through Nares Strait, because no ice barriers are present. Our 2003-12 study period covers years for each of these different ice regimes. And each of these regimes leads to very different ocean (and ice) flux as a result of very different ocean physics.

Data alone cannot make definite statements on what will happen next with our climate, but we know much new physics. The physics suggest certain balances of forces and energy for which we have mathematical equations, but these equations must be solved on computers that can only approximate the true physics and mathematics. These computer models are our only way to make predictions ito the future. The data we here collected and our analyses provide useful checks on existing models and will guide improved models.

June-10, 2012 MODIS-Terra image showing location of moored array that was deployed in Aug. 2009 to be recovered in Aug. 2012.

June-10, 2012 MODIS-Terra image showing location of moored array that was deployed in Aug. 2009.

Johnson, H., Münchow, A., Falkner, K., & Melling, H. (2011). Ocean circulation and properties in Petermann Fjord, Greenland Journal of Geophysical Research, 116 (C1) DOI: 10.1029/2010JC006519

Münchow, A., Falkner, K., Melling, H., Rabe, B., & Johnson, H. (2011). Ocean Warming of Nares Strait Bottom Waters off Northwest Greenland, 2003–2009 Oceanography, 24 (3), 114-123 DOI: 10.5670/oceanog.2011.62

Münchow, A., Padman, L., & Fricker, H. (2014). Interannual changes of the floating ice shelf of Petermann Gletscher, North Greenland, from 2000 to 2012 Journal of Glaciology, 60 (221), 489-499 DOI: 10.3189/2014JoG13J135

Münchow, A., Falkner, K., & Melling, H. (2014). Baffin Island and West Greenland Current Systems in northern Baffin Bay Progress in Oceanography DOI: 10.1016/j.pocean.2014.04.001

Rabe, B., Johnson, H., Münchow, A., & Melling, H. (2012). Geostrophic ocean currents and freshwater fluxes across the Canadian polar shelf via Nares Strait Journal of Marine Research, 70 (4), 603-640 DOI: 10.1357/002224012805262725

Formation of Nares Strait Ice Bridges in 2014

Darkness and cold covers North Greenland, Ellesmere Island as well as Nares Strait, the waterway that connects these two inhospitable places. And despite the darkness of the polar night, I can see that three beautiful arches made of ice connect Greenland to Canada. It is possible to walk across water, if the water is frozen. Stuck to land, ice arches or ice bridges shut down ice motion while the ocean under the ice keeps moving. Lets have a peek at how this looked from space yesterday:

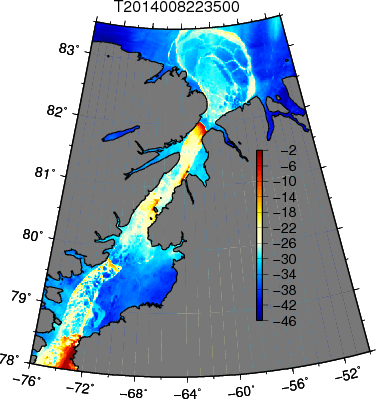
Ice arches of Nares Strait on January 26, 2014 from MODIS thermal imagery.

Ice arches of Nares Strait on January 26, 2014 from MODIS thermal imagery. Surface temperatures in degrees Celsius are all below zero despite the missing “-” sign stripped by Adobe Illustrator.

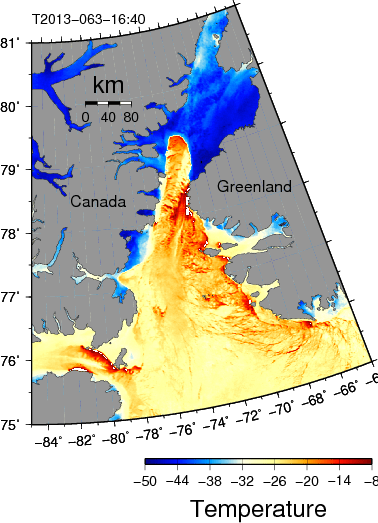
The colors above show the temperature that satellite sensors “see” at the surface of the ice. Red is warm, blue is cold, and grey is land, but “warm” here is still below the freezing point of sea water near -2 degrees Celsius, so even the red or “hot” spots are covered by ice. The 300 deep ocean in Nares Strait generally flows from north to south without trouble under the ice, but just behind the fixed arching ice bridges, it sweeps the newly formed thin ice away to the south. The “warm” spots that form to the south of each ice arches have their own stories:

Farthest to the north a massive ice arch spans almost 200 km (150 miles) across. It faces the open Arctic Ocean to the north and it formed a few days before Christmas 4-5 weeks ago. It was still shedding large ice floes from its edge as it tried, and finally succeeded, I think, to find a stable location. Nevertheless, one of its larger pieces of ice moved into Nares Strait on January-3, 2014 where it became stuck on both Greenland and Ellesmere Islands:

The large floe from the edge of the first ice arch becames firmly lodged on both sides of the 30-km wide entrance to Nares Strait on January-4 (not shown), perhaps aided by strong winds from the north with wind speeds exceeding 40 knots (20 m/s). This second northern arch then aided the formation of the third ice arch in the south. All three arches became first visible on January-8:

Jan.-8, 2014

Jan.-8, 2014

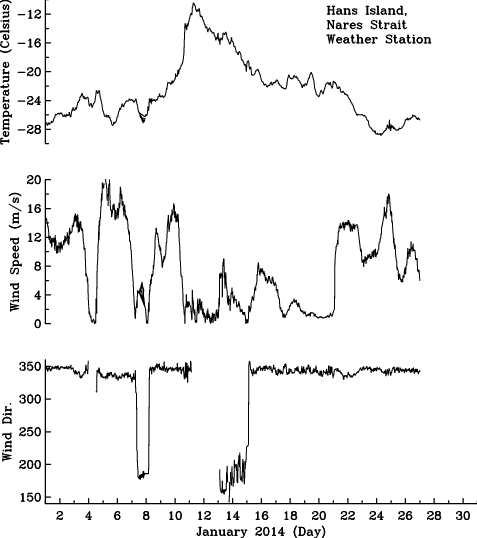
A subsequent lull and short reversal of the winds brought warm southern air masses into Nares Strait while water and drainage pipes froze at my home in Delaware:

Weather record from Hans Island at the center of Nares Strait for January 2014. [Data from Scottish Marine Institute in Oban, Scotland.

Weather record from Hans Island at the center of Nares Strait for January 2014. [Data from Scottish Marine Institute in Oban, Scotland.

“Warm” here refers to -10 degrees Centigrade (+14 Fahrenheit). Air temperatures in Nares Strait today are -21 degrees Celsius (-5 Fahrenheit) while ocean temperatures under sea ice are near -1.8 degrees Celsius (+29 Fahrenheit). It is these “hot” waters that “shine” through the thinner ice as the satellite senses the amount of heat that the ice surface radiates into space. More details on this one finds elsewhere.

I enjoy these elegantly arching ice bridges across Nares Strait, because they challenge me each year anew to question how sea ice, oceans, air, and land all interact to produce them. Nobody really knows. It is a hard problem to model mathematically and many graduate theses will be written on the subject. A student in our own program, Sigourney Stelma, just presented first results and movies of computer simulations of ice bridges forming. Perhaps I can convince her to post some of them on these pages?

Kozo, T.L. (1991). The hybrid polynya at the northern end of Nares Strait Geophys. Res. Let., 18 (11), 2059-2062 DOI: 10.1029/91GL02574

Kwok, R., Pedersen, L.T., Gudmandsen, P. and Peng, S.S. (2010). Large sea ice outflow into the Nares Strait in 2007 Geophys. Res. Let., 37 (L03502) DOI: 10.1029/2009GL041872

Muenchow, A. and H. Melling. (2008). Ocean current observations from Nares Strait to the west of Greenland: Interannual to tidal variability and forcing J. Mar. Res., 66 (6), 801-833 DOI: 10.1357/002224008788064612

Shades of White as the Sun Rises over Nares Strait

After four months of total darkness the sun is back up in Nares Strait. It transforms the polar night into thousand shades of white as mountains, glaciers, and ice take in and throw back the new light. Our satellites receive some of the throw-away light as the landscape reflects it back into space. During the long dark winter months these satellites could only “see” heat, but this will change rapidly as Alert atop of Arctic Canada receives 30 minutes more sun with each passing day.

Surface temperature in degrees centigrade over northern Baffin Bay on March-4, 2013 16:20 UTC from MODIS Terra.

Surface temperature in degrees centigrade over northern Baffin Bay on March-4, 2013 16:20 UTC from MODIS Terra. Warm colors (reds) show thin and/or ice while cold colors (blues) suggest thick ice stuck in place.

A very strong ice arch at the southern entrance to Nares Strait separates thick (and cold) ice to north from thin (and warm) ice to the south. The thick and cold ice is not moving, it is stuck to land, but the ocean under the ice is moving fast from north to south. The ocean currents thus sweep the newly formed thin ice away to the south. This ice arch formed way back in early November just after the sun set for winter over Nares Strait.

Now that the sun is up, we can also “see” more structures in the ice by the amount of light reflected back to space. A very white surface reflects lots while a darker surface reflects less. We are looking at the many shades of white here … even though I color them in reds and blues:

Surface reflectance at 865 nm in northern Baffin Bay on March-4, 2013 16:20 UTC from MODIS Terra.

Surface reflectance at 865 nm in northern Baffin Bay on March-4, 2013 16:20 UTC from MODIS Terra. A true color image (which this is not) would show only white everywhere. Hence I show the very bright white as red and the less bright white as blue. This artificial enhancement makes patterns and structures more visible to the eye.

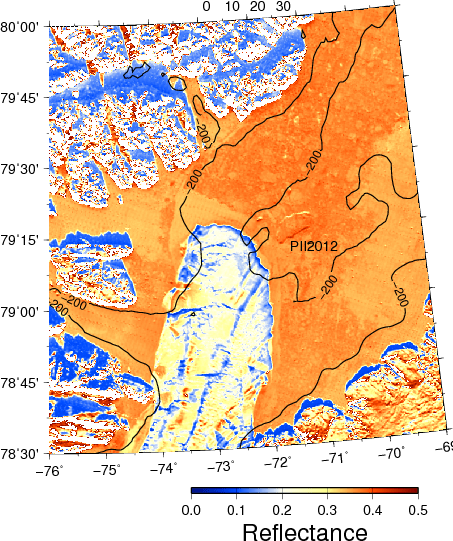
Zooming into the area where the ice arch separates thick ice to the north that is not moving from thin ice in the south that is swept away by ocean currents, I show this image at the highest possible resolution:

Surface reflectance at 865 nm at the southern entrance to Nares Strait on March-4, 2013. Contours are 200-m bottom depth showing PII2012 grounded at the north-eastern sector of the ice arch.

Surface reflectance at 865 nm at the southern entrance to Nares Strait on March-4, 2013. Contours are 200-m bottom depth showing PII2012 grounded at the north-eastern sector of the ice arch.

Note, however, that the sun is far to south and barely peeking over the horizon. This low sun angle shows up as shadows cast by mountains. And since the sun is still far to the south, the shadows cast are to the north. This “shadow” makes visible the ice island from Petermann Gletscher that anchors this ice arch as it is grounded. I labeled it PII2012 in the picture.

From laser measurements we know that the ice islands stands about 20 meter (or 60 feet) above the rest of the ice field. This height is enough to cast a visible shadow towards the north (slightly darker = less red) as well as a direct reflection off its vertical wall facing south (brighter = more red) towards the sun. At its thickest point, PII2012 is about 200 meters (~600 feet) thick. For this reason, I also show the 200-m bottom contour that moves largely from north to south along both Ellesmere Island, Canada on the left and Greenland on the right.

The sun brings great joy to all, especially those hardy souls who live in the far north. The sun’s rise also shows the delicate interplay of light and shadows that we can use to solve puzzles on how ice, oceans, and glaciers work. At the entrance of Nares Strait the playful delights of the sea ice, ocean currents, and ice islands gives us a large area of thin ice. The thin ice will soon melt and perhaps has already started to set into motion a spring bloom of ocean plants. Ocean critters will feed on these to start another cycle of life. Whales, seals, and polar bears all depend on it for 1000s of years now.

Sketch of the biological pieces that a large area of open water near a fixed ice edge like that of a polynya may support. [From Northern Journal>/a>]

Sketch of the biological pieces that a large area of open water near a fixed ice edge like that of a polynya may support. [From Northern Journal]