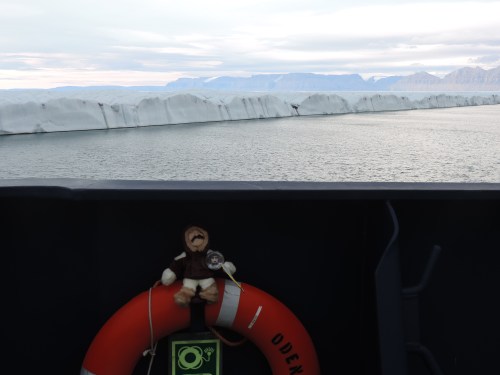
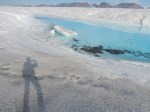
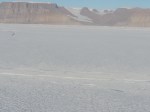
Fog, fog, and more fog is all we saw as we approached Scoresby Sund aboard the German research ship Maria S. Merian from Denmark Strait to the south-east. The fog lifted as soon as we passed Kap Brewster and began work on ocean currents and waters at the entrance of this massive fjord system. My artist friend and wife Dragonfly Leathrum posted a wonderful travel essay with many photos that did not include these:
![Marine layer at the entrance of Scoresby Sund on Aug.-20, 2018. Photo by Dragonfly Leathrum]](https://i0.wp.com/icyseas.org/wp-content/uploads/2019/07/img_2678.jpg?w=330&h=220&ssl=1 "IMG_2678")
![Fog at noon on Aug.-20, 2018 to the south of Scoresby Sund. [Photo by Dragonfly Leathrum]](https://i0.wp.com/icyseas.org/wp-content/uploads/2019/07/img_2642.jpg?w=162&h=108&ssl=1 "IMG_2642")
![Kap Brewster in the clouds (foreground) at the southern entrance to Scoresby Sund. View is to the north-west into the entrance of the fjord. In the background the northern shores are visible behind the iceberg. [Photo by Dragonfly Leathrum]](https://i0.wp.com/icyseas.org/wp-content/uploads/2019/07/img_2654.jpg?w=162&h=108&ssl=1 "IMG_2654")
![Evening sun on mountains on the Volquart Boons Kyst in Scoresby Sund on August 20, 2018. [Photo by Dragonfly Leathrum]](https://i0.wp.com/icyseas.org/wp-content/uploads/2019/07/img_2774.jpg?w=246&h=164&ssl=1 "IMG_2774")
![Kap Brewster at the southern entrance of Scoresby Sund on Aug.-20, 2018. View is to the south-east out to the open foggy sea. [Photo by Dragonfy Leathrum]](https://i0.wp.com/icyseas.org/wp-content/uploads/2019/07/img_2738.jpg?w=246&h=164&ssl=1 "IMG_2738")
We were here to explore how the coastal ocean off Greenland may relate to Daugaard-Jensen Gletscher at the head of the fjord some 360 km away (195 nautical miles or about a day of constant steaming at 8 knots). This tidewater glacier discharges as much icy mass out to sea as does Petermann Gletscher or 79N Glacier to the north or half as much as Helheim, Kangerdlugssuaq, and Jacobshavn Glaciers to the south. Unlike all those other glaciers, Daugaard-Jensen and its fjord are still largely unexplored.
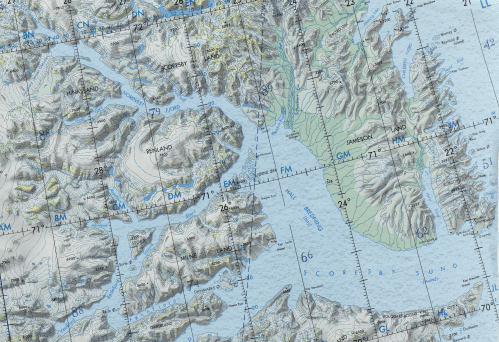
Location Map of Scoresby Sund. Kap Brewster is at bottom right while Daugaard-Jensen Gletscher 360 km away is near the top left.
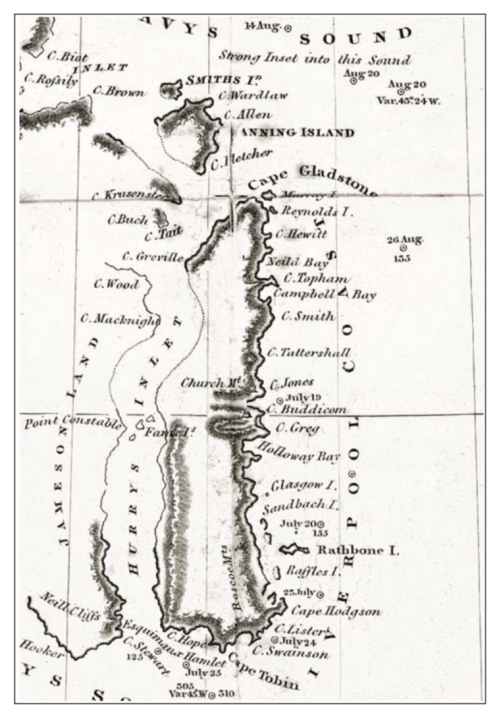
Part of the chart of the East Greenland coast drawn up by William Scoresby Jr. in 1822, showing the numerous features that he names in Liverpool land (Liverpool Coast) and adjacent areas. From: Scoresby (1823)
While the entrance between Kap Tobin and Kap Brewster was known to whalers in the early 19th century, it was William Scoresby Sr. after whom the fjord is named. His scientist son William Scoresby Jr. mapped coastal Greenland between 69.5 and 71.5 North latitude during his last voyage in 1822. Nobody entered the fjord until 1891 when Lt. Carl Ryder of the Danish Navy sailed deep into the fjord to explore the area for a year with 10 companions. They built a hut next to a natural port that they named Hekla Harbor. Amazingly, they also measured ocean temperature profiles almost every month from the surface to 400 m depth. I found these data at the National Ocean Data Center of the United States Government.

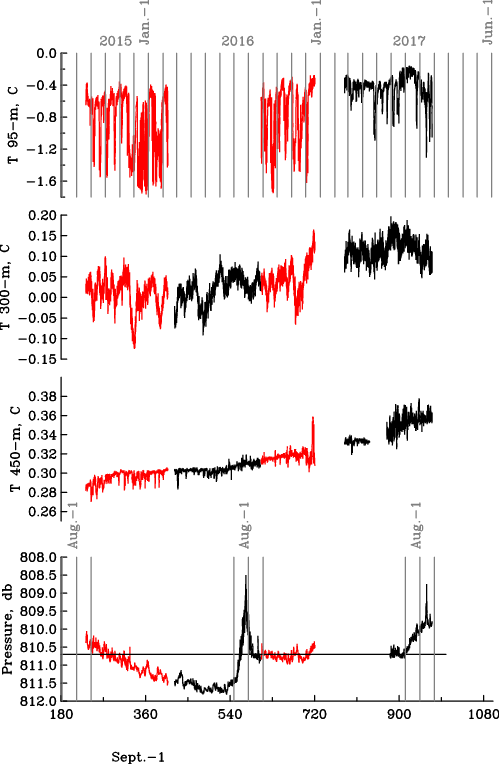
Ocean temperature (left panel) and salinity (right panel) as it varies with depth in different years. Blue represents measurements from 1891/92, red from 1990, and black from 2018.
Searching for data from Scoresby Sund, I found 17 profiles of water temperature with data from at least 10 depths. Funny that 12 of these profiles were collected in 1891 and 1892 while the other 5 profile contain salinity measurements made in 1933, 1984, 1985, 1988, and 2002. The 1988 cast was taken by an Icelandic vessel and also contained continous data from a modern electronic sensor rather than waters collected by bottles. I “found” another 4 modern sensor profiles collected in 1990 at the Alfred-Wegener Institute in Germany.
That’s pretty much “it” … until we entered the fjord in 2018 when we collected another 27 casts thus more than doubling the ocean profiles. More exciting, though, is the very large shift in ocean temperatures from 1990 to 2018. The 1990 temperatures are very similar to the 1891/92 temperatures, but all old temperatures (also from 1933 and 1985, not shown) are all about 1 degree Celsius (2 degrees Fahrenheit) cooler than those we measured in 2018. Why is this so? Does such warming originate from outside the fjord? If so, how does the warmer Atlantic water at depth in deep water crosses the 80 km wide shallow continental shelf to enter Scoresby Sund? Are any of these ideas supported by actual data? What data are there?
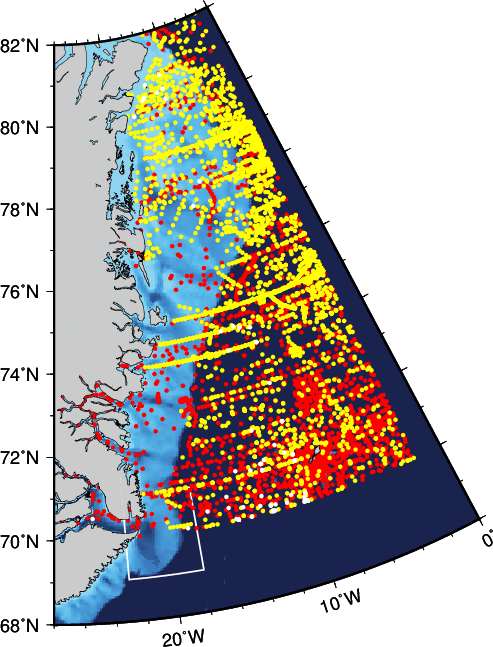
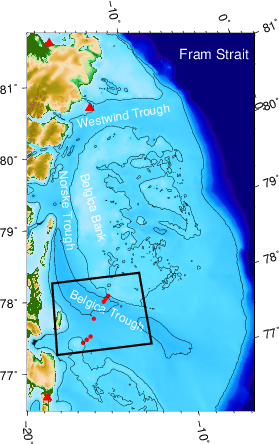
Ocean data location off eastern Greenland collected from 1890 to 2010 that reside in NODC archives. Red are water bottle data while yellow are modern electronic sensor measurements. The white box bottom left is the entrance to Scoresby Sund. Light blue areas are water less than 500 m deep while dark blue shades are deeper than 1000 m.
Discoveries in science can be pretty basic, if one is at the right location at the right time with the right idea. Also, there is more data to the south that I did not yet look at to investigate the question of what causes the warming of bottom waters in Scoresby Sund.
EDIT Dec.-31, 2019: Replace “warmer” with “cooler” when comparing 1891 and 1990 (cooler) to 2018 (warmer) water temperatures.