Author Archives: Andreas Muenchow

Petermann Ice Island(s) 2010 through 2011, Part-1

An ice island 4 times the size of Manhattan spawned from a remote floating glacier in north-western Greenland the first week in August of 2010, but it quickly broke into at least 3-4 very large pieces as soon as it flowed freely and encountered smaller, but real and rocky islands. A beacon placed on the ice transmit its location several times every day. It shows a rapid transit from the frigid, ice-infested Arctic waters off Canada’s Ellesmere, Devon, and Baffin Islands to the balmier coasts of Labrador and Newfoundland:
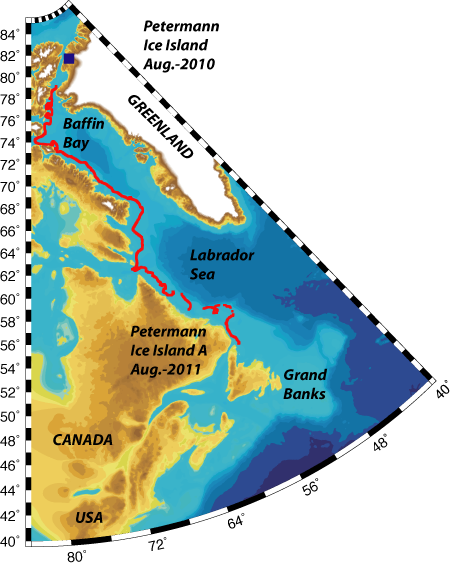
Track of Petermann Ice Island from Aug.-2010 through Aug.-2011 traveling in shallow water from northern Greenland along Baffin Island and Labrador to Newfoundland.

Initial progress was slow as it took the new ice island almost 30 days to wiggle itself free of the narrow constraints of Petermann Fjord:
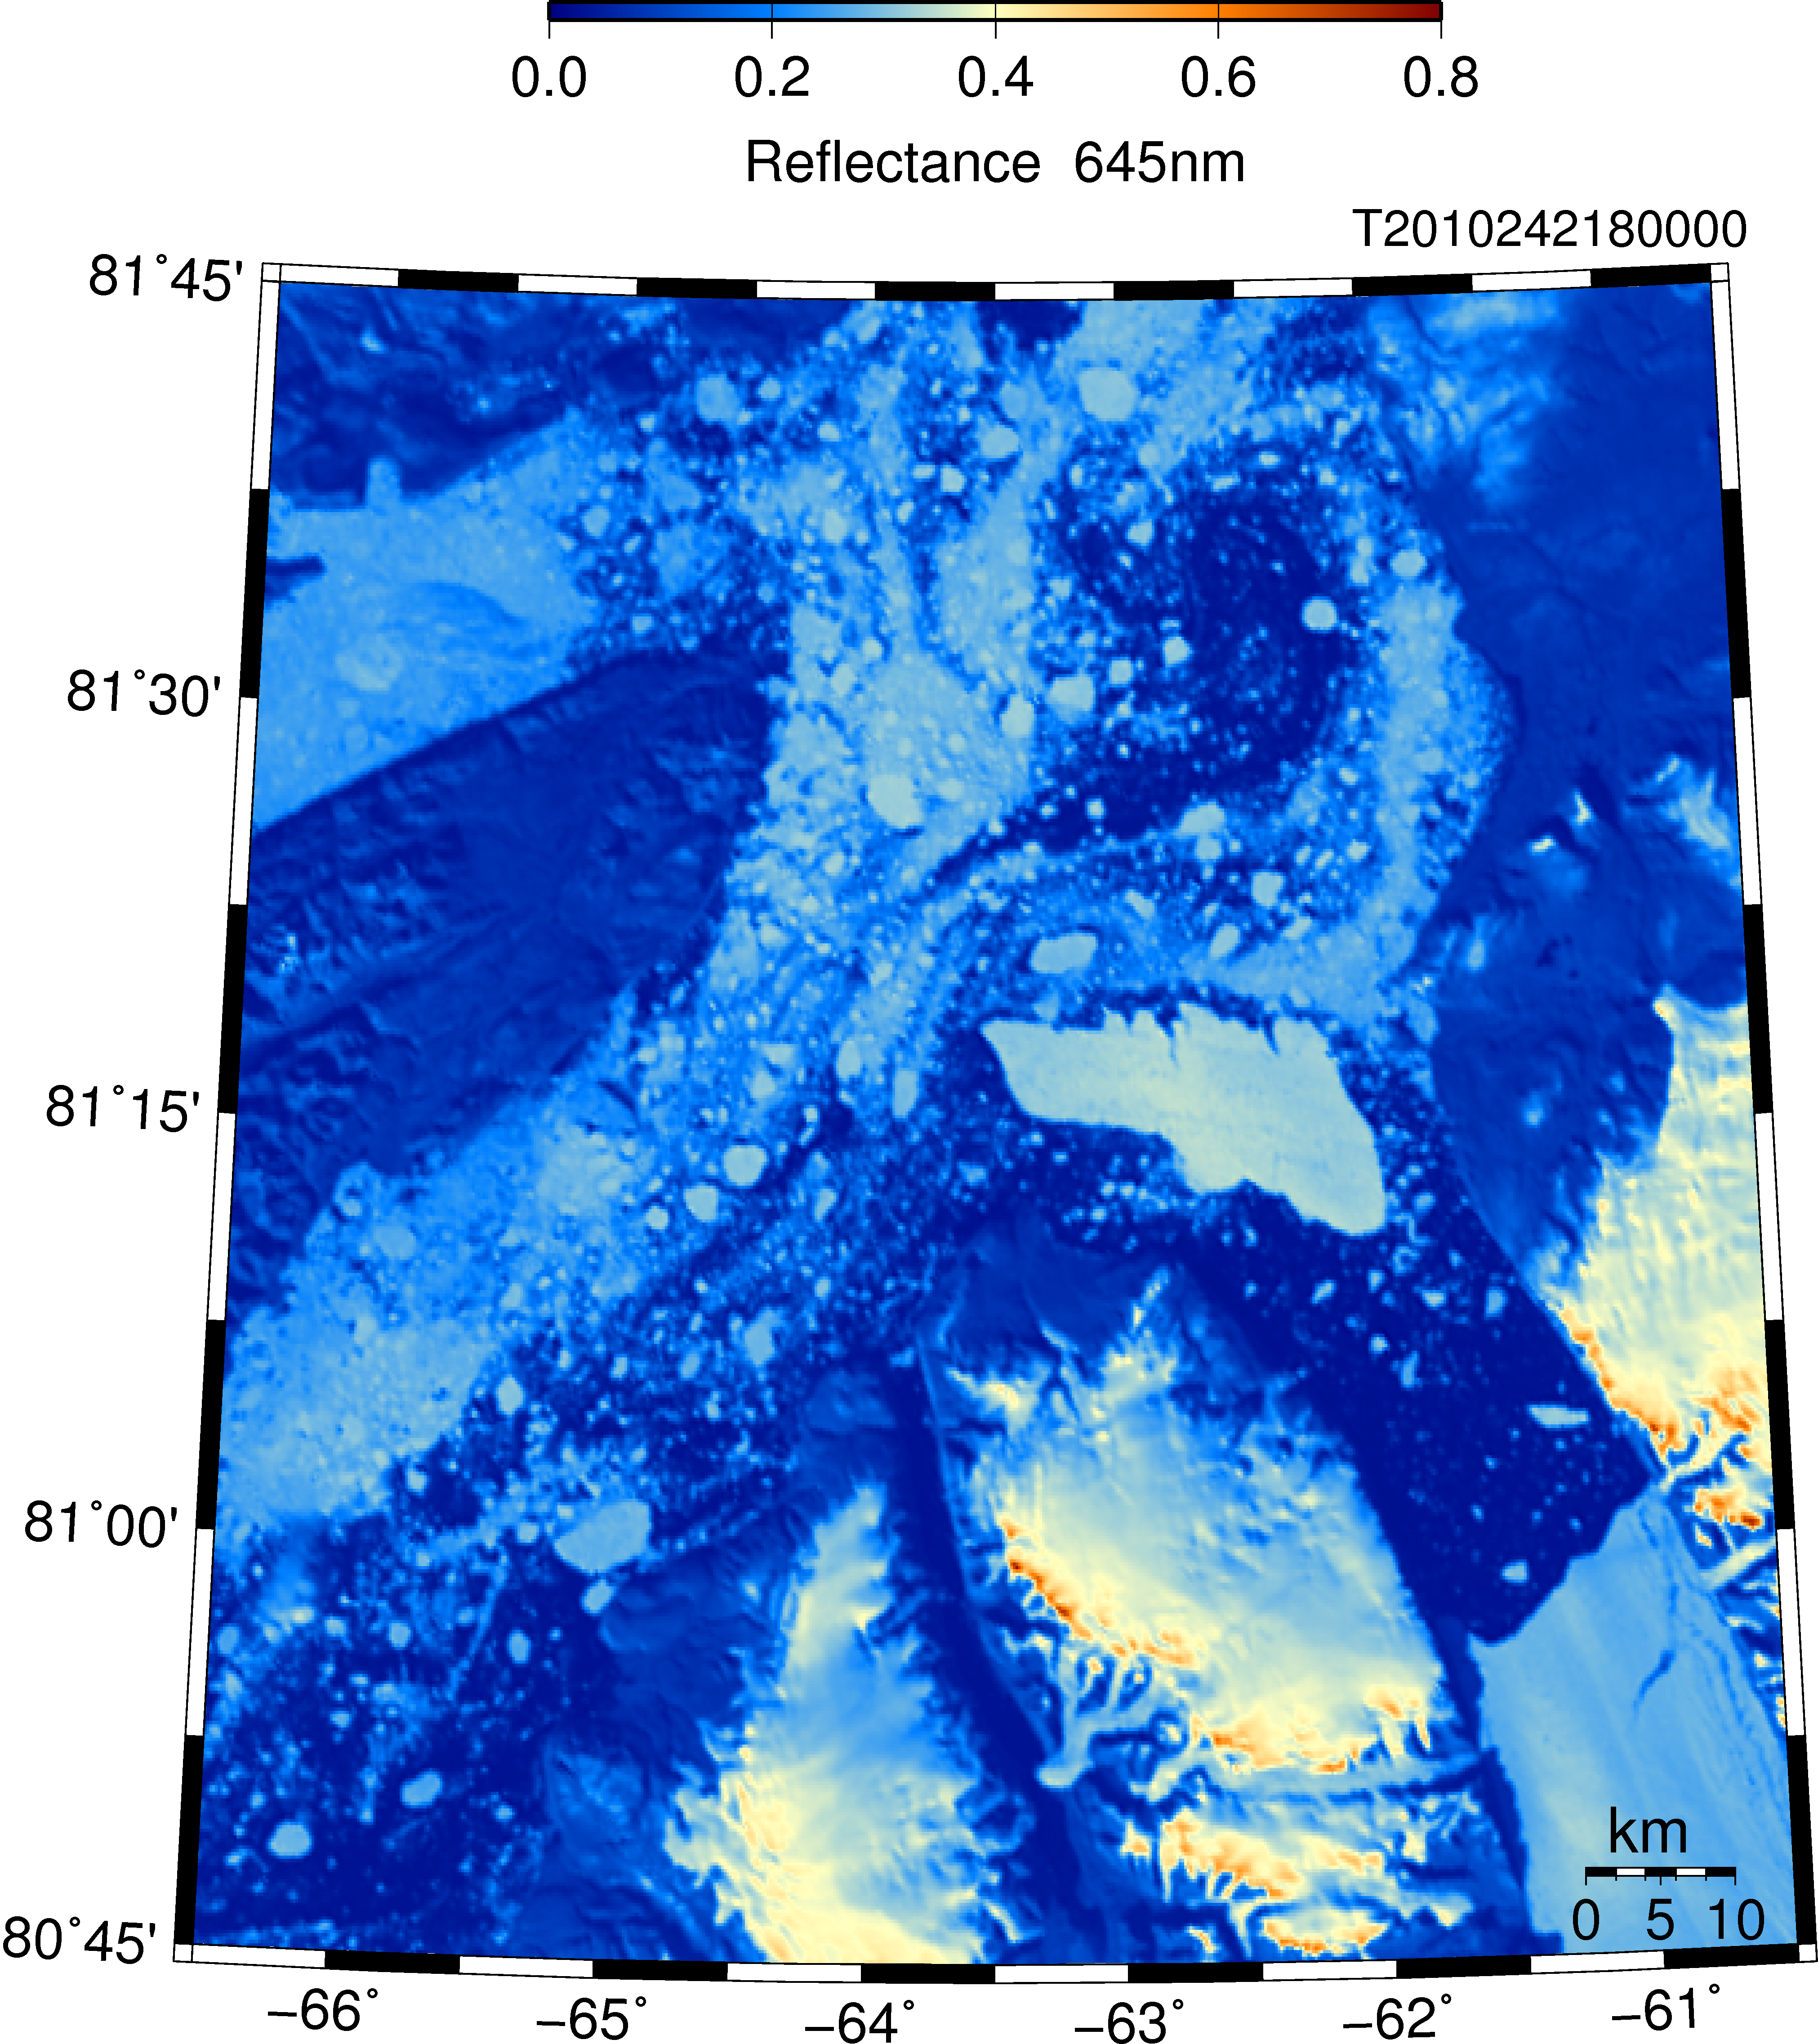
Petermann Glacier discharges its large ice island into Nares Strait on Aug.-30, 2010.

As soon as it left its home port, it hit broke hit tiny Joe Island on Sept.-9, 2010 and broke into two pieces, PII-A and PII-B for Petermann Ice Island A and B. Not a good start for a new island setting out to sail all the way to Newfoundland where PII-A arrived a year later, but I am getting ahead of my story.
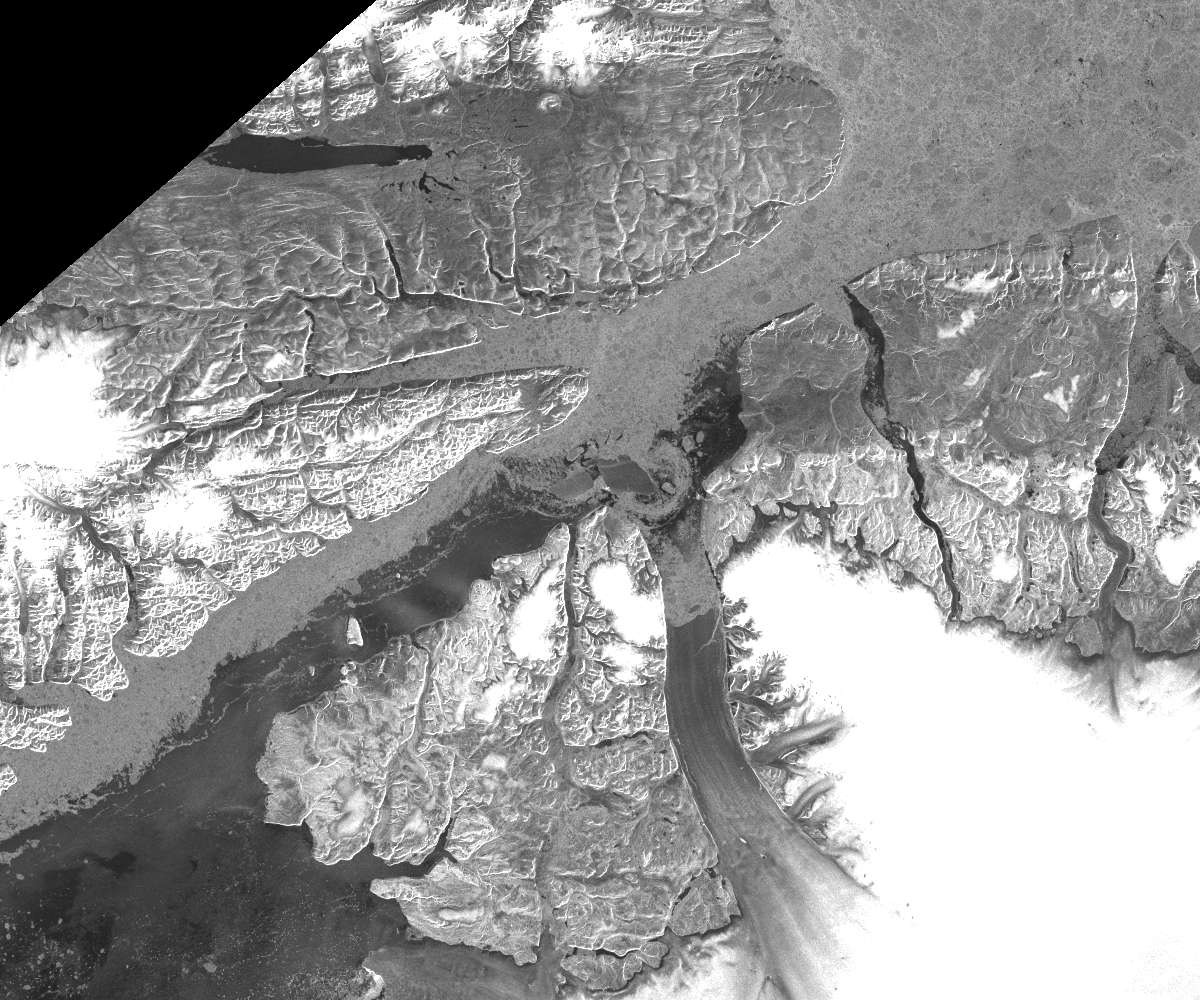
Petermann Ice Island breaks into two segments on Sept.-9, 2010 as seen in this radar image provided by the European Space Agency. Greenland is at the bottom right, Canada top left, the Arctic Ocean is at the top right.

Once in Nares Strait both ice islands experienced a very strong and persistent ocean current. PII-A, about 1.5 the size of Manhattan went first followed by the larger (about 2.5 Manhattans) and thicker PII-B. Their tracks follow each other closely and they almost kiss on Oct.-8, 2010 when both are caught in the same eddy or meander of a prominent coastal current flowing south along Ellesmere and Devon Islands.
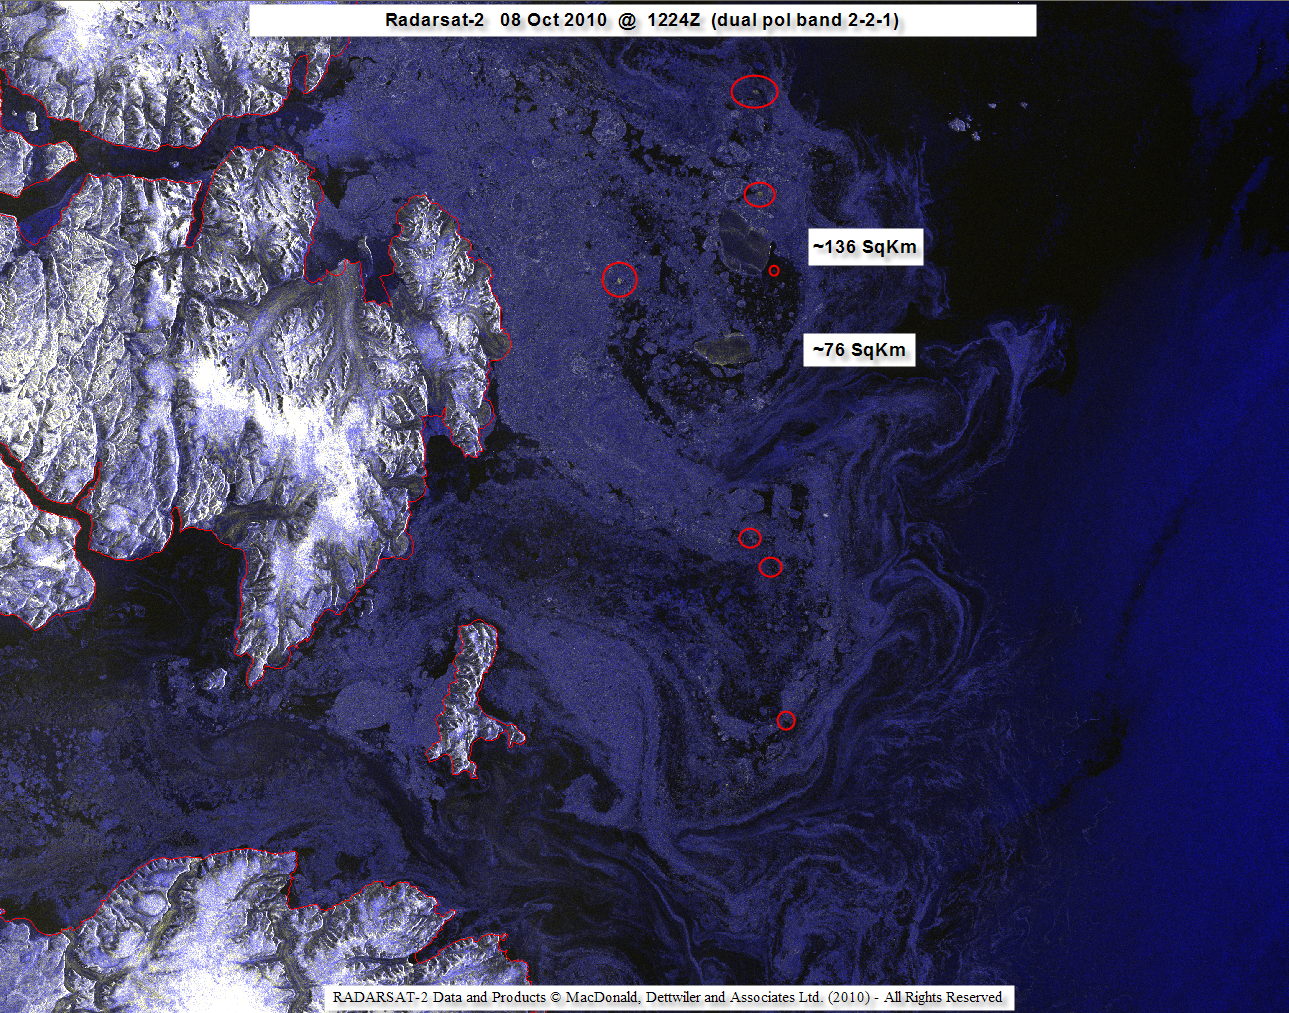
Pieces of Petermann Ice Island on Oct.-8, 2010 off southern Ellesmere Island about 600-km to the south of their origin. RadarSat imagery is courtesy of Luc Desjardins of the Canadian Ice Service, Government Canada.

Within a week the larger 136 km^2 piece PII-B breaks into three pieces of 93.5, 28.9, and 11.3 km^2 by Oct.-16 while PII-A stays largely intact at 73.6 km^2. These are all very large islands, the land area of Manhattan is about 60 km^2 for comparison. Some of these pieces approach the coast, some become grounded for a few days to a few weeks, some break off smaller pieces and spawn massive ice bergs that are not always visible from space. PII-A enters Lancaster Sound a week ahead of PII-B on Nov.-14, but exits it within 2 weeks:
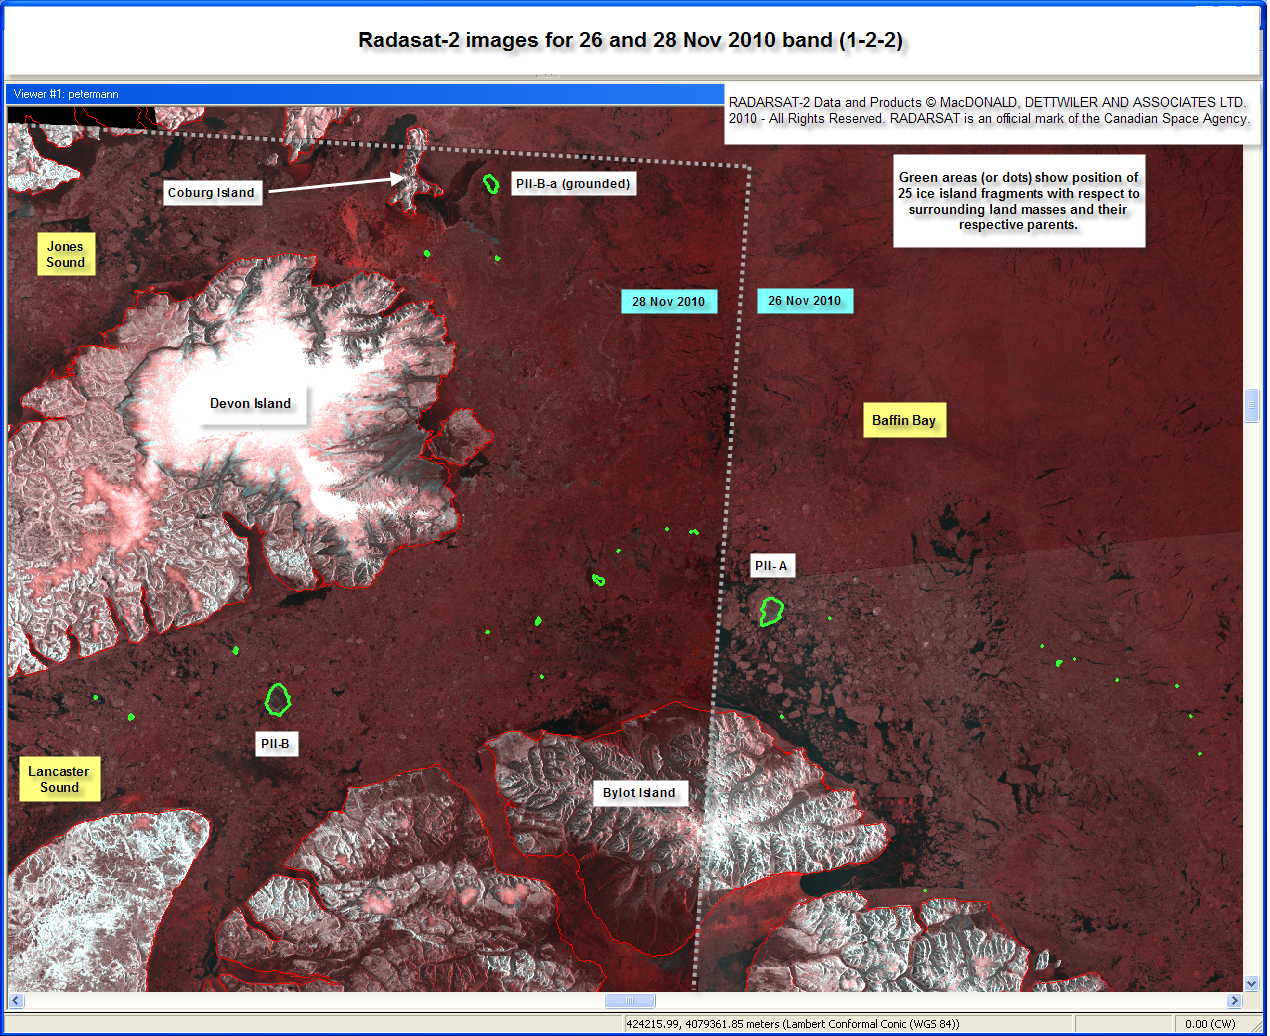
Multiple pieces spawned from Petermann Ice Island as seen by RadarSat on Nov.-26 and Nov.-28, 2010 composited and anotated by Luc Desjardins of the Canadian Ice Service, Government Canada.

Notice also the evolution of a string of segments that Luc Desjardins of the Canadian Ice Service identified as pieces from Petermann Glacier. Glacier ice has a darker radar backscatter signature than the sea ice around it. All these pieces eventually enter the Baffin Island Current, a prominent large ocean current that extends from the surface to about 200-300 m depth. The Petermann pieces are moved mostly by ocean currents, not winds, because there is more drag on the submerged pieces of the 40-150 meter thick glacier ice. In contrast, the much thinner sea ice is mostly driven by the winds. This is also the reason one often finds areas in the lee of icebergs and islands free of older ice which is swept away by the winds as the iceberg moves slower as it is driven by deeper ocean currents. I will talk more of these in a later post.

As part of a large oceanography program in northern Baffin Bay and Nares Strait in 2003, we collected ocean temperature, salinity, chemistry, and current data along lines roughly perpendicular to both Baffin Island in the west and Greenland in the east along with the trajectory of PII-A in the fall of 2010 (red dots) and the almost identical track of a much smaller ice island from Petermann Glacier that passed the area in 2008:
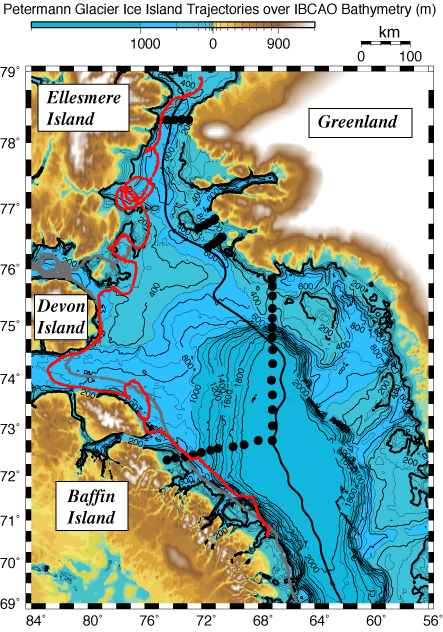
Map of the study area with trajectory of a 2010 (red) and 2008 (grey) beacons deployed on Petermann Glacier ice islands over topography along with CTD station locations (circles) and thalweg (black line). Nares Strait is to the north of Smith Sound.

I will talk about these data and the subsequent tracks of PII-A and PII-B from 2010 into 2011 in Part-2 of this summary on how the first of this piece (PII-A) arrived off coastal Newfoundland in the late summer of 2011. Rest assured that there are many more pieces coming to coastal Labrador and Newfoundland in 2012 and 2013 where they put on a majestic display of abundant icebergs such as this last remnant of PII-A as seen from the air on Nov.-2, 2011 in Notre Dame Bay, Newfoundland.
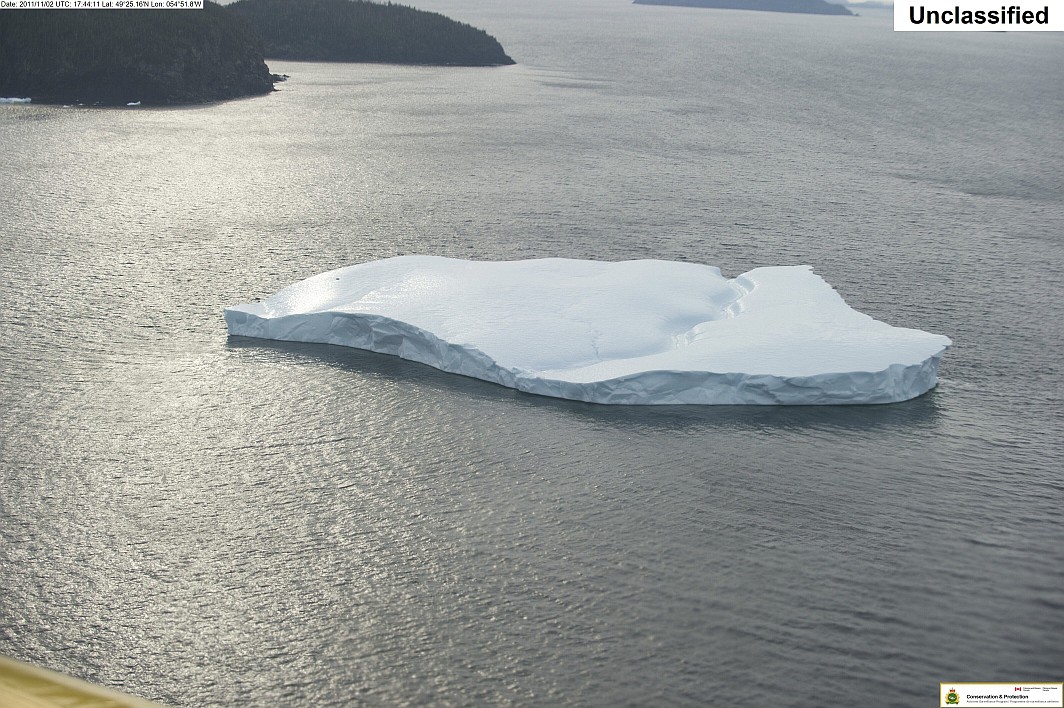
Last surviving fragments of PII-A on Nov.-2, 2011 from a survey by air of southern Notre Dame Bay conducted by Canadian Ice Service, Government Canada..
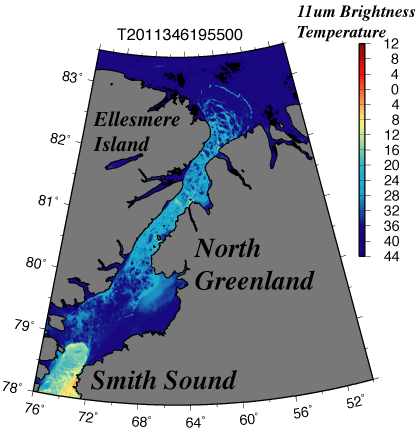
Ice Arch off North-West Greenland Locks Ice Motion in Nares Strait

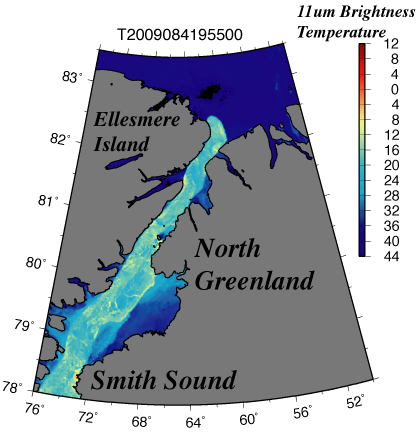
Winter has come to north-west Greenland as the sea ice of Nares Strait has locked itself to land and stopped movement of all ice from the Arctic Ocean in the north to Baffin Bay and the Atlantic Ocean in the south. While there is no sunlight for several more months now during the polar night, the warm ocean beneath the ice emits heat through the ice which becomes visible to heat-sensing satellites. The light yellow and reddish colors show thin ice while the darker bluish colors show thicker ice today:

Dec.-13, 2011 surface brightness temperature of Nares Strait showing an ice arch in Smith Sound separating thin and moving ice (reddish, yellow) from thick land-fast ice (blue).

The prior 2010/11 winter was the first in several years that these normal conditions have returned. The ice arch in Smith Sound did not form in 2009/10, 2008/09, and 2007/08 winters while a weak arch in 2007/08 fell apart after only a few days. Conditions in 2009 were spectacular, as only a northern ice arch formed. Since the ocean moves from north to south at a fast and steady clip, it kept Nares Strait pretty clear of ice for most of the winter as no Arctic ice could enter these waters and all locally formed new “first-year ice” is promptly swept downstream:

March-25, 2009 map Nares Strait, north-west Greenland showing heat emitted during the polar night from the ocean and sensed by MODIS satellite.

The very thin and mobile ice in Nares Strait of 2009 exposed the ocean to direct atmospheric forcing for the entire year. I reported substantial warming of ocean bottom temperatures here during this period. This new 2011/12 ice arch formed the last few days. If it consolidates during the next weeks, then it is very likely to stay in place until June or July of 2012. It decouples the ocean from the atmosphere and, perhaps more importantly, prevents the Arctic Ocean from losing more of its oldest, thickest, and hardest sea ice. This is very good news for the Arctic which has lost much ice the last few years.

For more daily thermal MODIS imagery take a peek at http://muenchow.cms.udel.edu/Nares2011/Band31/ for 2011. Replace Nares2011 with Nares2003 or any other year, and an annual sequence appears. Furthermore, my PhD student Patricia Ryan just sent me a complete list of files that I need to process until 2017. Fun times.

New Ice Island Forming at Pine Island Glacier, Antarctica

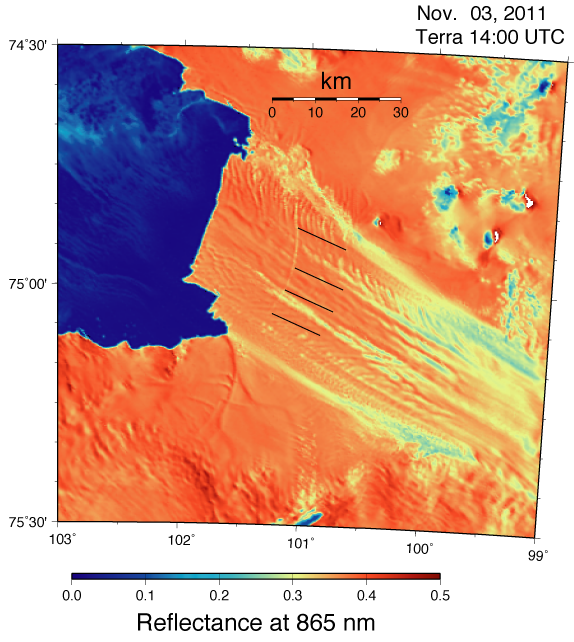
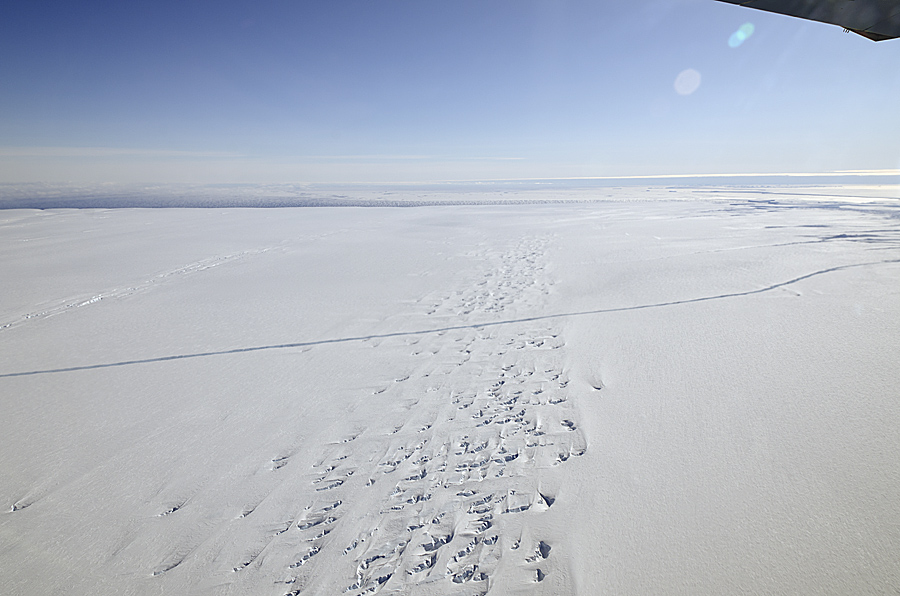
A new ice island is about to form as spring and summer arrive in Antarctica. NASA researchers working on Pine Island Glacier (PIG) as part of the IceBridge Mission discovered a 30 km wide rift some 25 km from the ocean during overflights in a DC-8 research aircraft.The rift will eventually will break off into a tabular iceberg about 10 times the size of Manhattan. The rift is wide enough to be visible in optical satellite imagery that has a spatial resolution of 250 meters. A BBC report credits NASA scientist stating that this large calving of an ice island is part of a natural, roughly decadal cycle.

Pine Island Glacier from MODIS/Terra with crack visible at 250-m spatial resolution.

A crack runs across the floating ice shelf of Pine Island Glacier in Antarctica, seen from NASA's DC-8 on Oct. 14, 2011. Credit: Michael Studinger/NASA

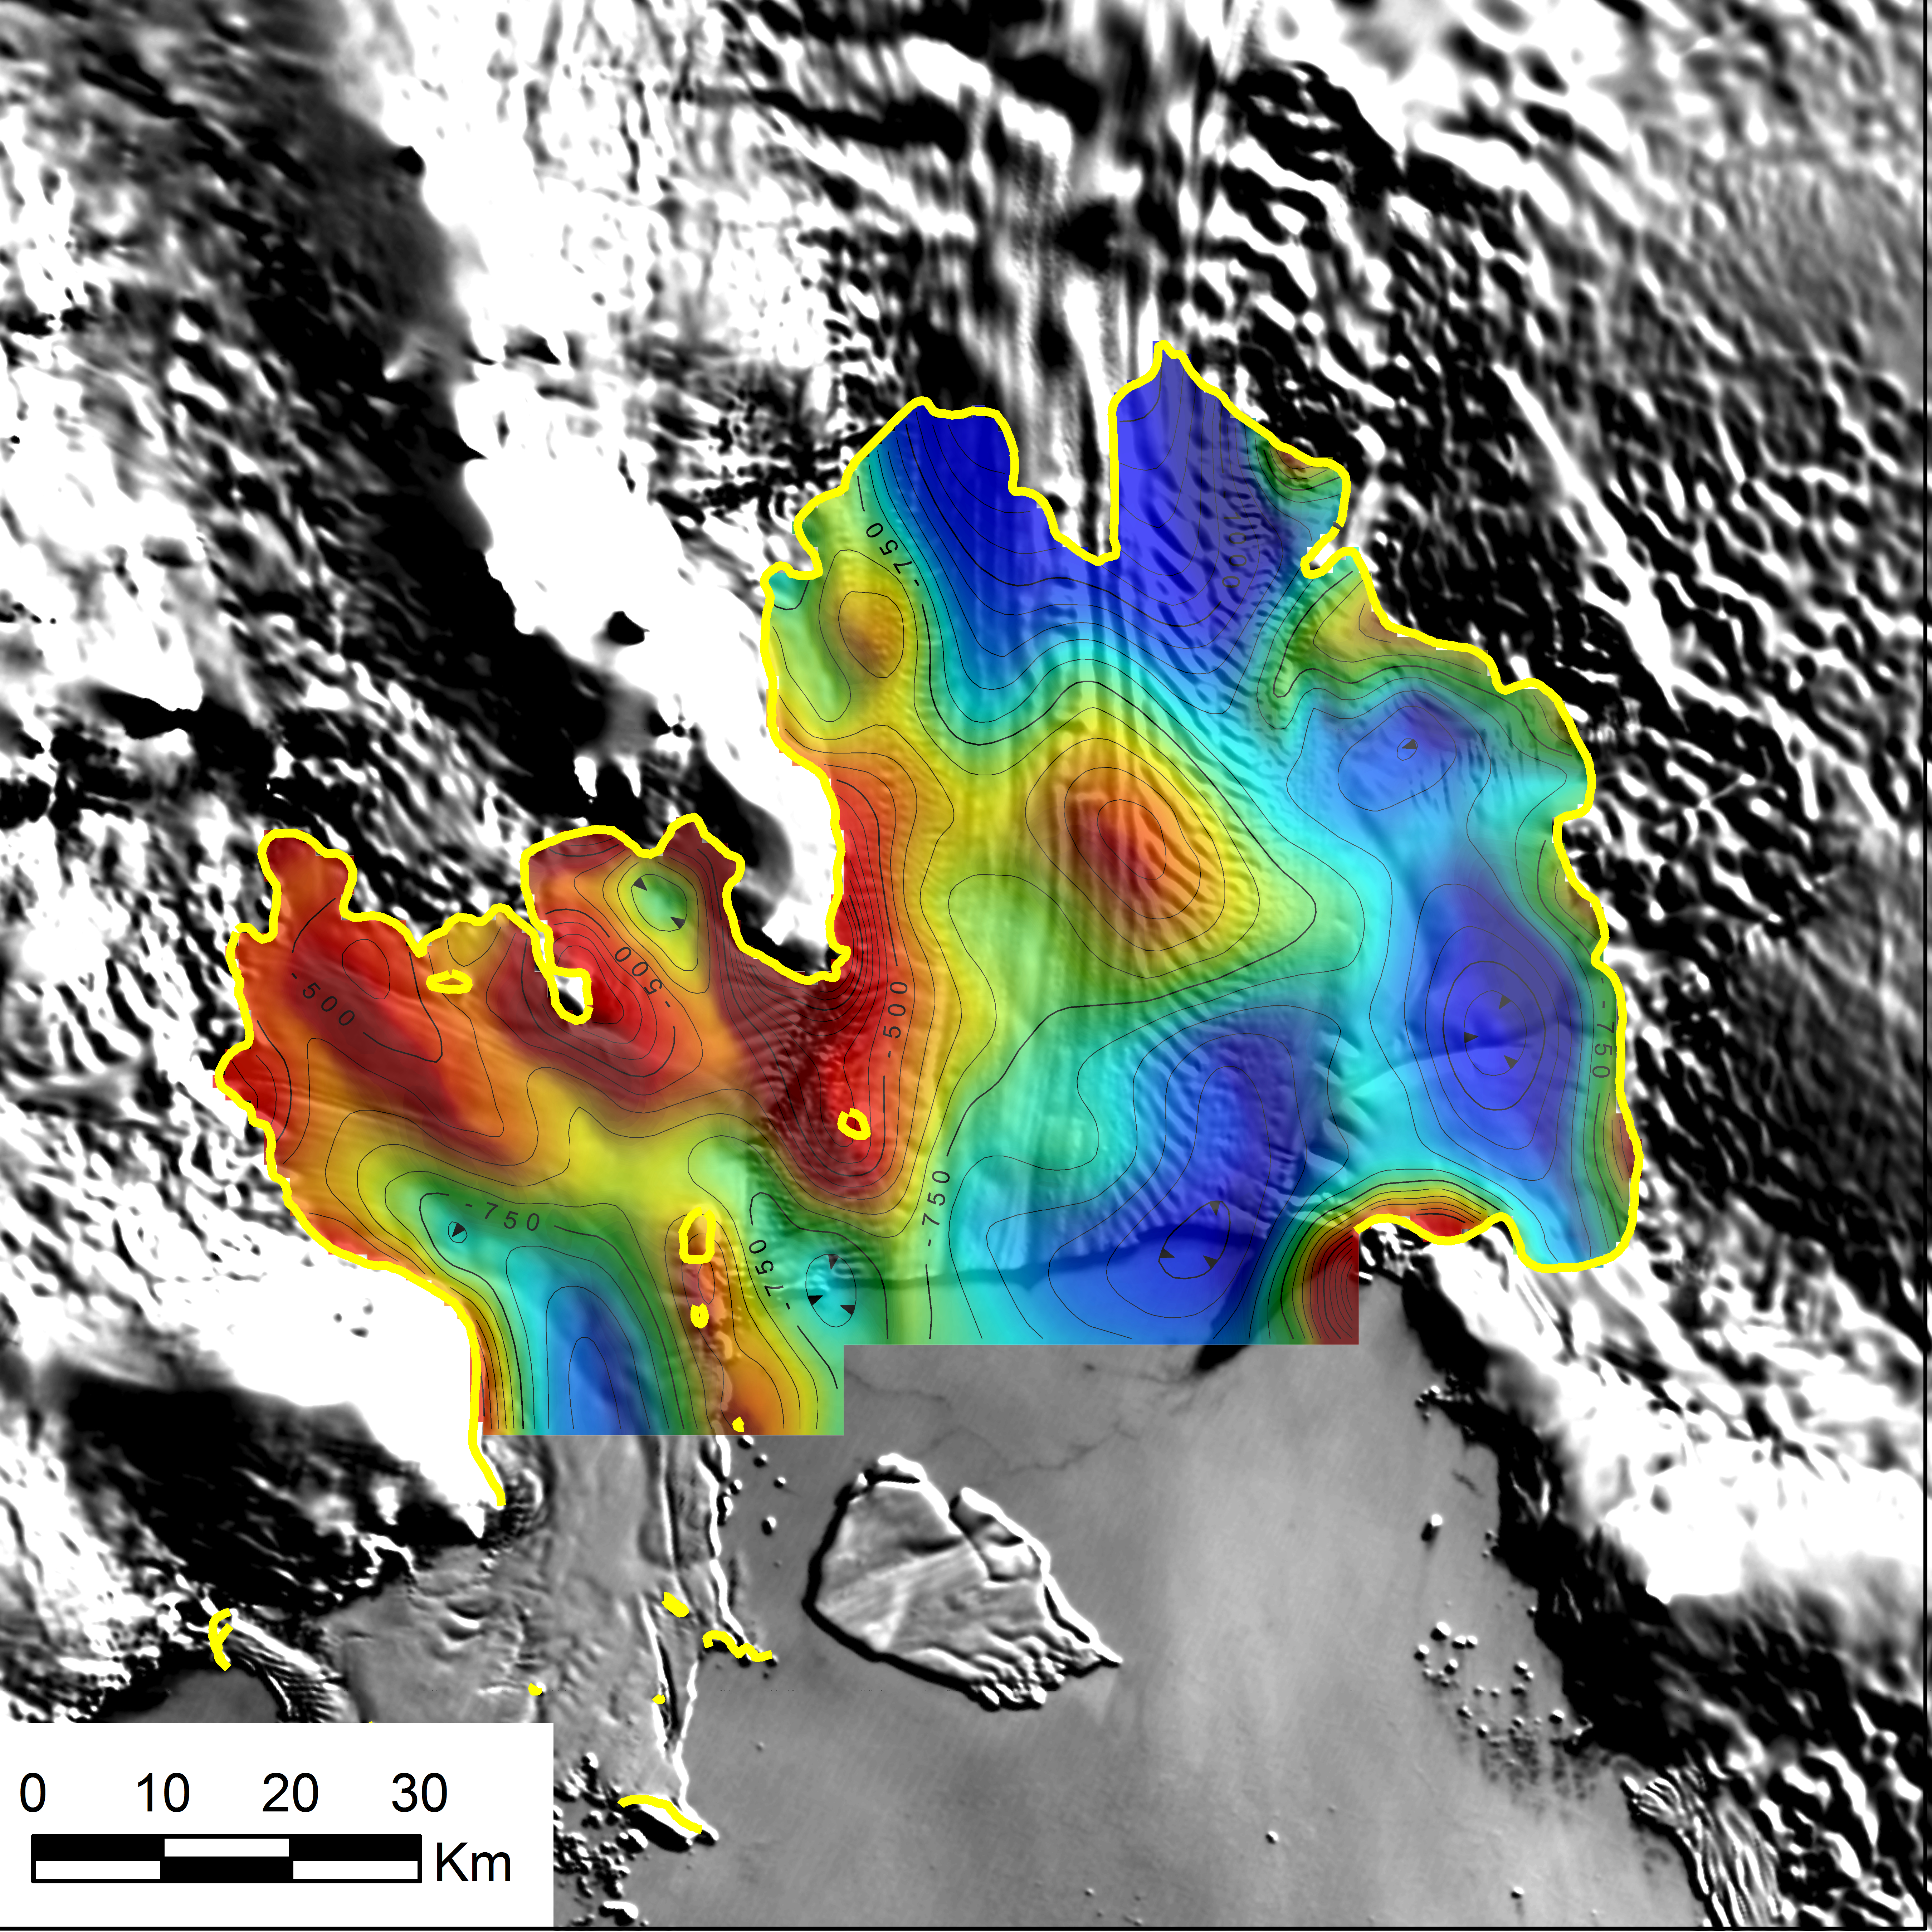
Antarctic massive ice sheets contain 70% of all freshwater and 90% of all ice on earth. Most of this is contained within the stable East Antarctic ice sheet where temperatures have increased little. In contrast, the West Antarctic ice sheet has seen warming by about 0.2 degrees Celsius and a net loss of ice to raise global sea level by perhaps 2-3 inches in 100 years. The grounding line Pine Island Glacier (where ocean, bedrock, and ice meet) has retreated for several decades as warmer ocean waters near the bottom cross a sill and plunge into a landward depression of the bedrock. This leads to enhanced melting of the floating ice-sheet and a potential instability that could lead to a collapse of the ice-shelf and much enhanced discharge of the Pine Island Glacier to draw down a large fraction of the West Antarctic Ice Sheet.

Bottom topography under Pine Island Glacier and grounding line. Blue colors show greater depths and its connection to the open ocean (bottom, north). (credit: NASA)

A similar physical process, albeit at a smaller scale, is potentially working at Petermann Glacier off Greenland where the grounding line is at a local maximum of bedrock elevation. Petermann’s grounding line has probably not moved substantially the last 100 years or so.

More detail on the evolving Pine Island Glacier, Antarctica event can be found at a NASA media briefing.

Global Warming, Signal to Noise, and the History of Doubt

A smart graduate student in our Physical Ocean Science and Engineering program (lets call him/her XXXX) sent me an e-mail yesterday night

Hi Andreas,

I stumbled upon this article tonight and thought you might find it interesting: http://www.climatedepot.com/a/12797/Exclusive-Nobel-PrizeWinning-Physicist-Who-Endorsed-Obama-Dissents-Resigns-from-American-Physical-Society-Over-Groups-Promotion-of-ManMade-Global-Warming

XXXX

I have been reading a lot on this very subject the last weeks and find that the intersection of science, policy, communication, politics, and history a fascinating area of new learning. My response to XXX was thus

XXXX:

This is sad, but neither news nor particular interesting. Dr. Giaever received his Nobel prize in physics for work he did on semi-conductors over 50 years ago. Based on his statements on religion, I am pretty sure, that he has not kept up with the modern peer-reviewed literature on statistics, climate dynamics, or any geophysical field.

He may have missed (or willfully ignored?) work such as Santer et al. (2011): “Separating Signal and Noise in Atmospheric Temperature Changes: The Importance of Timescale” to appear in JGR later this year. I placed a copy of the paper (in press) at

http://muenchow.cms.udel.edu/classes/MAST811/Santer2011.pdf

as it is hard to find right now, even though it is causing a storm in the blogosphere.

If you want to follow critical, skeptical, and credible discussions on climate and its variability (and perhaps the above paper) of actually active atmospheric scientists that fall neither into an “alarmist” nor a “denying” camp, then you may find Dr. Judith Curry’s (University of Georgia)

http://judithcurry.com/2011/09/12/santer-on-timescales-of-temperature-trends/

or Dr. Roger Pielke, Sr. (Colorado State University)

http://pielkeclimatesci.wordpress.com/2011/09/07/comments-on-the-new-paper-separating-signal-and-noise-in-atmospheric-temperature-changes-the-importance-of-timescale-by-santer-et-al-2011/

If you are interested in the historical and political content of this pseudo-debate, you may find Oreskes and Conway (2010) book entitled “Merchants of Doubt: How a Handful of Scientists Obscured the Truth on Issues from Tobacco Smoke to Global Warming” at

http://www.amazon.com/Merchants-Doubt-Handful-Scientists-Obscured/dp/1596916109

I read the book over the weekend and could not put it down. Dr. Santer is an atmospheric scientist working at Los Alamos National Laboratory and has been a lead-author of the IPCC since 1995 while Dr. Oreskes is a science historian working and teaching at UCSD/Scripps.

andreas

Ocean Warming off Greenland near Petermann Glacier

Testifying before the Select Committee on Energy Independence and Global Warming last year, I fumbled one question asked by the Honorable Chairman Edward J. Markey (D-MA): “Is it warming in the Petermann Glacier area?” I was unsure how the regionally relevant ocean temperatures had changed and how it impacts the melting glacier. A year late, we got the answer.

Floating ice shelf of Petermann Glacier on July 22, 2010 (NASA).

I was thinking of my former student Ms. Zweng. Three years earlier she had published a thorough analysis of ocean temperatures in Baffin Bay, that showed statistically significant warming by 0.11 +/- 0.06 degrees centigrade per decade for the 1916 through 2003 period (Zweng and Muenchow, 2006). But Baffin Bay is more than 800 miles away and it is not clear if those waters actually can make it to Petermann Fjord. I was also thinking of data in hand from only 80 miles away in Nares Strait whose waters definitely make it into Petermann, but I had not yet done the analyzes and thus did not know what the data would tell me. Now I do, and the peer-reviewed results (Muenchow et al., 2011) were published last week in Oceanography.

Time series of temperature (bottom) salinity (top) from the bottom of the ocean in Nares Strait between northern Greenland and Canada (from Muenchow et al, 2011). Trends are indicated for the 2003-06 and 2007-09 periods.

The data come from thermometers taking readings for years every 15 minutes. We placed the instruments on the bottom of the 300 meter deep ocean in 2003, recovered them in 2006, threw them back into the ocean in 2007 and found them again in 2009. We got data from three such instruments in 2003-06 and five in 2007-09 that all pretty much show the same thing: Bottom temperature change little during the 2003-06 period and about 0.06 +/- 0.02 degrees centigrade per year during the 2007-09 period of oberservations. Putting this together, we find a warming of 0.023 +/- 0.015 degrees centigrade per year. Next question would be, does this observed ocean warming in Nares Strait matter with regard to Petermann Glacier?

My current answer is a strong no. First, there is so much ocean heat already inside Petermann Fjord to melt away the entire floating section of the glacier (Johnson et al., 2011), that the extra ocean warming in recent years makes little difference. Second, the trends are from very short data sets that are dominated by physics unrelated to warming or could relate to a sequence of a few strong events that could either relate to man-made global warming or natural fluctuation at longer decadal cycles. This detection of signals in noise is a common problem in both engineering and geophysics, it is a required class for all our graduate students.

Very closely related is a paper entitled “Separating Signal and Noise in Atmospheric Temperature Changes: The Importance of Timescale” by Santer et al. (2011). Elegantly and comprehensively the authors expose and quantify the challenges one faces trying to extract the man-made warming signal from globally averaged near surface air temperature records sensed both from satellites and simulated in a number of numerical models. For this variable, the authors conclude convincingly, one needs records between 15-20 years long to extract a statistically significant man-made global warming signal from the much larger noise of natural variability.

So, if I had done my homework better last year, this should have been my answer to the question if it is warming in the Petermann Glacier area: “Yes, both the ocean and the atmosphere are warming in the Petermann region, but this may have little or no impact on the changing Petermann Glacier. Today we do not even know why Petermann Glacier has a floating ice shelf. Since we do not yet understand the physics of ice-ocean interactions, we can neither know nor predict what changes it has in store for us.”