Author Archives: Andreas Muenchow

Why Petermann Glacier and Fjord?

The National Science Foundation (NSF) declined to fund a Physical-Ocean-Ice-Shelf-Experiment (POISE) at Petermann Fjord in northern Greenland this year. The reviews by three anonymous peers, a panel of eight scientists, and two sympathetic program managers were all very good, but not without criticism.
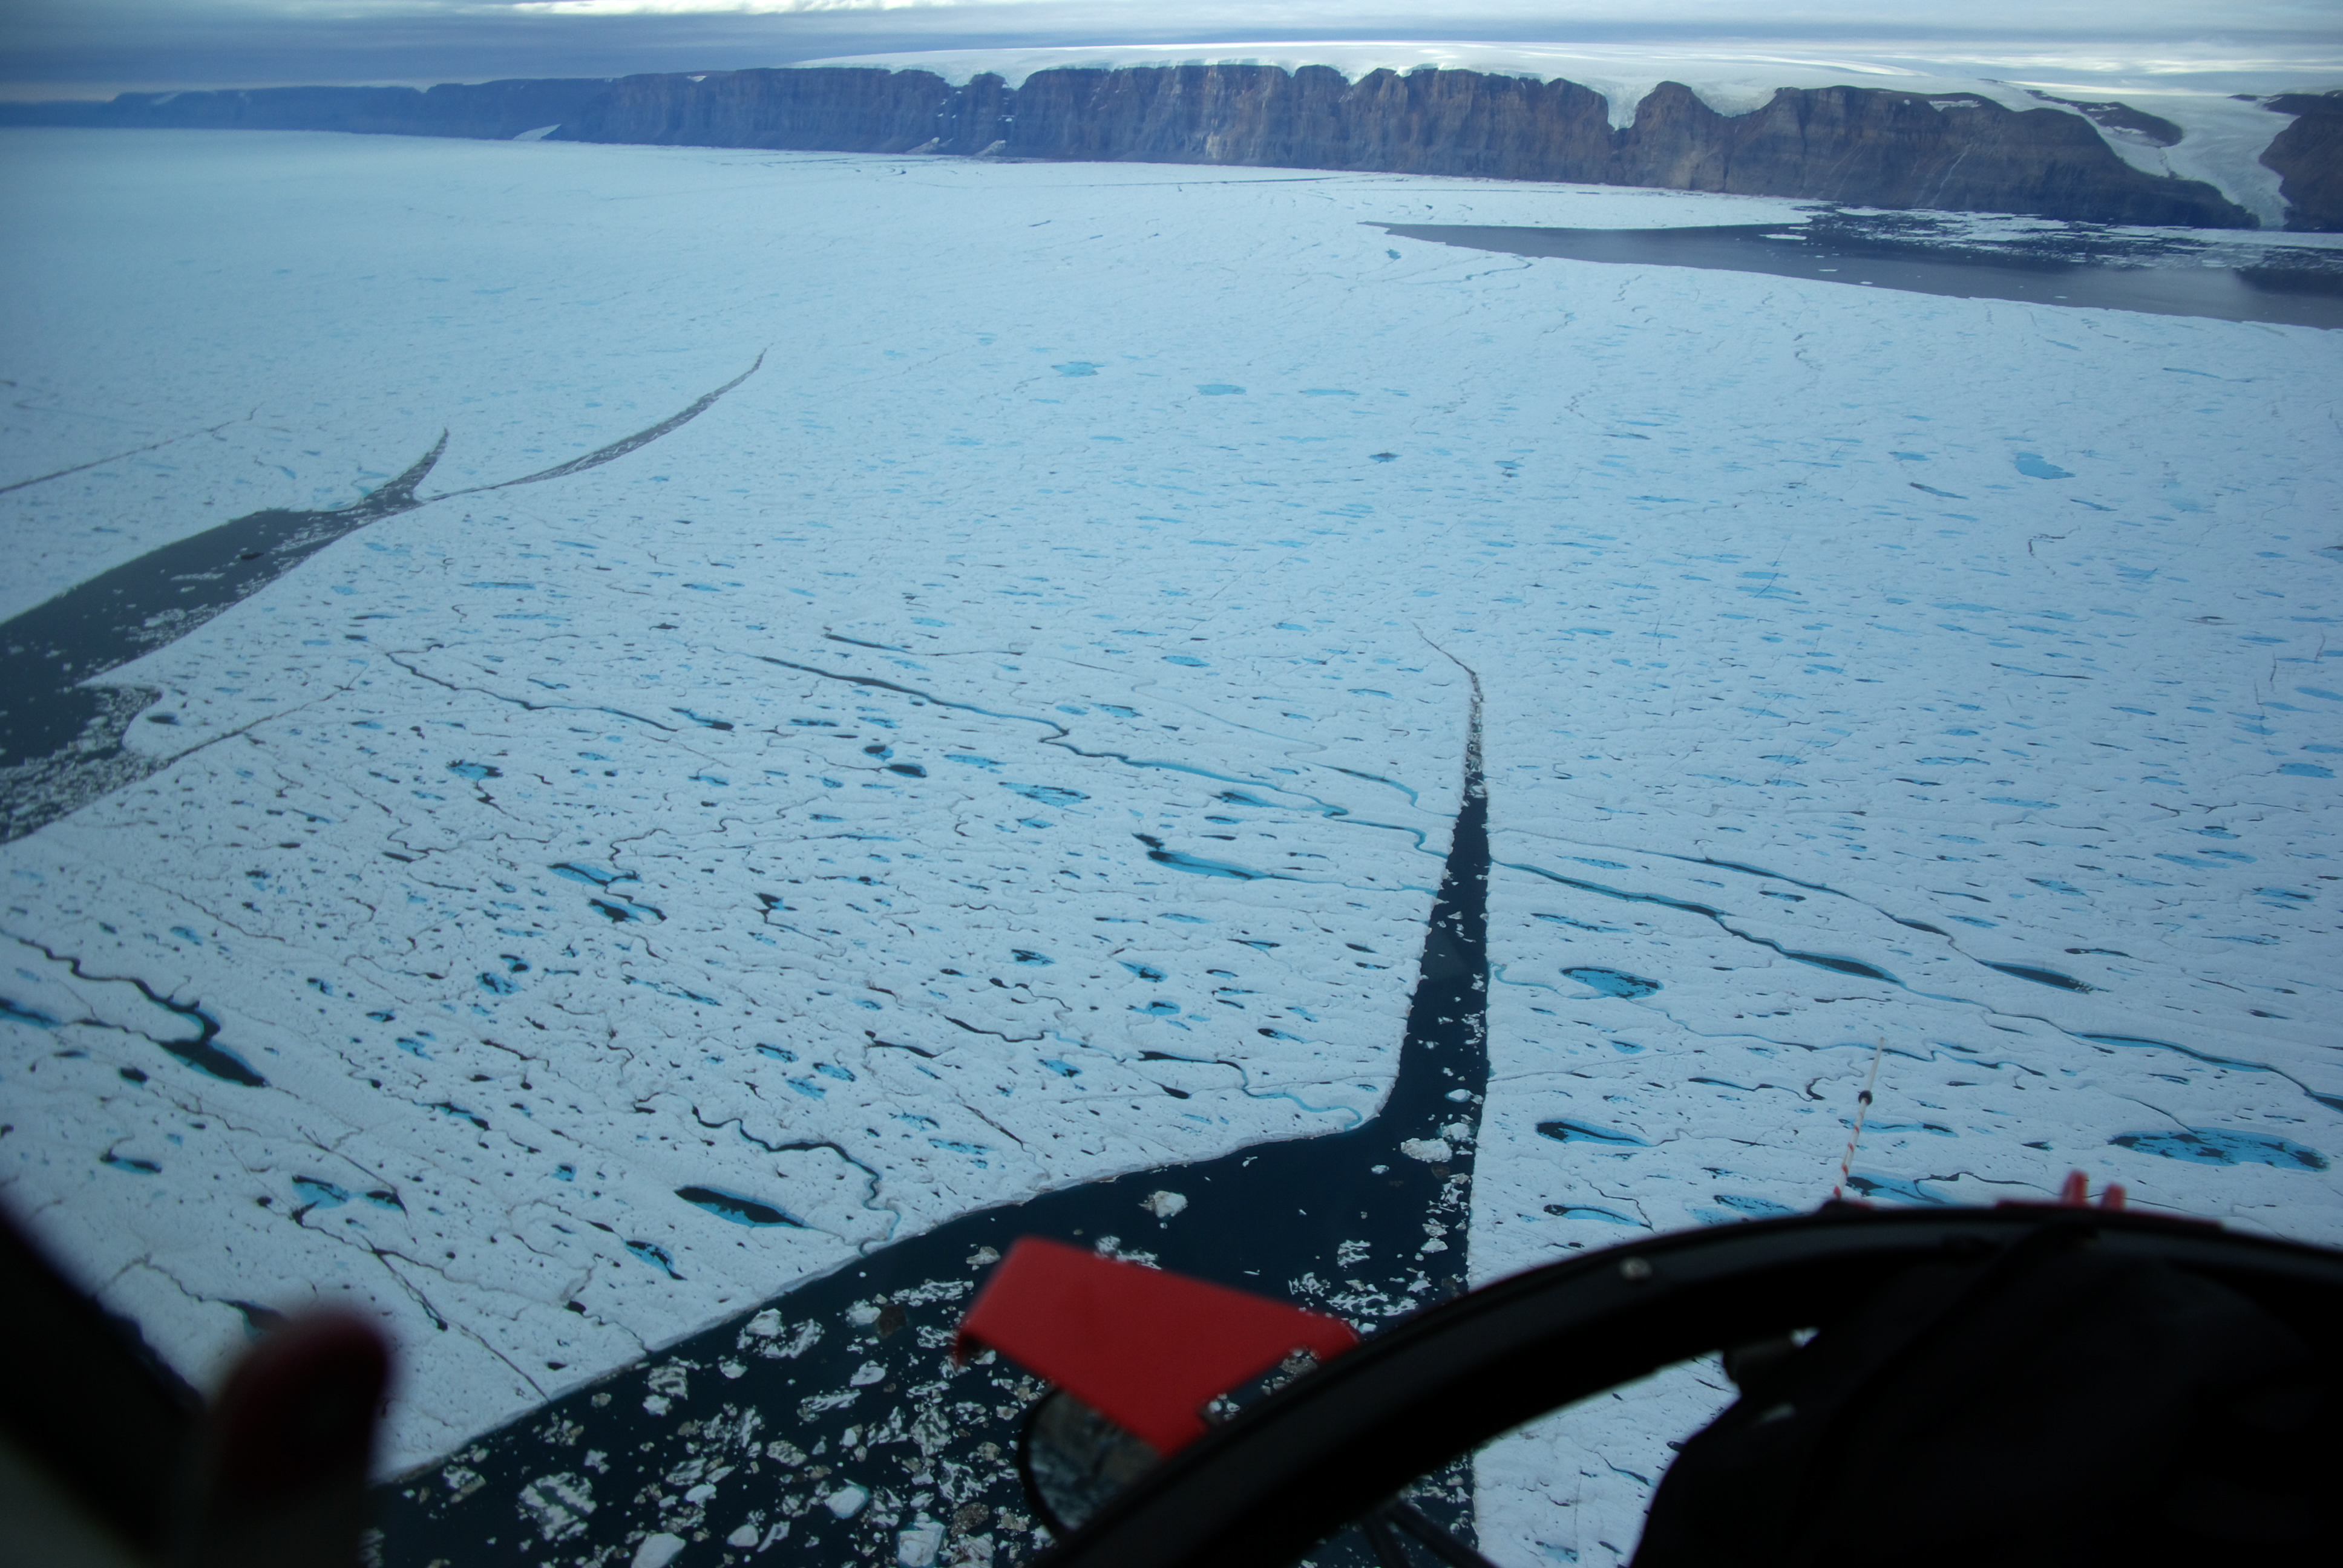
Floating ice shelf of Petermann Glacier in August 2009 as seen from a helicopter of the Canadian Coast Guard Ship Henry Larsen. View is to the south-east with the glacier to the left and the ocean to the right. Photo by David Riedel, British Columbia.

Our admittedly expensive 4-year proposal was rejected along with at least five competing proposals in the same general subject area, because we did not show why a study of ice-ocean interaction of glaciers and ice-sheets has to take place at Petermann Glacier, a remote location less than 800 miles from the North Pole. Claiming this glacier to be unique, we made a fatal mistake, because NSF cares little about each glacier, but cares much about the underlying physical problem, that is, how do tidewater glaciers with floating ice shelves interact with the ocean they float on.

There are several glaciers in Greenland that have extensive ice shelves. To the best of my knowledge, they are all in northern Greenland. Nioghalvfjerdsfjorden and Petermann Fjord contain the largest floating areas exposed to the oceans on the east and west coasts of Greenland, respectively. Both these glaciers have seen preliminary studies during the last 15 years including radar measurements that describe the geometry of the ice shelves, the bedrock below, as well as the ice streams to connect the glaciers to the inland ice. Smaller and less studied glaciers with past or present ice shelves are Steensby, Ryder, and C.F. Ostenfeldt in the north-west as well as Academy and Marie-Sophie glaciers in the north-east (Weidick, 1995).

The most extensive ice shelves are located around Antarctica, however, and one thus may wonder, what uniform physics can and should be studied in northern Greenland that also applies to the ice sheets in the south? I would need some scaling law or normalization scheme that connects many glaciers into an organizational scheme. In physical oceanography the near-balance of a density-driven (internal) pressure gradient and the effects of a rotating earth provides a dynamical scale that connects river discharges off Delaware, with ice patterns off Eastern Greenland, and algae bloom patters off northern Norway, among many other phenomena. What dynamical metric connects the ice sheets of Greenland to each other and to those off Antarctica?
Swirling Ice in Coastal Waters off Eastern Greenland

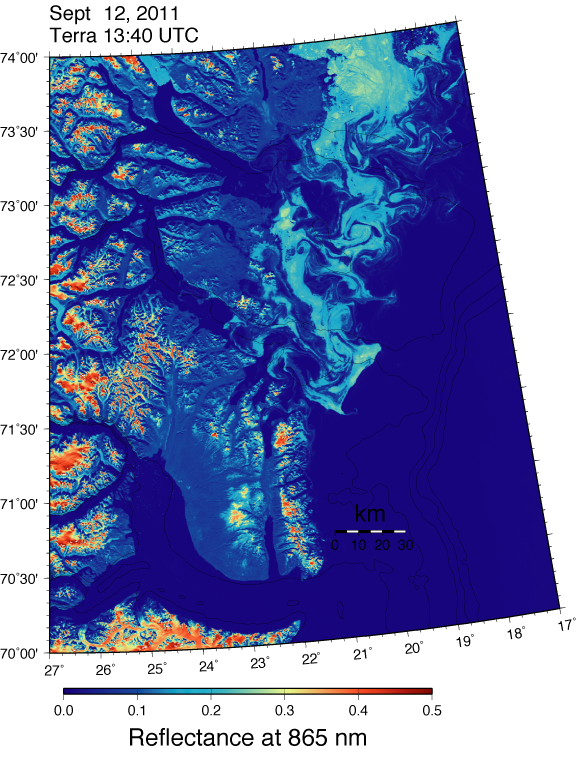
Nature provides us with art that is always changing in time and space. Delicate swirls and vortices give a rare glimpse of how the ocean’s surface looked today off eastern Greenland. The data originate from the MODIS/Terra satellite which from 440 miles above the earth captures light that is reflected from anything below. Here it shows the ice-free ocean (bottom right) and Greenland’s ice-free Scoresby Sound (bottom left) in very dark blues, lightly vegetated lands (left) in light blue, and a highly organized pattern of sea ice (top right) in white. The resolution of this image of light just beyond the visible, just beyond the red is about 300 yards and the swirls and elongated filaments are about 3-5 miles. To me, they vividly show the ocean’s surface circulation.

Swirling surface motion on the continental shelf off eastern Greenland Sept.-12, 2011 as indicated by sea ice. Black lines show contours of bottom depth from 300 to 1200 meters in 300 meter increments.

The physics of these motions are similar to those I was reading into another beautiful work of art to the north of Norway. The postulated physics involve the earth’s rotation as well as differences in density. The density of the ocean relates to its temperature a little and to its salinity a lot. Near the coast and at the surface, ocean waters are much fresher and thus lighter than they are offshore and at depth, because Greenland’s melting glaciers and sea ice are fresher than the waters of the Atlantic Ocean. The thin black lines show bottom depths to distinguish the deep Atlantic Ocean to the right in the image from the shallow continental shelf off eastern Greenland to the left in the image. Note that all the swirls, eddies, and filaments are within 30 kilometers (20 miles) off the coast in water less than 300-m deep. The same physics apply to the algal blooms off Norway which is the reason that the swirls and eddies are of similar size here and there as well.

Incidentally, the same physics also apply the discharges from rivers and estuaries such as the Delaware or Cheasapeake Bay. There, the pattern are not quiet as visible to the naked (satellite) eye as off Norway or Greenland, but if one takes measurements of the ocean, similar patterns of ocean salinity and velocity as, I speculate, they do here for the ice (Greenland) and algae blooms (Norway). While my academic journey of fresh water discharges started with the discharge of the Delaware River into the Atlantic almost 25 years ago, I am still fascinated by the many ways these patterns always come back to me. Physics and oceanography are beautiful in both their many natural manifestations and its unique balance of forces. There is so much more in how the oceans interact with the ice and glaciers off Greenland and elsewhere. To be continued …

Petermann Ice Island PII-A Breaks into Two

The 35 square kilometer sized ice island from Petermann Glacier PII-A has split into two pieces of about equal size over the last 4 days while moving almost 10 km per day to the south along the 150 meter contour of water depth.

Petermann Ice Island PII-A as seen by MODIS/Terra as one piece on Aug.-14, 2011 and as two pieces on Aug.-22, 2011 (click to enlarge).

It cleared the Grey Islands to its north and may now turn counter-clockwise around deeper water to the north of Horse Islands. The Canadian Ice Service continues to watch the many icebergs that PII-A has spawned all along the Great Northern Peninsula of Newfoundland with daily charts and RadarSat imagery. While the data from the NASA’s MODIS mission resides in the public domain serving a global community, the Canadian RadarSat is commercial product unaffordable serving only a select few.

The two new ice islands should perhaps be called PII-Aa and PII-Ab. While their size no longer compares well to that of all of Manhattan, each is about as big as 5 Central Parks of Manhattan, or about 10,000 times my garden which is a third of an acre.

Ocean Paintings off northern Norway

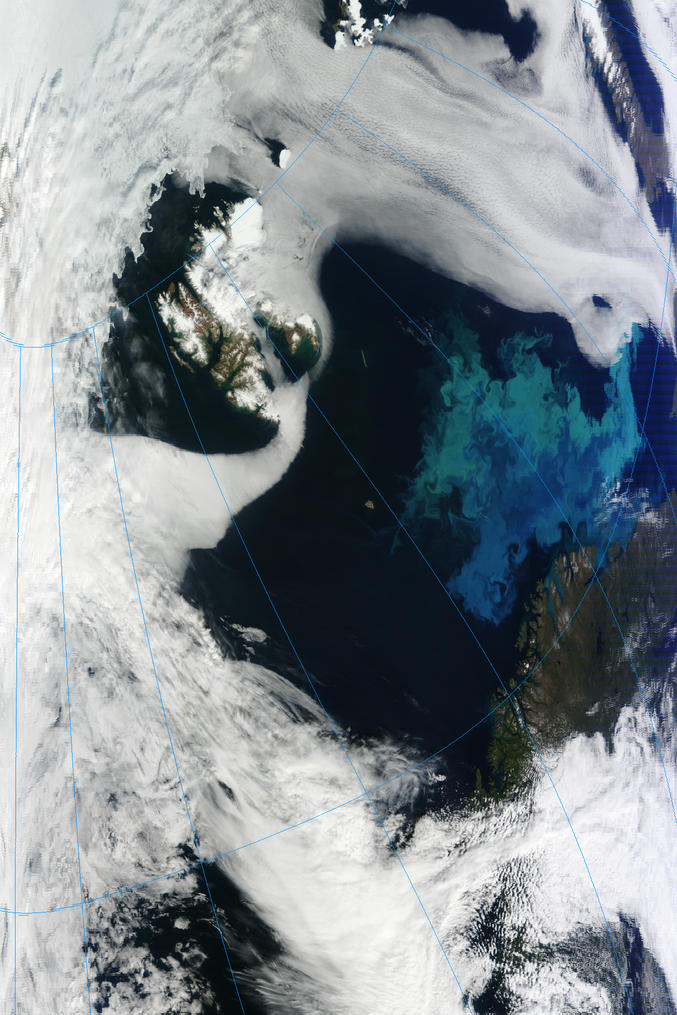
Someone is painting the ocean to the north of Norway and Russia in vivid colors, twirls, and twists for the last two to three days. The exuberance and rich detail reminds me of a Vincent van Gogh. While some may see a divine hand and design at work, I see tiny plants floating in a turbulent ocean. To see the ocean, one needs a satellite in space to cover this painting more than 1000 miles wide and long. To see the plants, one needs a microscope.

Algae blooms off northern Norway Aug.-16, 2011. Spitsbergen is seen in the top left, Norway bottom right, and Novaya Zemya to right.

The painting shown here is coarse and crude, because it is composed of dots that are two kilometers big, but anyone with a fast connection can download the same painting with dots that are two hundred and fifty meters big here. The canvas is bigger than your computer screen, so you will need to scroll around.

The colors are made by stuff in the ocean, called coccolithophores that reflects sunlight back to detectors (light catchers) on the MODIS satellite which for the last 11 years has cycled around the globe shooting a picture every five minutes as it flies overhead. It returns to the same spot every sixteen days, but since all tracks come always together over the North and South Pole, there are many images of the same region in the far north and south of this earth.

Scientists study ice and clouds and glaciers and small plants in and near the oceans using the numbers (digits) that the satellites sent back to earth. On land our soldiers in Afghanistan and Iraq use these and similar observations to prepare for sandstorms on land. Under water, our Navy Seals use them to prepare for visibility in coastal waters. So lots of stuff is done with these data, but the amazing thing to me, and I truly love my country for this, all these data are made available for all to see and for all to use as they see fit. If I download and crunch numbers, anyone can. I’ll teach you, too.

Petermann Ice Island PII-A on the move again

Sitting stuck on the bottom at 80 meters depth for the past week off St. Anthony’s, PII-A is in the move again heading south by south-east (click on image to enhance). It is melting only at the surface, breaking off smaller icebergs, because the ocean water temperatures near the bottom are colder than the freezing point of fresh water. The ocean’s salinity ensures that the freezing point of sea water is close to -1.7 C while that of fresh water is 0.0 C. More details on how the waters off Labrador and Newfoundland looked like in 2009 within a climate context is Colbourne et al. (2010) (big file, slow link).

Petermann Ice Island PII-A on Aug.-7 and Aug.-14, 2011 off St. Anthony, Newfoundland over contours of bottom depth. Black dotted line is the track until Aug.-9, 2011 from a beacon on PI-A