Author Archives: Andreas Muenchow

Petermann Ice Island PII-A Within Three Miles off Newfoundland

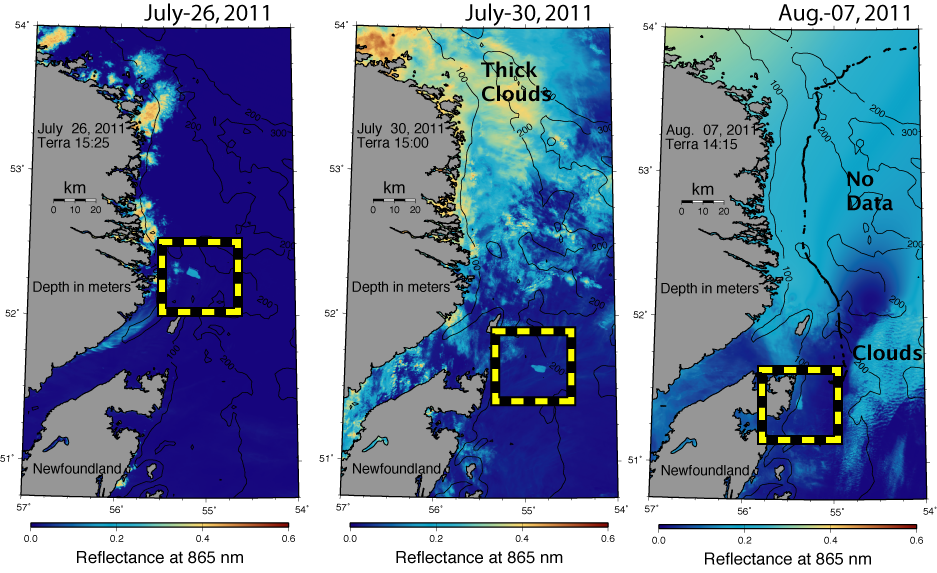
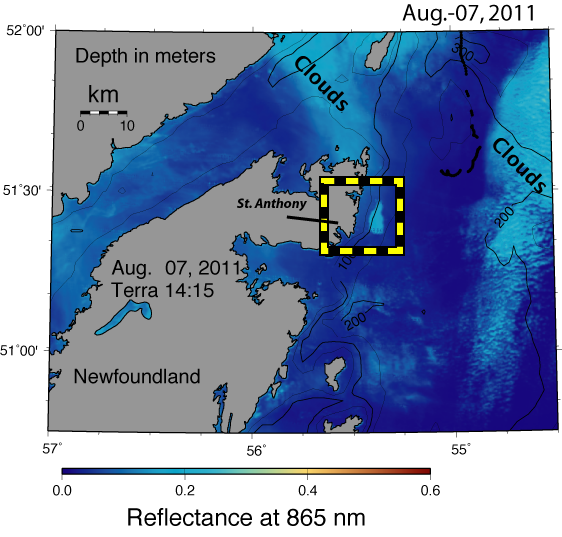
The Petermann Ice Island PII-A is within 5 km (3 miles) from the shores off St. Anthony, Newfoundland. The MODIS Terra image of this morning shows PII-A sitting in water 100 meters (330 feet) deep. The island may be partially grounded, because its thickness is close to the water depth.

Petermann Ice Island PII-A 3 miles from shore.

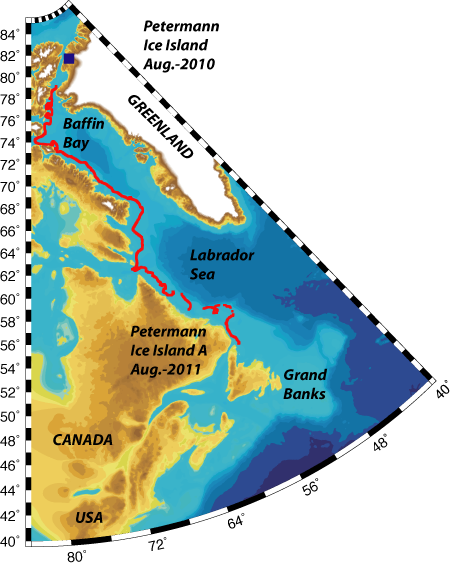
Petermann Ice Island PII-A off Labrador and Newfoundland.

The dotted black line shows the track of PII-A until last week as determined from one of three beacons placed by the Canadian Coast Guard and Ice Service.

Global Weight Watch: Slimmer Greenland and Fatter Tropics

An ice island four times the size of Manhattan separated from Petermann Glacier, Greenland last year. Today one of these Manhattans reached the coast of Newfoundland. Never before has as large a piece of ice from Greenland reached this far south. Does this show a warming climate taping into Greenland’s 20 feet potential to raise global sea level?

Track of Petermann Ice Island from Aug.-2010 through Aug.-2011 traveling in shallow water from northern Greenland along Baffin Island and Labrador to Newfoundland.

Greenland’s glaciers always melt with pieces breaking off. This raises sea level if Greenland receives less snow atop than it loses ice at the bottom. For the last 10 years Greenland lost about 200 trillion pounds of mass, net, per year. [At 5 cents per pound, this pays off the federal debt within a year.] Distributing this mass over all oceans, we raise global sea level by one inch in 75 years. Nothing to worry about, but there is a twist: Weight watching satellites show that Greenland becomes thinner, while the Tropic grow fatter. Records of weight gain and loss are too short to draw firm conclusions, yet, but they are consistent across the globe and the trends of gain and loss are increasing, too.

We do not understand the physics, stability, and uncertainty of these increasing gains and losses well enough to make reliable predictions. If the climate over Greenland is stable, as it has been for the last 10,000 years, then this matters little. If the present equilibrium reaches a tipping point, where a small change will kick us into different stable state, then we can expect sea level to increase 10 times or more. We understand tipping points in theory, but not in practice. In practical terms, we do not know if our children must deal with two inches of sea level from Greenland by the end of this century or 80 inches or none at all. We know only too well, however, that low-lying places like Bangladesh, the Netherlands, and New Orléans struggle with the sea level we have now.

Greenland’s ice island off Newfoundland indicates a globally connected world. Burning stuff over Europe, America, and increasingly Asia creates heat that melts Greenland at a rate that is increasing. What happens in Greenland does not stay in Greenland, but it impacts Rome, Miami, and Shanghai. More ice and rising sea level will come. To play it safe, let’s think smartly what and how we burn. To play it loose and reckless: burn, baby, burn … or was it drill?

Winners and Losers of Climate Change

People with computers live long, prosperous lives, those without die early. Does this correlation mean that computers make us live longer? Of course not, but on average computer users live longer the same way that global temperatures increase as more people use computers. Does this now mean that warmer temperatures are good for you? Absolutely, if you have a computer …

Sum of undepleted CO2 emissions (top) 1950-200 and expected death by malaria, hunger, diarrhea, and flooding (bottom) as adapted from Patz et al. (2007)

I came across a report sponsored by the medical journal “The Lancet” and the University College of London entitled “ Managing the health effects of climate change.” There are pictures of glaciers, volcanos, floods, and many dazzling graphs. The most stunning is a distorted and bulging earth (Patz et al., 2007).

On top it shows the total undepleted CO2 put into the air from 1950-2000. The larger a region on the map, the more CO2 a region puts into the air. On the bottom, it shows how many people will likely die as a result of calamities that are larger in a warming climate for the 2000-2030 period. The larger the region on the map, the more people will be wiped out.

Enjoying a high standard of living fueled by burning coal, oil, and gas, we Europeans and North-Americans use energy to keep our computers, cars, and industries running. In the process we released about 10-30 pounds of CO2 per person per day averaged of the last 50 years. We are immune to malaria, a disease fostered by warmer climates; we got a strong economy to feed and cloth us so we do not starve; and except for the poor of New Orleans who drowned in hurricane Katrina, we rarely die of floods.

The situation is different in Africa and Asia. The average CO2 released is well below 2 pounds per person per day. There just are not as many computers, cars, and industries there. Instead, malaria is the main killer as it reproduces fast. Rising sea levels caused by a warming climate will cause more flooding of poorly protected areas where more poor people will drown.

No single flood, malaria, or drought will ever be caused by global warming alone. Global warming is an abstract and statistical concept that varies by region and over time. It is always present and poses an ethical dilemma: those with computers cause most of the global warming, but we do not pay the full price, while those without computers who contribute the least to the warming, they will pay more than full price. Hardly seems fair, but such is life … and we need our computers.

Petermann Ice Island Seen from International Space Station

Ron Garan aboard the International Space Station just send this photograph of Petermann Ice Island PII-A down to earth as reported by Jason Major.

Petermann Ice Island PII-A on July-25/26, 2011 as seen by MODIS/Terra and the International Space Station

While the detailed photo indicates that the ice island was about as close to the coast as it is long, it has since moved offshore and to the south. The ice island is on its way to clear the similar sized island of Belle Isle in the middle of a channel that separates Labrador in the north from Newfoundland in the south. The distance from the coast is not all that relevant, but the water depth is. Classical physical oceanography says so and I urge you to watch this MIT movie.

In a nutshell: The rotating earth limits large-scale flows, such as those that propel the ice island, to move in ways that seem to make no sense. More specifically, if there is a tiny change of the bottom depth, then the flow at all depths, and this includes the surface, will want to go around this obstacle to stay with the depth it started at. It is very hard to move water from water 200 meters deep such as on continental shelves to water 2000 meters deep such as further offshore. There are exceptions to this rule, of course, but they involve other forces that usually, but not always, are small.

It is so much fun to watch and predict where this ice island will move next, especially if one can be proven wrong so easily. “The proof of the pudding is,” as Cervantes has Don Quixote say so wisely, “in the eating.”

Uncertainty in the Physics and Philosophy of Climate Change

I wrote this post last year for the National Journal, but it also relates to the way I think about Petermann Glacier’s ice islands. There are now at least 4 larger ice islands that formed from last year’s single calving: one is the tourist attraction off Labrador and Newfoundland, a second has left Petermann Fjord last week, a third was grounded off Ellesmere Island for much of the year and is now where #1 was Nov.-2010, while the fourth … I do not know. Last I heart, it was grounded off central Baffin Island. With this much variation of where pieces of the ice island went, how can we possibly claim any skill in predicting anything?


Neither climate nor weather is linear, but this neither makes them unpredictable nor chaotic. The simple harmonic pendulum is the essence of a linear system with clear cause and effect relations. Oscillations are predictable as long as the initial forcing is small. Furthermore, a linear trend will show the pendulum to slow down due to friction. Corrections are straightforward.

Unfortunately, climate is not a simple, harmonic, or linear system. While this does not make it unpredictable or chaotic, it means that our “common sense” and loose talk of “totality of events” can easily fool us. We know that CO2 emissions for the last 150 years changed global temperatures. We also know that our current climate system has been very stable over the last 10,000 years. What we do not yet know is how small or how large a perturbations the last 150 years have been. If the pendulum is forced too much, if the spring is stretched too far, the system will find another stable state by breaking. Climate dynamics can find an adjustment less tuned to the areas where people presently live. This is what “tipping points” are about. Only numerical experimentation with the best physics and models will suggest how close to a different stable climate state we are. The IPCC process is one way to do so.

Ice cores from Greenland contain air bubbles 100,000 years old, which clearly demonstrate that our present climate state is the “anomaly of quiet” in terms of temperature fluctuations. The absence of large fluctuations for about 10,000 years made agriculture and advanced civilizations possible. The ice cores show that abrupt climate change has happened and may happen again, not this election cycle, but it is one possibility perhaps as likely as the possibility that climate change is mundane, linear, and follows trends that we can easily correct or mitigate later. Both are excellent hypotheses.

For scientists, these are exciting times as we conduct a massive, global experiment to see how much CO2 we can add to the atmosphere to perhaps find a different climate state. Dr. Terry Joyce, Senior Scientist at Woods Hole Oceanographic Institution once said: “I’m in the dark as to how close to an edge or transition to a new ocean and climate regime we might be. But I know which way we are walking. We are walking toward the cliff.” I agree with this sentiment, but add that we do not know if this cliff is a 1000 feet fall or a 2 feet step. Can we affort to wait until we know for sure? As a scientist I do not care. As a citizen, however, I think the time to act responsibly is now.