I am still stunned to see data coming to me hourly from below a glacier in northern Greenland while I sip my breakfast coffee. Each and every day for the last 100 days I got my data fix from the Ocean Weather Station that was born 100 days ago. Every morning at 8:15 the station sends me data from 5 ocean sensors below the glacier. A year ago I did not even know that I would be going to northern Greenland with the Swedish icebreaker I/B Oden in the summer of 2015, never mind that we would be able to pull off the engineering challenge to set up the first and only ocean observing system of Greenland. Today, I am over-joyed to report, we got 100 days of data.

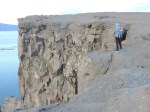
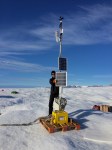
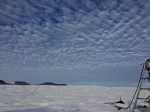
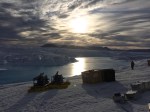
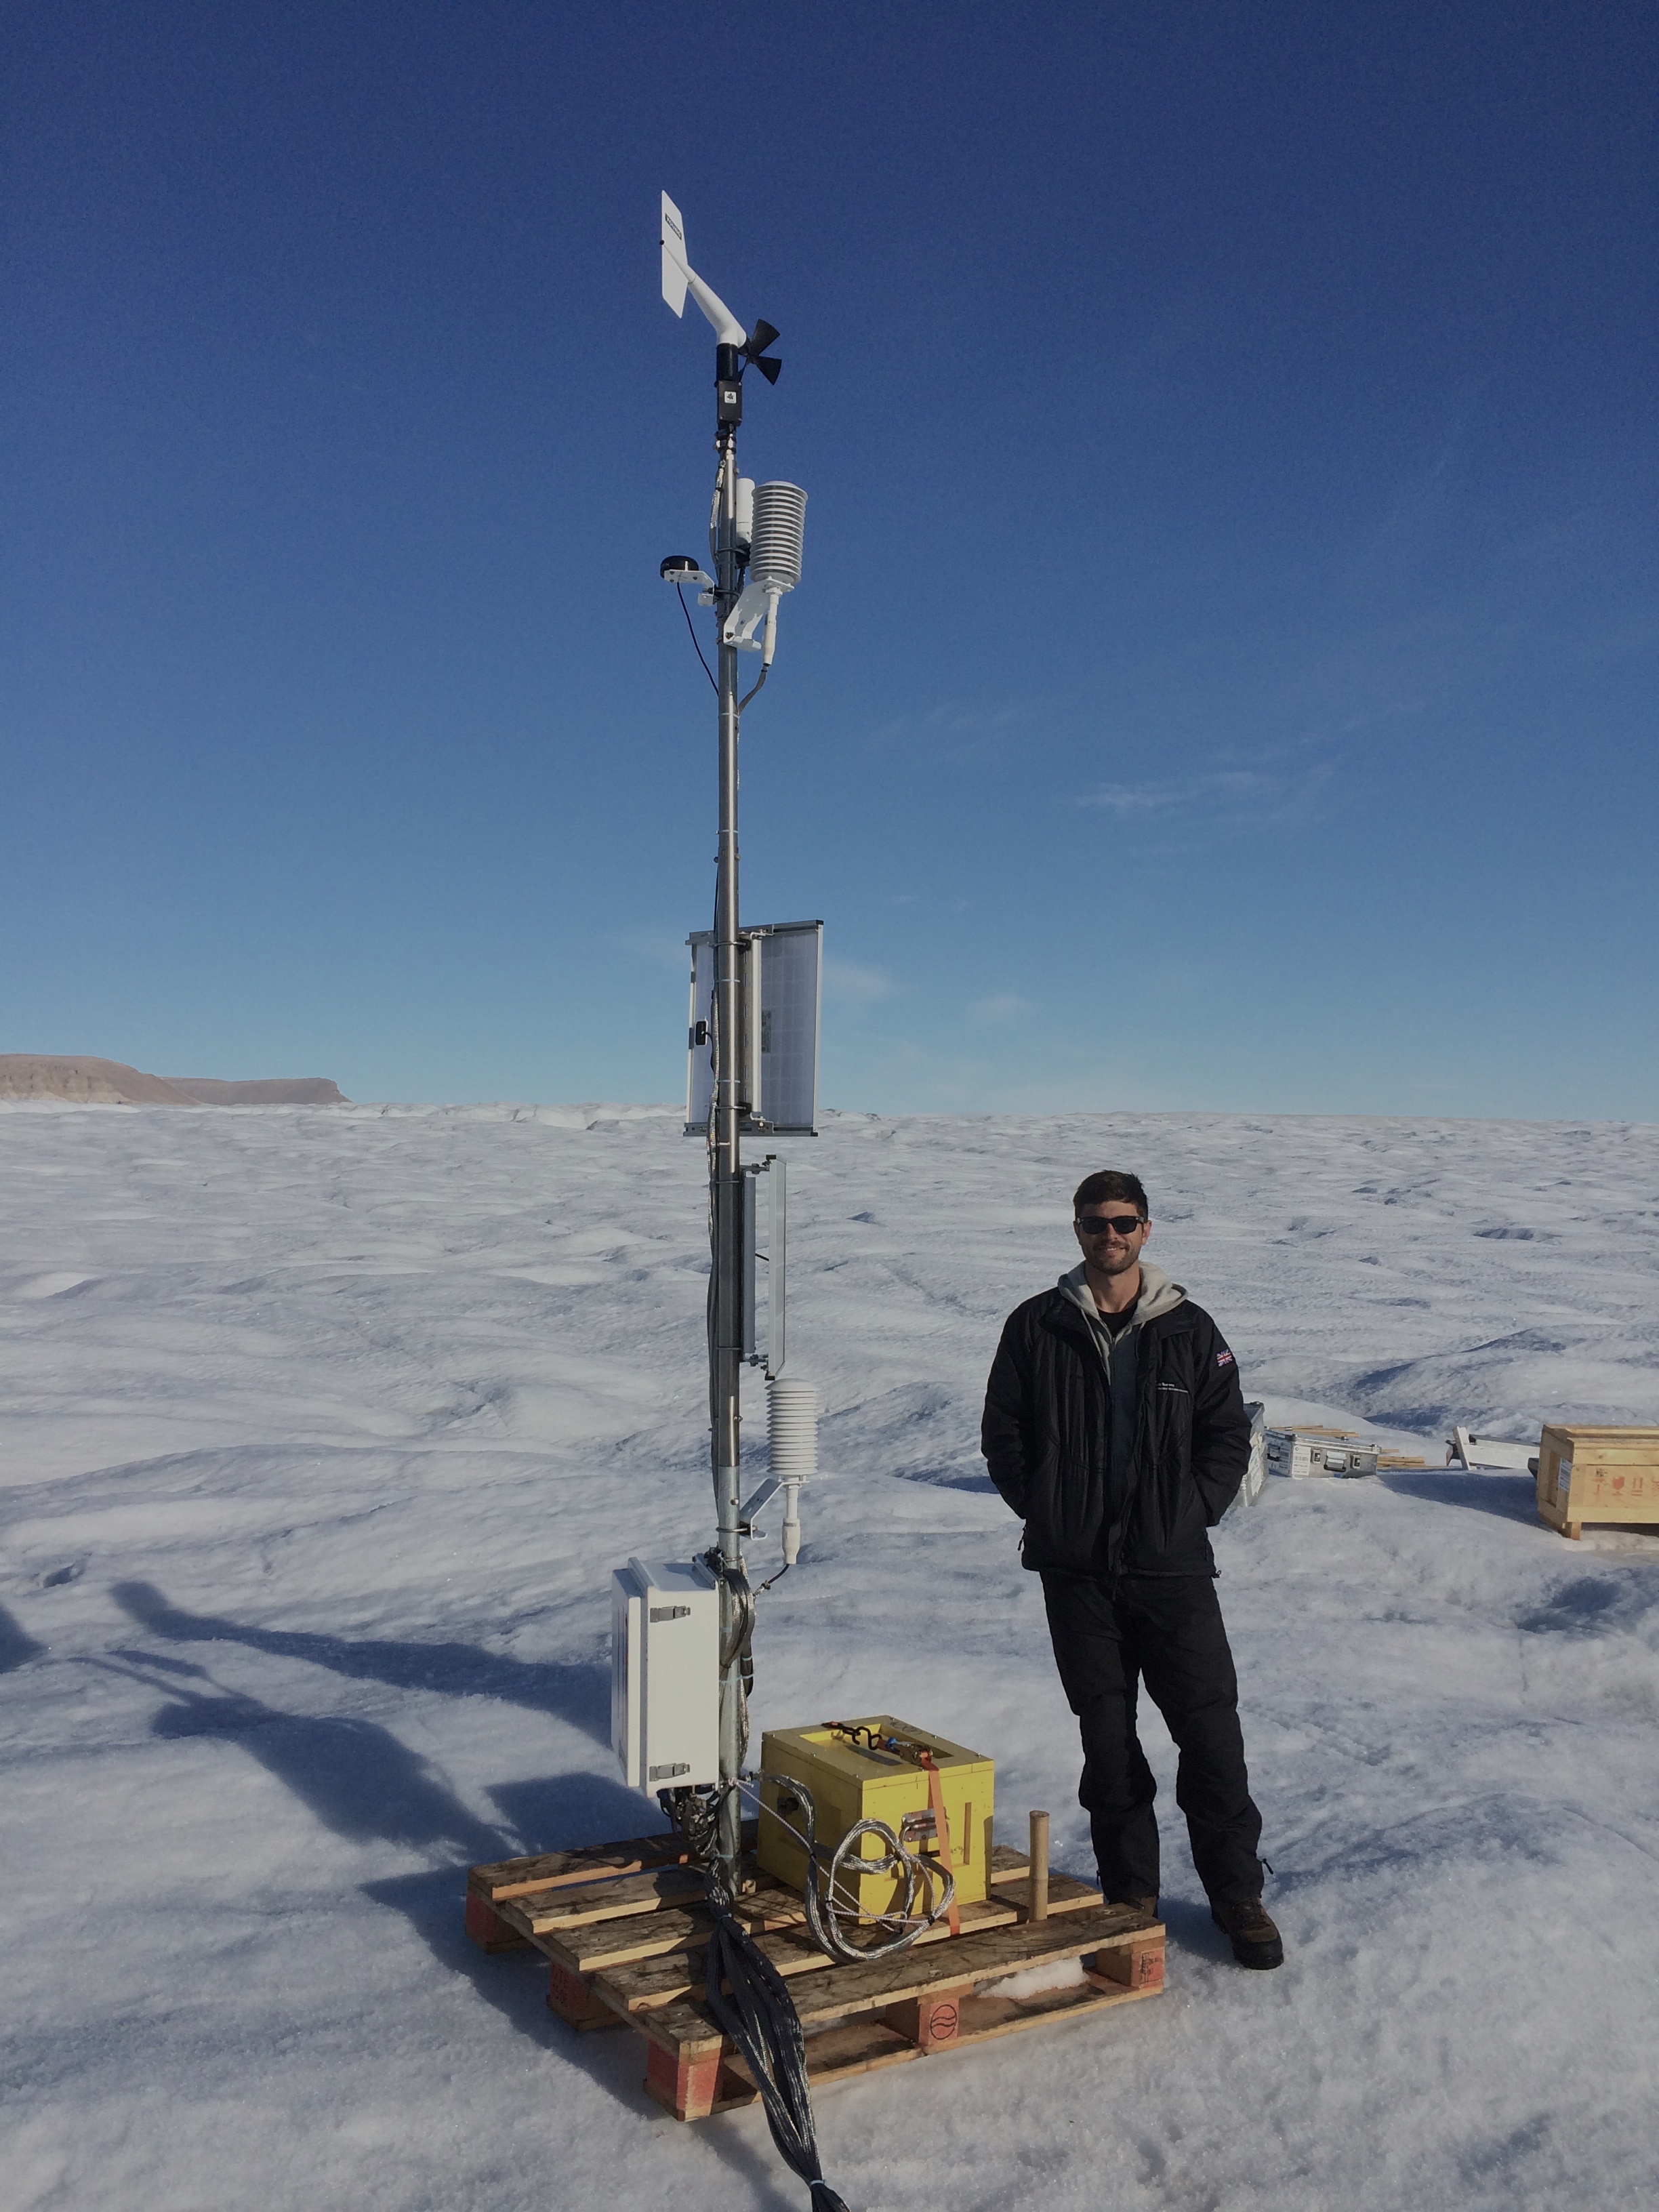
University of Delaware PhD student Peter Washam at the Ocean-Weather station on Petermann Gletscher after final installation 2015-Aug.-20, 17:00 UTC at 80 39.9697 N and 60 29.7135 W.
It all started when a French PhD student approached me at a scientific meeting in San Francisco last December. Céline is a now a doctor of oceanography, but at the time she was not. At the meeting Dr. Céline Heuzé of the University of Gothenburg in Sweden asked me for data and insights on how the ocean circulation in Nares Strait worked, so that she could connect results from planned field work in northern Greenland to her science interests in the Labrador Sea more than 1000 miles to the south. She also introduced me to Dr. Anna Wåhlin and the three of us got very excited about Petermann Fjord, Sweden, and polar oceanography. Here we are in Sweden preparing and off Greenland working:


A few weeks prior the US government and Sweden had just agreed to work together on a joint expedition to Petermann Fjord in northern Greenland. Friends at Oregon State University needed a ship to collect data with which to reconstruct and understand changes of the land- sea-, and ice-scape of North Greenland during the last 10,000 to 50,000 years. They wanted to uncover where past glaciers were located and where sea level was at that time. For this, they needed many sediment cores from the adjacent ocean, fjord, and below the floating glacier. Today this glacier is as thick as the Empire State Building in Manhattan is high. The British Antarctic Survey (BAS) agreed to drill the holes, collect the sediment samples, and take a profile of ocean properties from below the glacier ice to the bottom of the ocean. They estimated it would take about 5 days to drill each hole. Our idea was to use these holes to keep sensors, computers, and satellite phones in place to collect hourly data into the future as long as possible … 100 days so far.


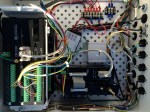
After the Dec.-2014 San Francisco meeting we decided to use these holes to measure ocean temperature, salinity, and pressure for as long as the batteries would last, about 3-4 years, but I had neither money, cables, data logging computers, nor satellite phones to do any of this, only the ocean sensors. When I told Keith Nicholls of BAS about the idea and my predicament, he said that he could find some computers and satellite phones from experiments he had done in Antarctica. I then said that I would organize cables, a weather station, and some funds to pay for it.
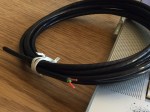
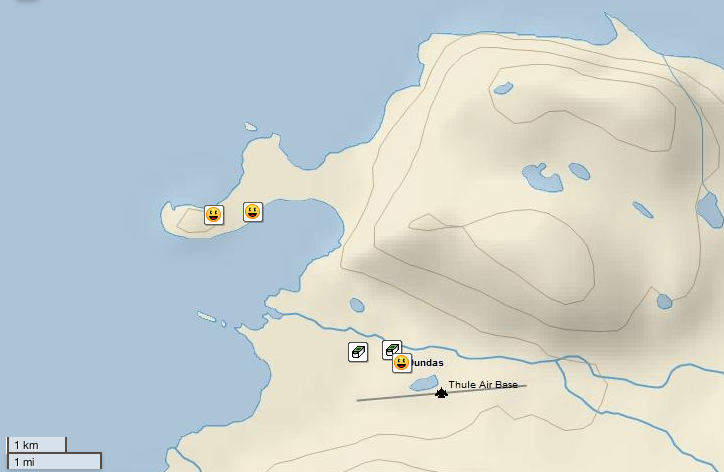
A crowd-funding experiment in February failed to generate funds, but NASA came to the rescue by opening a way to compete for the needed $60,000 to cover the cost of hardware, travel, and satellite phone charges. The funds allowed us to ship about 1200 pounds of gear from Delaware to Sweden where it had to be loaded onto the ship in May of 2015. We did not have much time to built the system and had no time left to test it. Two drums of cable arrived with only 5 hours to spare before the ship left Sweden in June for Greenland. We met the ship in Thule, Greenland in July.


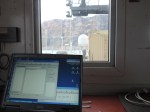
Fast-forward to the 20th of August 2015 when our ocean observing system went into the salty ocean waters below Petermann Gletscher. The surface weather station with satellite connections was deployed 10 days earlier to test satellite communications and collect weather data for Oden’s extensive helicopter flight operations on and around the glacier. It included a rushed visit by a large team from CBS News 60 Minutes who were flown and shown all over the place. We last saw the station during 24 hours of day light on 27th August when we calibrated the wind sensors, but to me the daily satellite phone call of the station with new data is a sign of life from an ocean outpost that survived another day in the total darkness of the polar night. It draws energy from two car batteries that run even at the -36 degree Centigrade (-33 F).
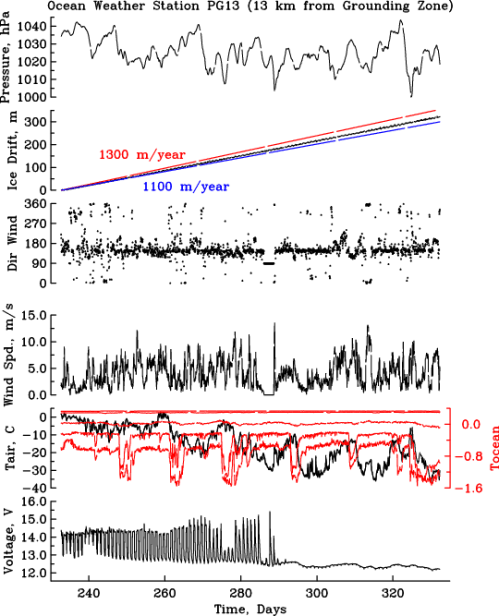
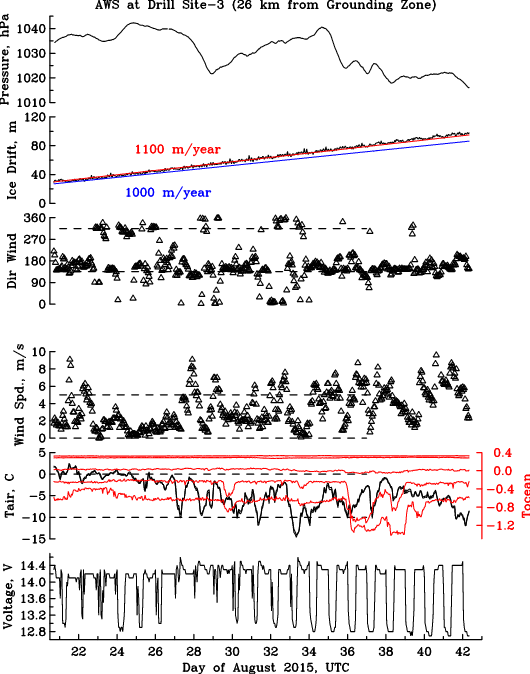
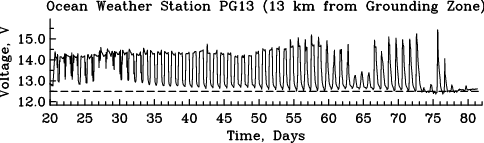
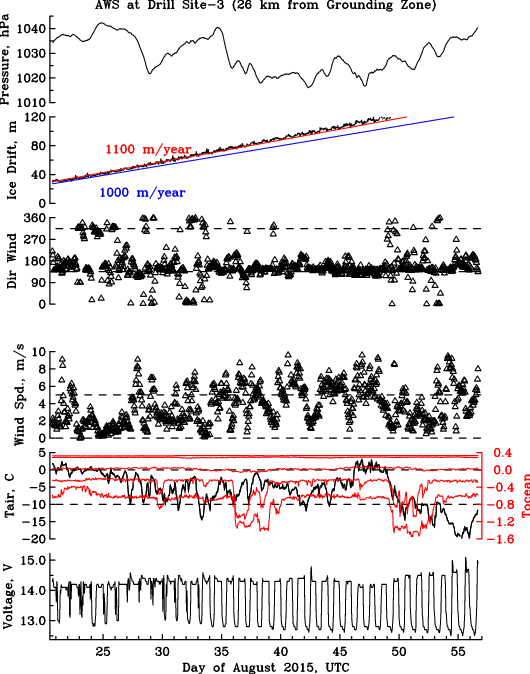
First 100 days of ocean and weather observations from the University of Delaware Ocean Weather Station on Petermann Gletscher, Greenland. Panels show (from bottom to top) time series of 1. battery voltage, 2. ocean (red) and air (black) temperatures, 3. wind speed, 4. wind direction, 5. glacier movement, and 6. atmospheric pressure. Time is given in year-day, Nov.-28 is Day-332. The sun set on Day-290 or Oct.-17.
New data are posted at
which over the next few weeks we will develop into a web-site to distribute the daily observations to everyone. I am most thankful to many of scientists, engineers, technicians, sailors, and women in England, Sweden, and the United States of America, but this Thanks-Giving weekend I am grateful to the men and women of a great nation that gave me a place to study, work, and live doing while exploring ocean and now glacier physics as well.
EDIT: I just discovered this 7 minute video on our expedition, credits go to Saskia Madlener at 77th Parallel Productions:

![University of Delaware Ocean-Weather station on Petermann Glacier with the hot-water drilling team UDel and British Antarctic Survey after deployment Aug.-20, 2015 [Credit: Peter Washam, UDel]](https://icyseas.org/wp-content/uploads/2015/09/udel-aows_3052.jpg)


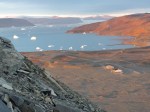
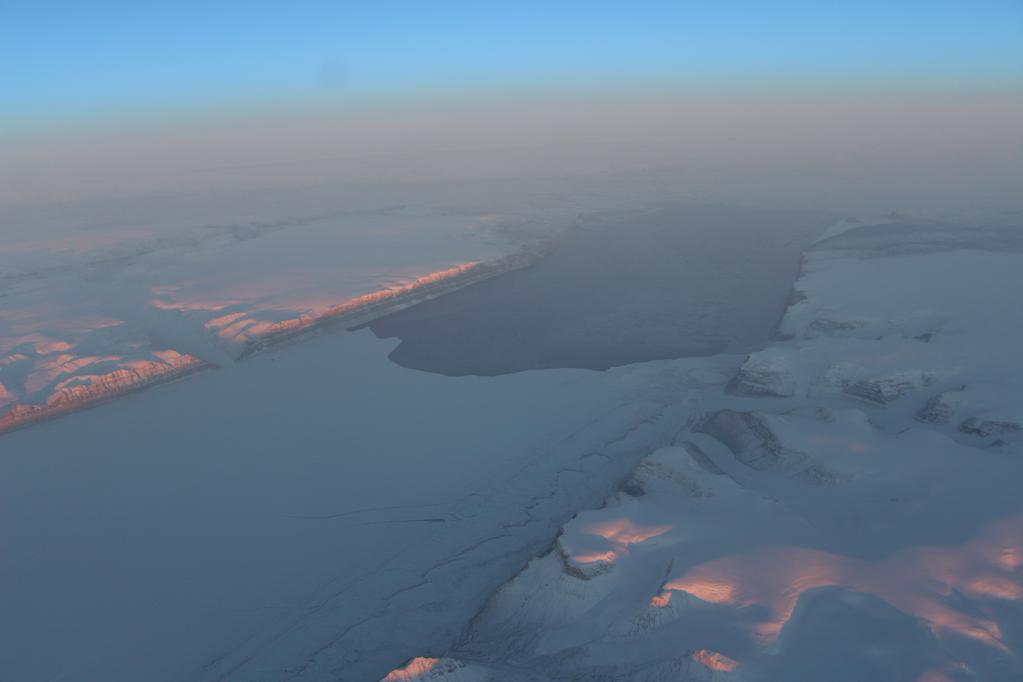
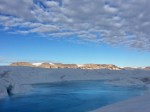
![Panoramic view of the ocean-weather station on Petermann Gletscher. View is towards the south-east with Washington Land in the background. [Photo credit: Peter Washam].](https://icyseas.org/wp-content/uploads/2015/09/img_3037.jpg)