
Two large calving events in 2010 and 2012 reduced the floating part of Petermann Gletscher by 44 km (28 miles) in length, 6 Manhattans (380 km^2) in area, and 42 gigatons in mass. But what’s a gigaton? Writing in The Atlantic Magazine, Julio Friedman states that if we put all people living on earth onto a scale, then we will get half a gigaton. So, Petermann’s two ice island weigh more than eighty times as all humanity combined. As a reminder, this is what the break-ups looked like:
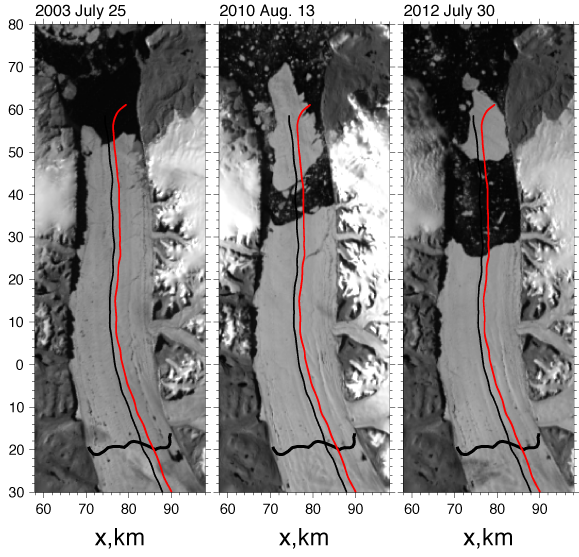
Petermann Gletscher in 2003, 2010, and 2012 from MODIS Terra in rotated co-ordinate system with repeat NASA aircraft overflight tracks flown in 2002, 2003, 2007, and 2010. Thick black line across the glacier near y = -20 km is the grounding line location from Rignot and Steffen (2008).
It turns out that the smaller 2012 ice island is just as heavy as the 2010 island, because it is much thicker, about 200 m, 600 feet, or half the height of the Empire State Building in Manhattan. These thick and thin islands have since left Petermann Fjord and Nares Strait for more southern climes. The thinnest piece reached Newfoundland in the summer of 2011 where it melted away. Most of the thicker, larger, and heavier ice islands from Petermann and Ryder Glaciers now litter almost the entire eastern seaboard of Canada as the two largest pieces have split, broken, and splintered into many smaller pieces. Each of these still represents an exceptionally large and dangereous piece of ice that can wipe any offshore oil platform off its foundation. Luc Desjardins of the Canadian Ice Service now tracks more than 40 segments, some still bigger than Manhattan, some as small as a football field. The distribution along the 1500 km (1000 miles) of coast is staggering:
![RadarSat imagery of eastern Baffin Island (bottom, right), western Greenland (top, right), and Nares Strait with Petermann Fjord (top, left) with pieces of Petermann and Ryder Ice Islands identified. [Credit: Luc Lesjardins, Canadian Ice Service]](https://icyseas.org/wp-content/uploads/2013/01/ice-island-overview-25-27-jan-2013.jpg)
RadarSat imagery of eastern Baffin Island (bottom, right), western Greenland (top, right), and Nares Strait with Petermann Fjord (top, left) with pieces of Petermann and Ryder Ice Islands identified as green dots. [Credit: Luc Lesjardins, Canadian Ice Service]
What stands out is that most pieces are close to the coast of Canada. This is expected, because often the ocean moves in ways to balance pressure gradient and Coriolis forces as we live on an earth that rotates once every day around its axis. This force balance holds both in the ocean and the atmosphere. We are all familiar with winds around a low-pressure system such as Hurricane Sandy where the winds move air counter-clockwise around the eye (the center of low pressure). This eye of low pressure in our ocean story is permanently near the center of Baffin Bay. Ocean currents then move water counter-clockwise around this eye. This results in a flow to the south off Canada and a flow to the north off Greenland. On a smaller scale this balance holds also, such as Delaware Bay or Petermann Fjord, but I will not bore you with the details of graduate level physics of fluids in motions … as important as they may be.
So, almost all the ice islands we see in the above imagery will make their way further south towards the Grand Banks off Newfoundland. Some are grounded to the bottom of the shallow coastal ocean and may sit in place for a year, or a month, or until the next high tide will lift the ice off the bottom and move it back into deeper water. Some ice islands will keep moving rapidly, some will further break apart, but none will go away anytime soon. If you want to see some of Petermann’s Ice Islands for yourself, take the ferry from North Sidney, Nova Scotia to Port aux Basques, Newfoundland and Labrador and head for the Great Northern Peninsula. That’s what I hope to do one of the next summers.
![]()
Johnson, H., Münchow, A., Falkner, K., & Melling, H. (2011). Ocean circulation and properties in Petermann Fjord, Greenland Journal of Geophysical Research, 116 (C1) DOI: 10.1029/2010JC006519
Münchow, A., & Garvine, R. (1993). Dynamical properties of a buoyancy-driven coastal current Journal of Geophysical Research, 98 (C11) DOI: 10.1029/93JC02112
Rignot, E., & Steffen, K. (2008). Channelized bottom melting and stability of floating ice shelves Geophysical Research Letters, 35 (2) DOI: 10.1029/2007GL031765


