The currents and winds of Nares Strait

[Editor’s Note: Undergraduate Allison Einolf of Macalester College in Minnesota summarizes her work at the University of Delaware that was supervised by Andreas Muenchow as part of an NSF-funded summer internship.]

I’m about to fly to Thule, Greenland for a research expedition into the Nares Strait. We had planed to survey Petermann Fjord, but our proposed cruise track is facing an obstacle twice the size of Manhattan.

We’re heading up north to pick up instruments that have recorded current velocities, salinity, temperature, and ice thickness in Nares Strait since 2009. I’ve been working all summer on data retrieved on a similar cruise three years ago, focusing on what effects the ice arches have on currents north of the ice arches.

Nares Strait MODIS satellite imagery of the study area and ice arch April 21, 2008. Red dots are instrument locations. Arrows show current velocities.

Nares Strait MODIS satellite imagery of the study area and ice arch April 22, 2009. Red dots are instrument locations. Arrows show current velocities. Note the lack of the southern ice arch, but the presence of one north of the study area.

Continue reading

Record Warming and Melting of Greenland

These are admittedly daily data, and yes, it is warm in summer everywhere, and yes, when it is warm, snow and ice melt at the surface. Here is the latest image of Greenland’s warming and melting that I lifted (figure and caption) straight from today’s NASA release:

Extent of surface melt over Greenland’s ice sheet on July 8, 2012 (left) and July 12, 2012 (right). Measurements from three satellites showed that on July 8, about 40 percent of the ice sheet had undergone thawing at or near the surface. In just a few days, the melting had dramatically accelerated and an estimated 97 percent of the ice sheet surface had thawed by July 12. In the image, the areas classified as “probable melt” (light pink) correspond to those sites where at least one satellite detected surface melting. The areas classified as “melt” (dark pink) correspond to sites where two or three satellites detected surface melting. Image credit: Jesse Allen, NASA Earth Observatory and Nicolo E. DiGirolamo, SSAI and Cryospheric Sciences Laboratory


Continue reading

Oceanography of Petermann Fjord and Glacier Melting

Trudy Wohlleben just send a group of scientists in Denmark, England, Canada, and the US the latest RADARSAT image of the ice island that formed in Petermann Glacier earlier this week.

RadarSat Image of Petermann Ice Island (PII-2012) and Glacier kindly provided by Trudy Wohlleben, Canadian Ice Service. The location of the hinge line is approximate only.

The current position of the remaining ice shelf of Petermann Glacier is the farthest landward since recorded observations. Dr. Croppinger was the first to provide a map of the glacier Continue reading

Manhattan and Petermann Glacier: Physical and Mental Space

Front of Petermann Glacier 2009 from the CCGS Henry Larsen. [Photo Credit: Pete Davis, Oxford University]

Bob Collins writes with wit and eloquence at Minnesota Public Radio about Petermann Glacier and Manhattan:

Why is it always about you, New York?

This week an iceberg “twice the size of Manhattan” broke off from Greenland’s Petermann Glacier.

What else is twice the size of Manhattan? Just about everywhere else. Manhattan is tiny at only 22 square miles. Manhattan isn’t even the size of Woodbury.

You know what’s bigger than the iceberg? Minneapolis. It’s 53 square miles. But “an iceberg that would easily fit into the boundaries of Minneapolis” (and you, too, Saint Paul) doesn’t quite cut it in the drama department.

Why use Manhattan as the measure of size? Because it suggests something is huge that is not, in fact, as huge as we’re led to believe. We think of Manhattan as big because of the size of the buildings there and the number of people there. The iceberg actually would’ve fit nicely into the Bronx. But people don’t think of the Bronx as huge.

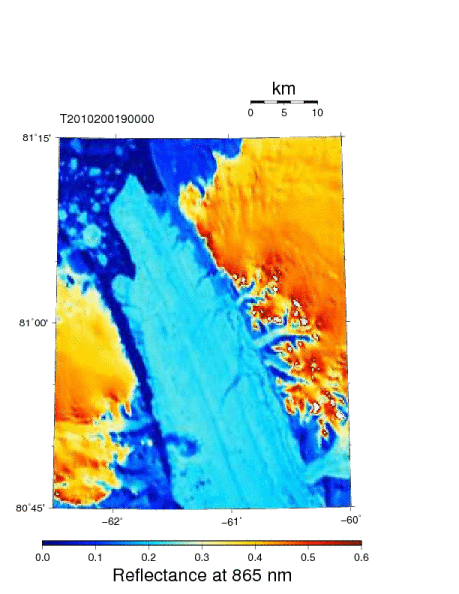
This blog, Icy Seas, compares the entire area to the number of Manhattans. But it brings up an important point that a collapsing iceberg the size of Minneapolis obscures: Most of the melting of glaciers is occurring from below.

I agree. Manhattan is tiny, I walked its streets. But do not all numbers and measures contain or evoke emotions? Drudgery is one, drama another. Stay with me for an example: the color red is a wave that is 0.000000645 meters (=645 nanometers or nm) long. What comes to mind, when I talk about reflectances at 645 nm? Nothing or just a blank stare, perhaps? But if I say “RED,” we may engage and argue. Yet 645 nm is more precise than “red,” because there are many shades of red while there are no such shades of 645 nm. Furthermore, red triggers emotions: just ask a Red Sox fan.

Manhattan is a huge place in my mind, just as Bob Collins says it is. For me it is not the height of buildings or the number of people, but it is Manhattan’s tapestry of world cultures, skin colors, styles of clothing, languages, foods, and histories made anew each day. It is all in our minds, it is a symbol. More people can relate to Manhattan better than they can relate to 58 square kilometers. Most people can relate to the color RED with its dramatic emotions, but few can relate to 645 nm with its precise physics. There is beauty in both.

Shades of red and blues … Vincent Van Gough.

Petermann Glacier, Ice Islands, and Changing Climate

Petermann Glacier is a tidewater glacier in the remote north-west of Greenland. The glacier is grounded at about 600-m below sea level. It has calved two large ice islands, a 4-Manhattan sized island in 2010 and a 2-Manhattan sized one in 2012. These losses cover much of the area shown in this 2009 photo:

Eastern wall of Petermann Fjord as seen from CCGS Henry Larsen’s helicopter in August 2009 with the floating ice shelf. Most of the visible ice shelf has been lost during the 2010 and 2012 calving events. [Photo Credit: David Riedel, British Columbia.]

From selected imagery, I created a short movie (0.7 MB) which shows (a) the 2010 calving, (b) the advance of the new front in 2011 and early 2012, and (c) the 2012 calving. The glacier has moved at a rate of about Continue reading