
Not sure why, but this 1929 photo of two young scientists working off Greenland has been in my mind for the last 3 days. It shows a 23-year old graduate student of Anthropology from Columbia University, Frederica de Laguna, with one of her mentors, Archaeologist Dr. Therkel Mathiassen from Denmark. They were digging near Upernavik, Greenland for evidence of long-lost people living in north-west Greenland. It changed the life of Frederica de Laguna, the graduate student, as this summer in Greenland revealed the deep passion that she lived for 75 years after this photo was taken: Arctic Anthropology, the study of people, places, cultures. To me the photo shows an exuberant, yet relaxed and deep happiness after tiresome, yet immensely fulfilling work.
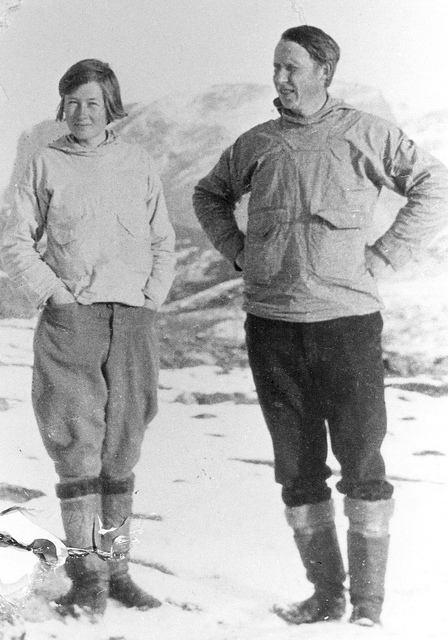
Frederica de Laguna with Therkel Mathiassen in 1929 near Upernavik, Greenland. [From Bryn Mawr College’s Collections]
My strange obsession with Frederica de Laguna relates to convergent story lines that I am still trying to untangle. Her advisor at Columbia was Franz Boas who as a German physicist lived on southern Baffin Island during the First International Polar Year 1883/84 to study “everything” that he saw and experienced around Cumberland Sound which was a northern base for the whaling industry. His description of a massive iceberg is so detailed, that I feel comfortable to conclude, that he describes an ice island from Petermann Glacier about 1600 miles to the north. After his Arctic field work he emigrated to New York to become one of the founders of American Anthropology in the 20th century. Frederica de Laguna was one of his last graduate students, receiving her PhD in 1933 while digging in Alaska.
![Inuit women and children visiting the Hans Egede in Greenland in 1930. [From Cambridge University]](https://icyseas.org/wp-content/uploads/2013/03/hansegede1930.jpg)
Inuit women and children visiting the Hans Egede in Greenland in 1930. [From Cambridge University]
It took Frederica and her companion 18 days to sail from Copenhagen, Denmark to Upernavik, Greenland aboard the Hans Egede. Two of her sailing companions, a Dr. Krueger from Germany and his assistant Age Rose Bjare of Denmark were planing to explore the geology of Ellesmere Island and areas to the west of it in northern Canada and disappeared. In her autobiography she writes succinctly: “I don’t like Dr. Krueger. He thinks too much of himself.” This sentiment is also reflected by the Canadian police officer who described him as a “punk outfit and a badly overloaded sledge.” Her return sail she shared with Dr. Alfred Wegener, a German geophysicist and his group returning from initial explorations of Disko Bay, Greenland testing the first snowmobiles for a larger expedition to take place the following year in 1930. They probably provided one of the first descriptions of Jacobshavn Isbrae, a fast-moving Greenland outlet glacier. In 1929 it still had a substantial ice-shelf that disintegrated the last 15 years and is lost to history.
![The evolution of Jacobshavn Isbrae retreat from 1851 through present. [From NASA's Earth Observatory]](https://icyseas.org/wp-content/uploads/2013/03/jakobshavn_retreat-1851-2006.jpg)
The evolution of Jacobshavn Isbrae retreat from 1851 through present. [From NASA’s Earth Observatory]
Alfred Wegener lost his life the following year when he tried to rescue companions who maintained a weather station on Greenland’s ice-sheet. His largest scientific contribution was the idea, that continents move, that North-America, Greenland, and Europe once connected, perhaps, and had drifted apart over the millenia. Since he did not have a physical mechanism detailed, it took oceanographers another 50 years to sort that part out, Wegner’s idea of continents adrift was ridiculed by the establishment at the time and eventually forgotten. It took another 30-40 years for it to revolutionize geology as a dynamic discipline. Plate tectonics is the standard now that explains earthquakes, vulcanoes, and much more. It perhaps did not help Dr. Wegner with the geologists like Dr. Krueger, that he was trained in physics, as was Dr. Boas, the advisor of the now renowned Arctic anthropologist Francisca de Laguna of Bryn Mawr College in Pennsylvania.
The observant reader will notice how many Germans are in this set of story lines. Franz Boas was Jewish and thrived,in the Americas, Hans Krueger was a pompous idiot who disappeared, and Alfred Wegener was a tragic hero. All were German scientists, all converged with Frederica de Laguna in 1929 just when she emerged as a powerful mind of her own as a young graduate student in a field dominated by men. When Germany invaded Poland and France 10 years later, Dr. Frederica de Laguna was teaching her passions at Bryn Mawr College outside Philadelphia. When the war came to America, she asked for a leave of absence to serve in Naval Intelligence where she became a Lieutenant Commander. Her superiors at Bryn Mawr considered this a waste of her time, but she disagreed, and so do I. It is the many personal choices we make, both small and large, that form our personal histories, our science, our selves, and the larger history that we all live … [to be continued]
Davis, R. (2006). Frederica de Laguna of Bryn Mawr College Arctic Anthropology, 43 (2), 21-27 DOI: 10.1353/arc.2011.0075
VanStone, J., & de Laguna, F. (1980). Voyage to Greenland: A Personal Initiation into Anthropology Ethnohistory, 27 (2) DOI: 10.2307/481234
![Fredericade Laguna in 1993 at age 87; she worked until age 98 [From New York Times, photo by Bill Roth, Anchorage Daily News]](https://icyseas.org/wp-content/uploads/2013/03/laguna184.jpg)
Frederica de Laguna in 1993 at age 87; she worked until age 98. [From New York Times, photo by Bill Roth, Anchorage Daily News]
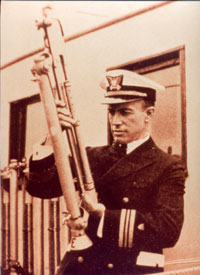
![USCGC Marion built in 1927 [from http://laesser.org/125-wsc/]](https://icyseas.org/wp-content/uploads/2013/03/marion.jpg)
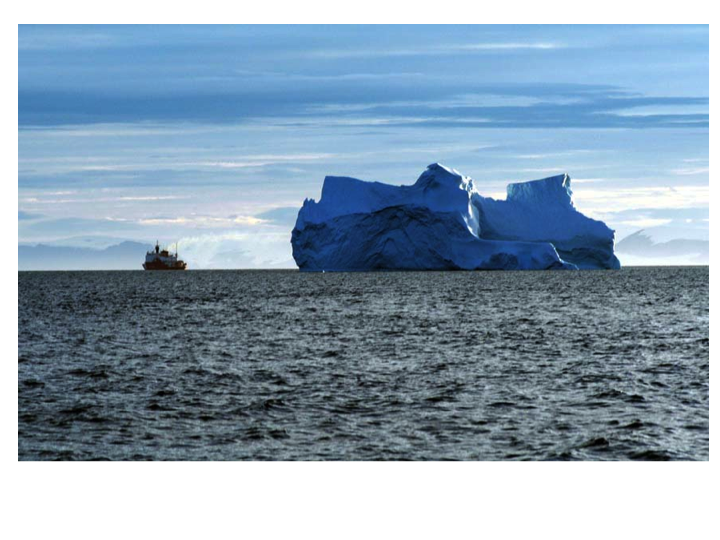
![Iceberg in the fog off Upernarvik, Greenland in July of 2003. [Photo Credit: Andreas Muenchow]](https://icyseas.org/wp-content/uploads/2013/03/helen2003upernarvik.jpg)
![Dr Helen Johnson on acoustic Doppler current profiler (sonar to measure ocean velocity) watch aboard the USCGC Healy in Baffin Bay in 2003. [Photo credit: Andreas Muenchow]](https://icyseas.org/wp-content/uploads/2013/03/helen2003adcp.jpg)
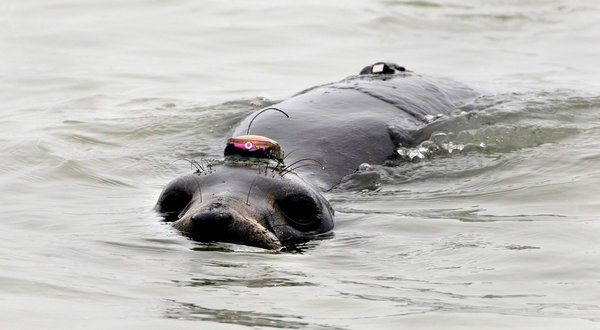
![Elephant seal off Antarctica with ocean sensor transmitting data via satellite [Credit Lars Boehme]](https://icyseas.org/wp-content/uploads/2013/03/seal-one-credit-lars-boehme.jpg)
![CCGS Henry Larsen in thick and multi-year ice of Nares Strait in August 2009. View is to the south with Greenland in the background. [Photo Credit: Dr. Helen Johnson]](https://icyseas.org/wp-content/uploads/2012/06/rimg0129.jpg)

