
#UDel Ocean-Weather station #Greenland on #petermann2015 calls home from 800 m under floating glacier with 2 weeks of new hourly data.
![University of Delaware Ocean-Weather station on Petermann Glacier with the hot-water drilling team UDel and British Antarctic Survey after deployment Aug.-20, 2015 [Credit: Peter Washam, UDel]](https://icyseas.org/wp-content/uploads/2015/09/udel-aows_3052.jpg)
University of Delaware Ocean-Weather station on Petermann Glacier with the hot-water drilling team UDel and British Antarctic Survey after deployment Aug.-20, 2015. Cables from ocean sensors emerge from the ice where the wooden cross is located on the right. [Credit: Peter Washam, UDel]

Map of Greenland’s Petermann Gletscher, Fjord, and adjacent Nares Strait. The UDel Ocean-Weather station is the green dot on the floating ice shelf that does not have a red triangle. Blue dots in the ocean are where we collected ocean data from I/B Oden in August 2015. Green dots are ocean moorings which report via Iridium while red triangles are “fancy” GPS locations we instrumented for 12 days to measure vertical tidal elevations of the glacier.
My nerves are shot and I get depressed when the Ocean-Weather station does not call home when she should. We deployed the station last months on the floating section of Petermann Gletscher where she has moved steadily towards the ocean at about three meters per day. We measure this with GPS which is the black dot next to the temperature sensor above the head of the team that drilled the hole. It connected 5 ocean temperature, salinity, and pressure sensors to 800 meter depth below sea level. The data come from this great depth to the surface where it feeds into the weather station that then transmits data via an Iridium antenna to another Iridium antenna that sits atop my house. Let me run out and take a quick photo of it …
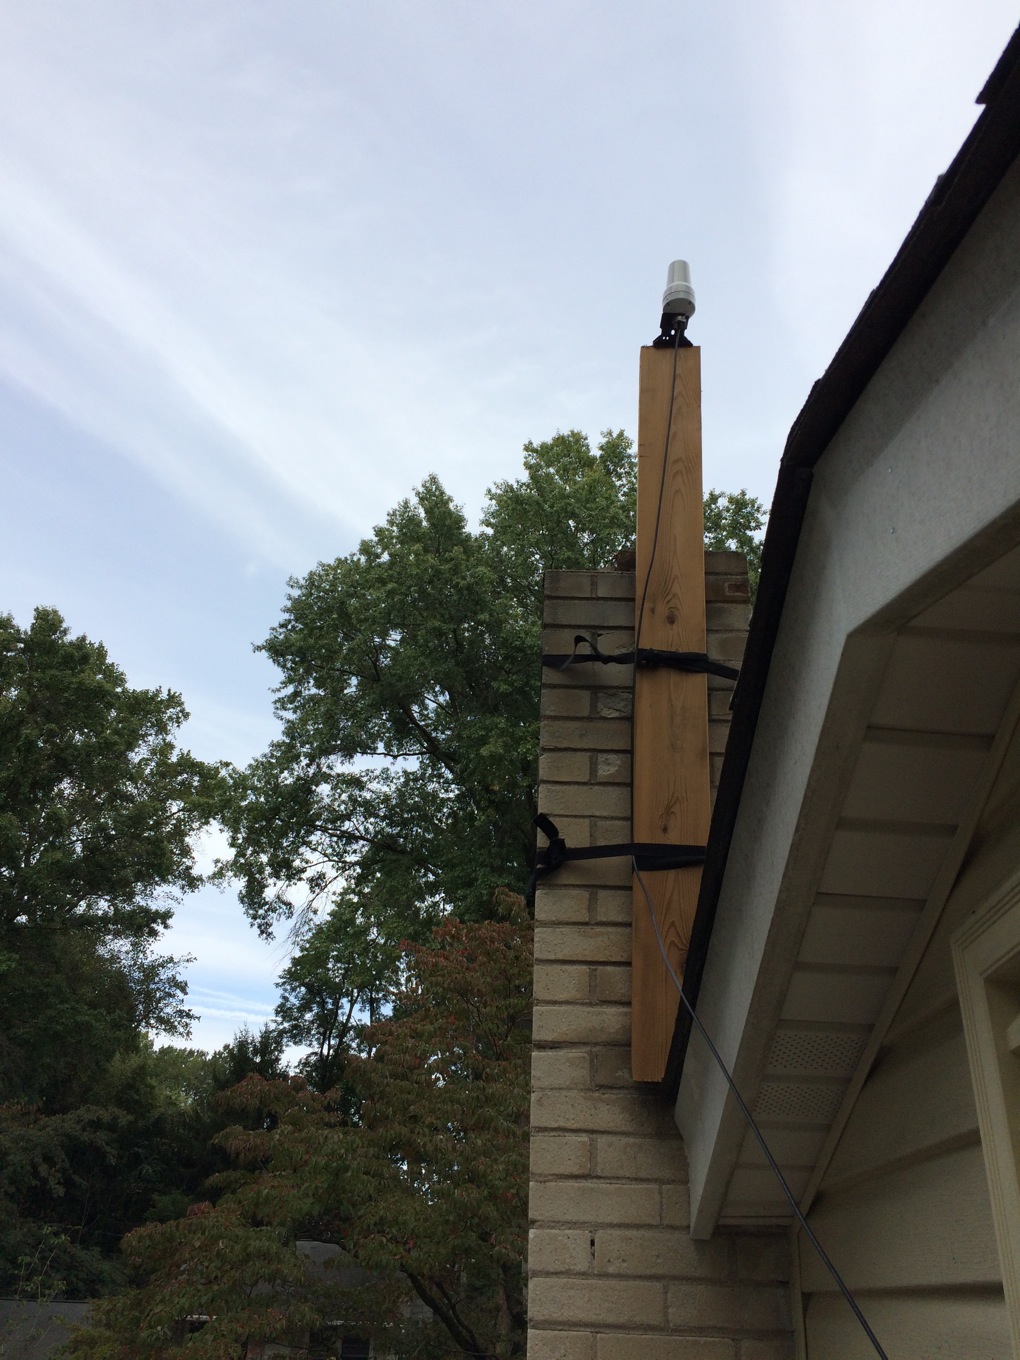
Iridium antenna atop my house in Newark, Delaware that receives data calls from Greenland.
My problem with Iridium over the last 6 weeks has been that its (data) connectivity is spotty. For example, I received no data the last 2 weeks. This has been the longest time with no call and no new data. Designing the system, I decided against the more robust “Short-Burst-Data” SBD text messages. Instead I opted for a truly 2-way serial connection which, if a connection is established, allows more control as well as a more complete and gap-free data stream. The drawback of this serial connection via Iridium is lack of connectivity. Sometimes days or weeks go by without a successful connection even though computer codes are written to connect every 8 hours. I can change that by uploading new codes to the two Campbell CT1000 data loggers that control all sensors as well as data collection and communication via Iridium.
-
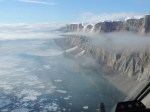
- Areal view of Petermann Fjord and Gletscher in the background on Aug.-10, 2015. View is landward with south-west on the right.
-
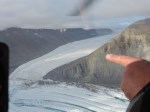
- Faith Glacier discharging into Petermann Glacier about 5 km landward of the terminus of Petermann on Aug.-10, 2015.
-

- View across Petermann Gletscher from west to east near Site-C where we deployed two ocean sensors on Aug.-9, 2015.
Today’s call was the first in two weeks, but it provided a complete data download without ANY gaps in the hourly time series of weather in the atmosphere (wind, temperature, humidity) and weather in the ocean (temperature, salinity, pressure). The ocean data show that about every 2 weeks with the spring-neap cycles, we see very large excursions of colder and fresher water appear at 2 sensors within about 30 meters of the glacier ice. It is too early to speculate on how this may relate to ocean circulation and glacier melting, but the large and frequent up and down do suggest a lot of ocean weather.
I am anxiously awaiting the next data call in about 5 hours to get the 8 hours of data. Wish me luck and a healthy Iridium satellite system where calls are about $0.90/minute. Today’s call took 5 minutes. This is what some of the (uncalibrated) data look like:
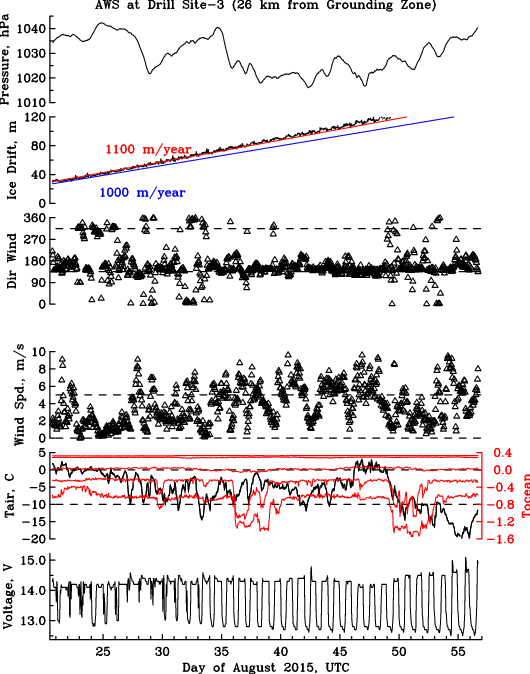
Ocean-Weather station data from Aug.-20 through Sept.-25 (today). Ocean temperatures at 5 vertical levels are shown as 5 red curves in 5th panel from top. The black lines in that panel are air temperatures that reached -20 C this week.


I also had this in the past when my Commodore 64 wouldn’t load the game. 😉
But somewhat more seriously: how much data/time will it take for you to become more relaxed about this? In other words: How long do you expect/hope this nifty system will work?
You’ve probably already written it somewhere, but my memory isn’t what it used to be (if I remember correctly). What I haven’t forgotten though, is how cool all of this is!
Neven: You are ahead of me with computer generations as I only started on a VAX in 1985 in Bangor, Wales. My first piece of code was calculate and predict the sealevel change that a tidal wave passing through a channel would cause in a boat basin.
Answering your question, I think the system should report for 3 years or more, but this is all so new to me and the number of possible mistakes to make appear infinite. I wreck my brain every day which connection or which cable I may have wired wrongly.
The main problem will be the melting of the icy “ground” from below the station. Our pole is about 2 meters into the ice, but the glacier may melt this much from the surface, potentially, in a year. This will not happen until May/June next year when the short surface melt season starts. I may relax when the station makes it through the darkness of winter. Once the sun sets next year in March, the 40 W solar panels will very quickly recharge batteries … actually, the station has run on solar power almost exclusively until about now.
UDel Ocean-Weather Station, please remember to call your Daddy. He misses you.
Susan:
Very much indeed … we even nick-named the station “Irene” after that infamous Leda Belly song with the refrain “Irene, Good night, Irene, good night Irene, I get you in my dreams …”
Now you know how the New Horizons designers felt. Perhaps you could start your own combined support group, Scientists That Have Lost Their Sensors. 🙂
Thorsaurus:
If you refer to the NASA space mission to Pluto and beyond, well, did they not have to wait several years to see if their sensors were sensing and talking? Maybe I join their support group for “Lost Sensors,” too.
About 9 years I believe, and then just about a week before the flyby they had a glitch where the probe was non-responsive for hours. It was eventually remedied but boy, those people must have been gripping and losing sleep for a day or two.
Pingback: Petermann Gletscher Ocean Station Revisited | Icy Seas