I thought it silly when my wife suggested to go geocaching with her. She told me it was to hunt for treasures and as a professor of physical ocean science and engineering this was not for me. But my wife is persistent, I am curious, and when she explained that a GPS, hiking, and computer mapping was involved, I gave it a try and have been hooked ever since. My first geocaching hiking trip took place on Anacortes Island, Washington in 2013 where our youngest son then lived. Here we are walking past rock carved 10,000 years ago by a tiny glacier at N 48° 29.498 W 122° 41.799 N that discharged ice into Puget Sound:
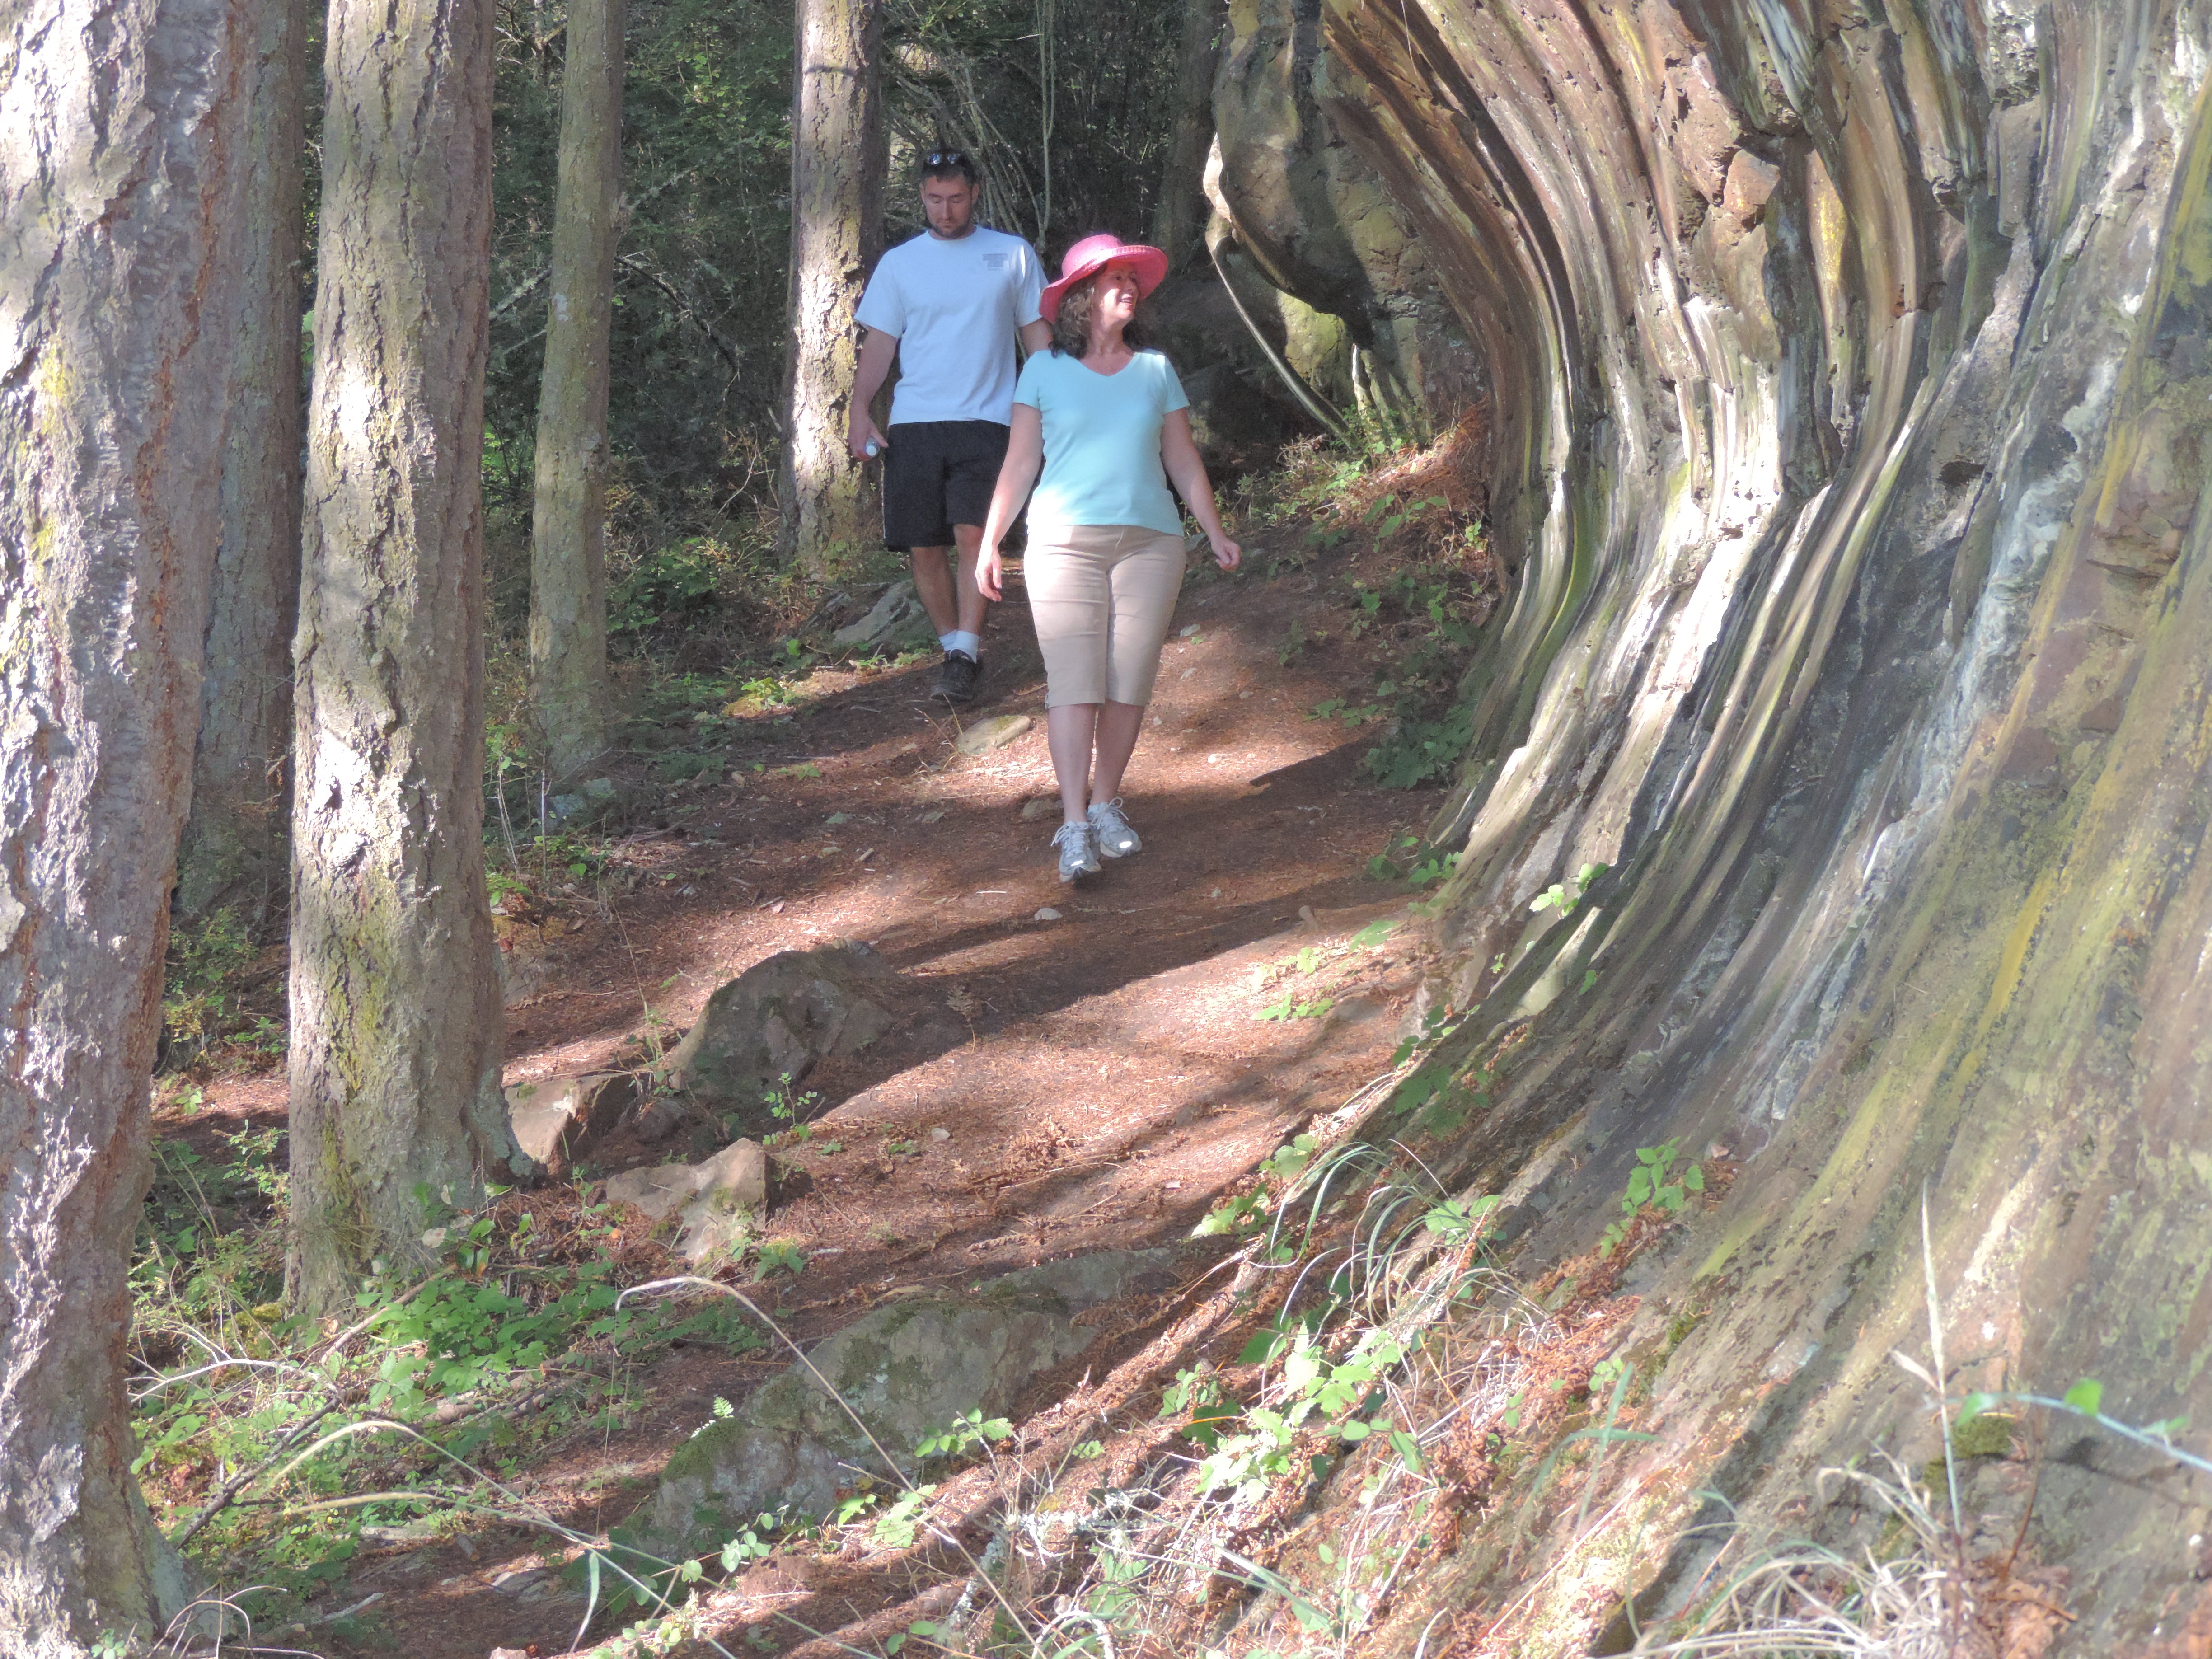
Glacier carved outcrop in Washington Park, Anacortes Island, WA.
Since this first geocaching trip, I have found more than 200 geocaches in places small and remote and places large and urban. The treasure is in the walking and trying to find a path towards a destination, but the destination is secondary as many discoveries are made along the way.
This often happens in science also. One needs to know a destination, have a goal, formulate a hypothesis, but much science, learning, and discovering happens along the path towards that goal. With a GPS the destination is easy, it is a fixed point on earth, but it is harder in science. It can be useful to roam widely, but a set of intermediate goals can help to stay focused. For example, I want to understand how Greenland will change as we warm the earth. That’s a big question with impacts on floods in Europe, storms in the Americas, and rising sea level everywhere. This is a 100-year problem that many people work on; so my personal goal is to focus on how the oceans melt glaciers from below. This is a 10-year problem. It is a step towards the larger goal, but 10 years is still long even though I work with people in Germany, Canada, Denmark, England, Sweden, and Norway:

View to the south on the decent from Tromsdalstinen on a geocaching trip in 2014 out of Tromso, Norway.
The photo above was made during one of my geocaching trip in northern Norway. Three physical oceanographers had gotten off the ship after they deployed ocean current measuring devices off eastern Greenland near a larger ice sheet. The experiment was designed to measure the ocean heat and its movement towards two large outlet glaciers. One has a wide and stable floating ice shelf, Nioghalvfjerdsfjorden (79N Glacier) while Zachariae Isstrom a few miles south lost its wide, long, and apparently unstable ice shelf that still shows in this 2002 image:

North-East Greenland in 2002 when both 79N Glacier (near 79 30′) and Zachariae Isstrom (near 79 00′) had extensive ice shelves (black areas are open ocean).
It puzzles me how two adjacent glaciers can and do behave so differently. If we understand how Greenland is melting, then we should explain the difference convincingly, but I am still looking for people who can. Lots of theories, lots of ideas, and lots of modeling, but there are not many observations to make the skimpy and often contradictory evidence convincing. And this finally leads me to my last point and the goal that I set for myself for the next 5-10 years:
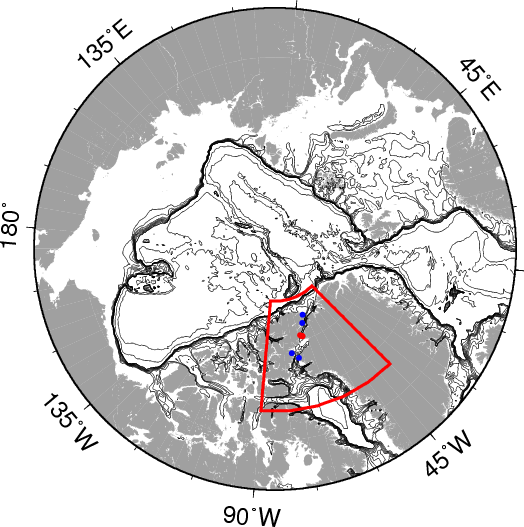
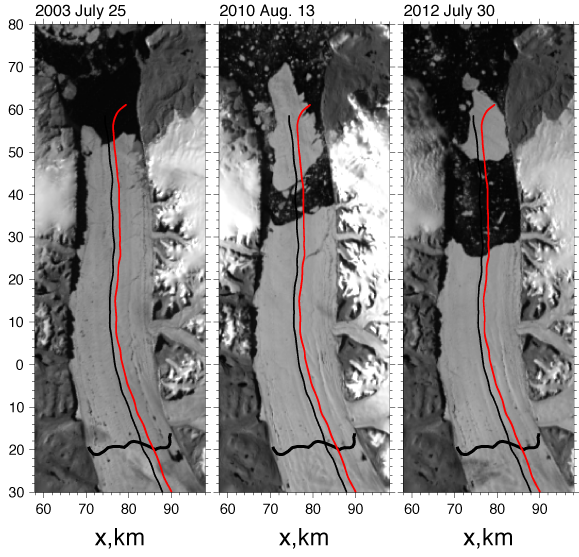
I like to measure the ocean, the ice, and the air above and below floating glaciers via a small network of sensors. Now that two large ice islands spawned at Petermann Gletscher in 2010 and 2012, I believe that the remaining ice shelf will stay largely put for the next few years, that is, move at 1 km per year towards Nares Strait:
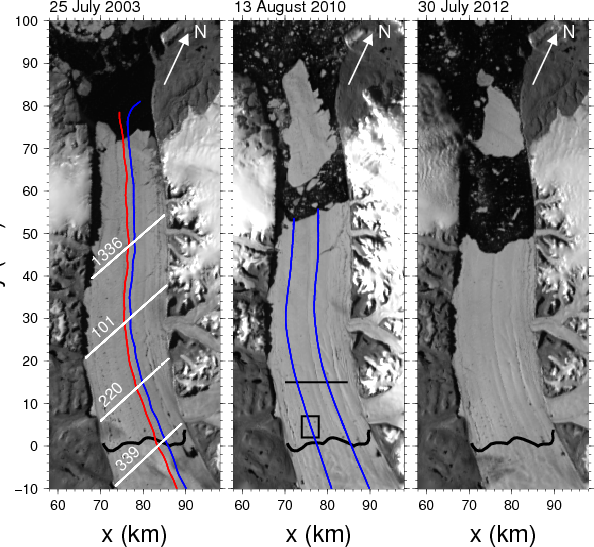
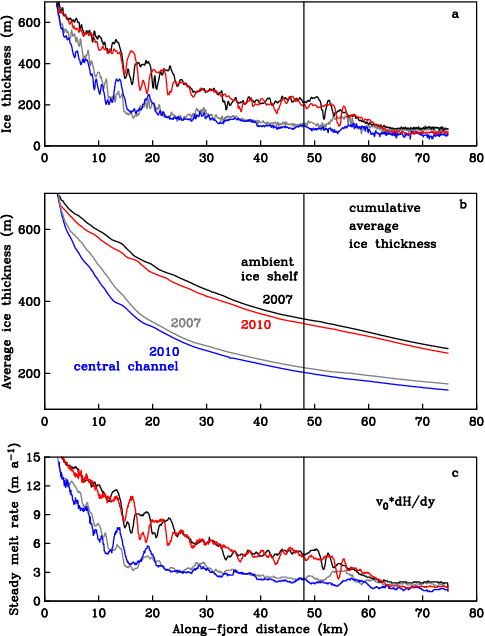
Petermann Gletscher through calving events. White lines show ICESat tracks; red (ambient ice shelf) and blue (central channel) show repeat-track airborne surveys.
The hardest part in reaching this goal is to get measurements from under the 200-600 meter thick ice. This requires holes drilled through the glacier, it requires ocean sensors to be lowered into the water below the glacier, and it requires connections to relay data back to the surface at all hours for many year. I perhaps have a first chance towards this goal when the Swedish icebreaker Oden will work for a month in Petermann Fjord this year. People from the British Antarctic Survey will be aboard and they plan to drill holes for other scientific purposes. When they are done, the holes freeze over, unless someone (me, me, me, please, pretty, pretty please) has instruments to put in there. I just word that I will be aboard the ship as well and I am feverishly working towards this goal with much help from others. More on this in later posts. All science is a group effort.
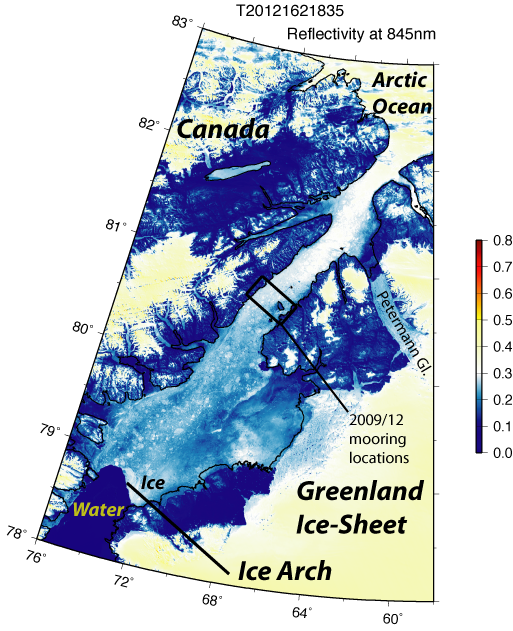
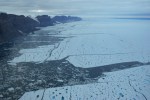
I close with a photo to show how the ice-covered ocean of Petermann Gletscher looks during the polar day. Would it not be great to know the temperature of the water below and the air above this more than 200 meter thick glacier ice at all times posted for everyone to use with an internet connection?
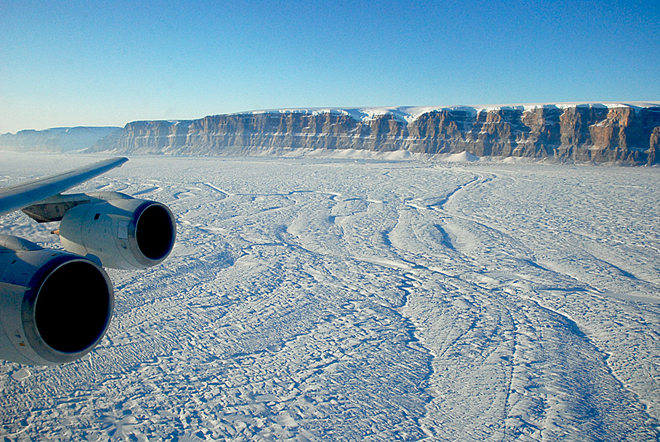
March-24, 2010 view of Petermann Glacier from NASA’s DC-8 aircraft. Photo credit goes to Michael Studinger of NASA’s IceBridge program.