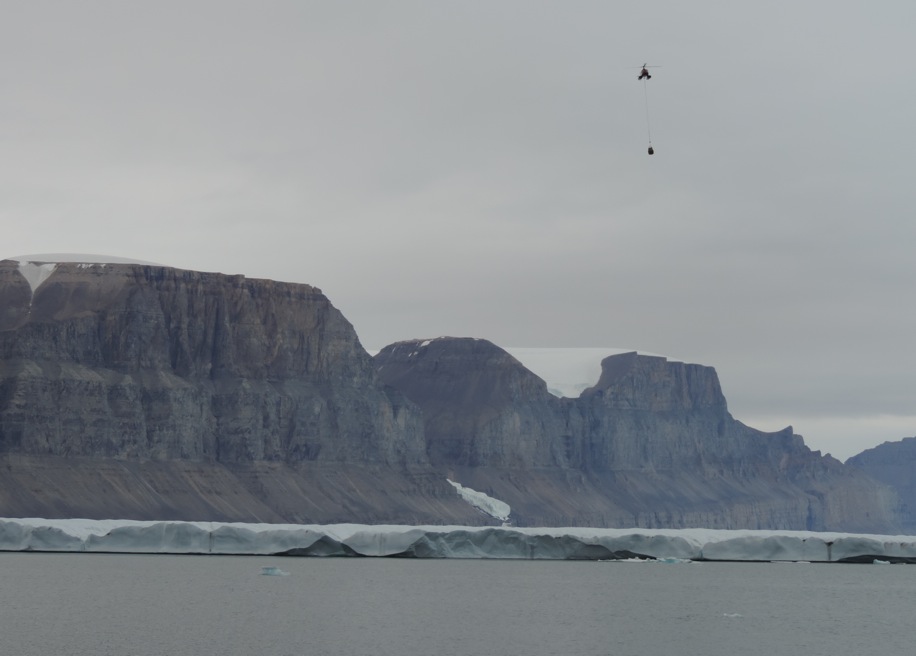
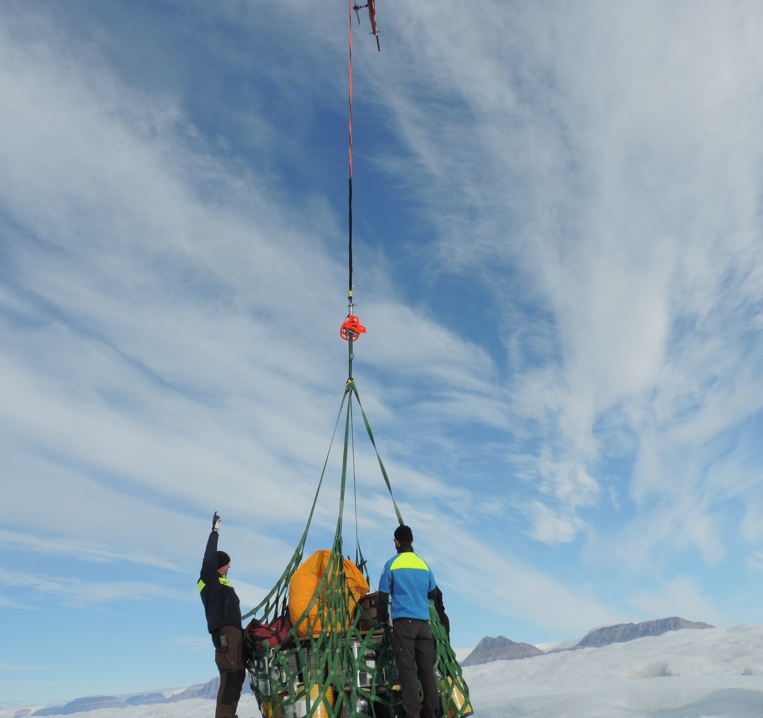
Sensing the oceans below ice as thick as the Empire State Building is tall, we are revealing some of the mysteries of ocean melting of one of Greenland’s largest glaciers. The expedition to Petermann Fjord last month made possible the deployment of three ocean sensing stations that all call home daily via Iridium satellite phone to send us new data from 800 meters below sea level. The ice of the glacier at our stations is 100 to 300 meters thick and a whimsical cable with 3 tiny wires connects the instruments under the glacier to a home-made computer that calls home daily with new data. I am still stunned at the many marvels of technology that all came together to make this happen.
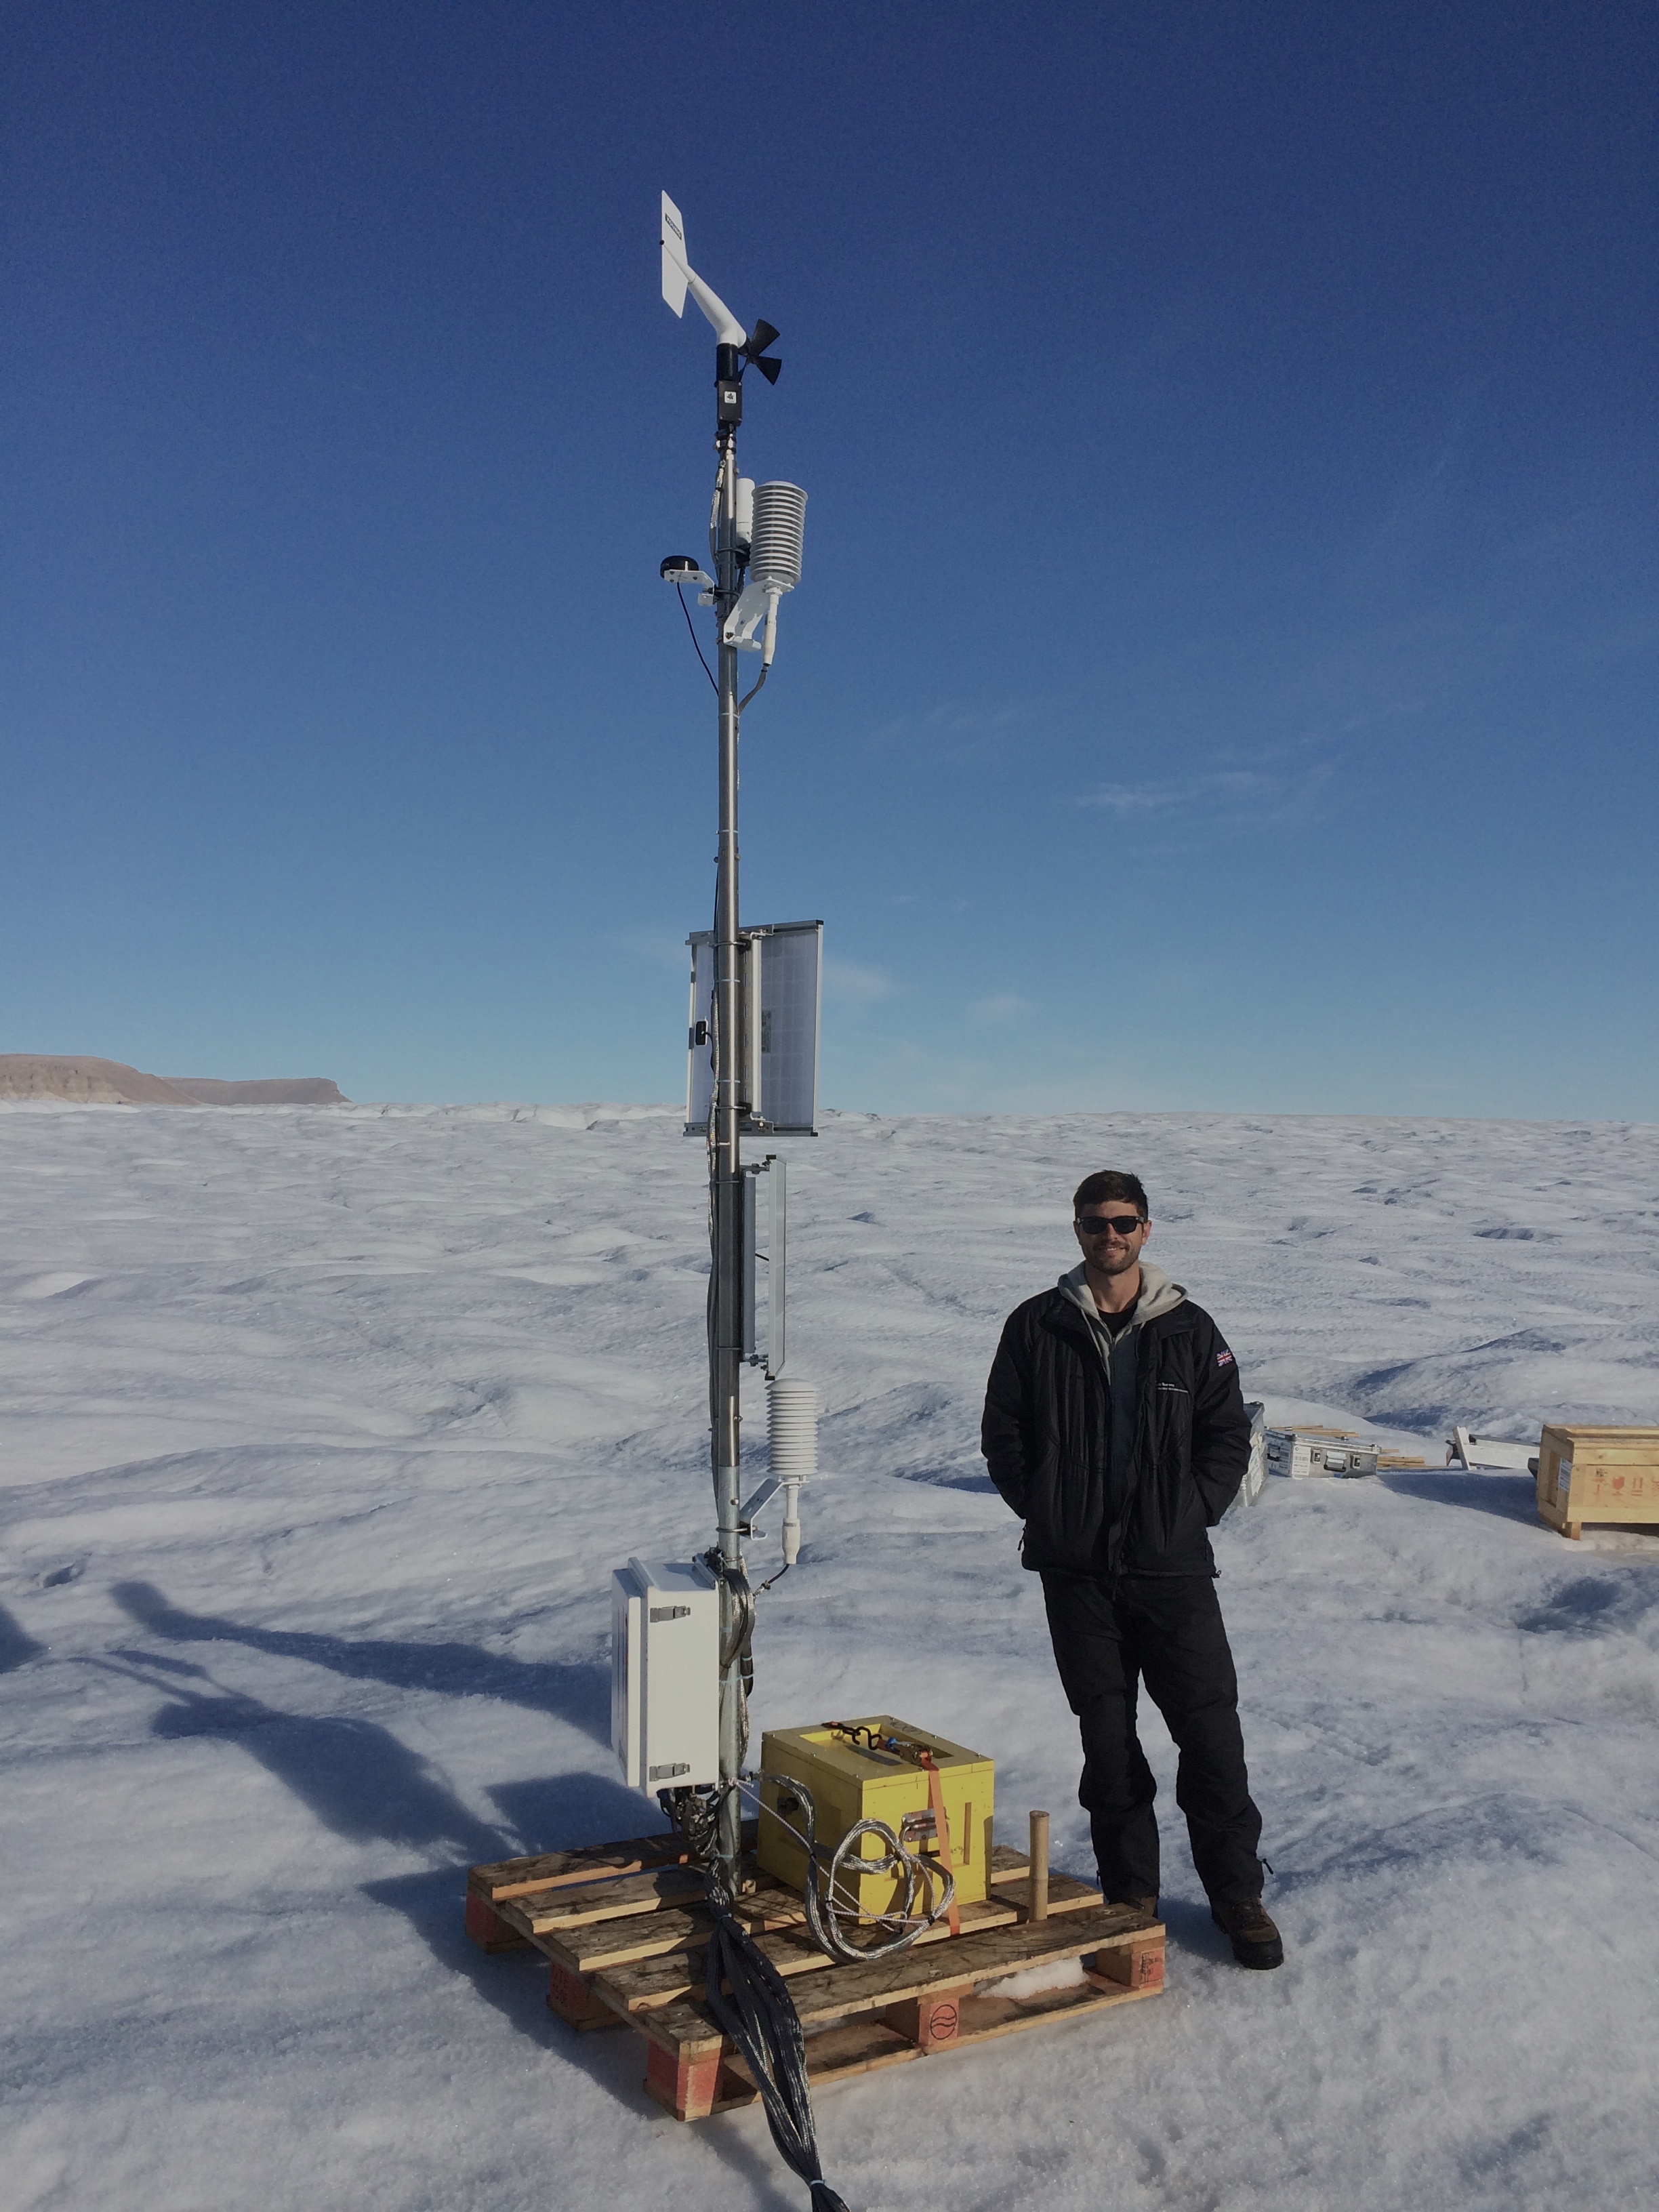
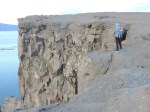
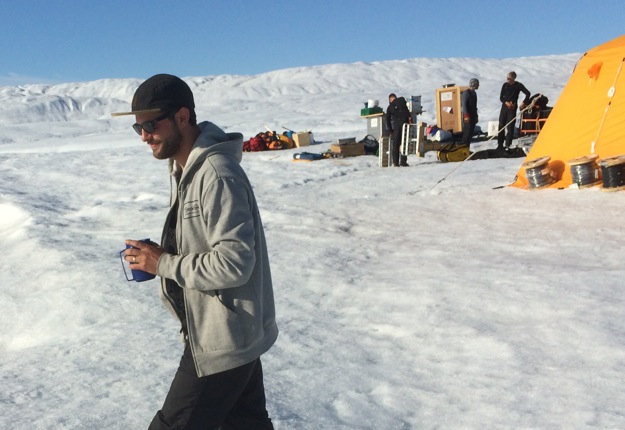
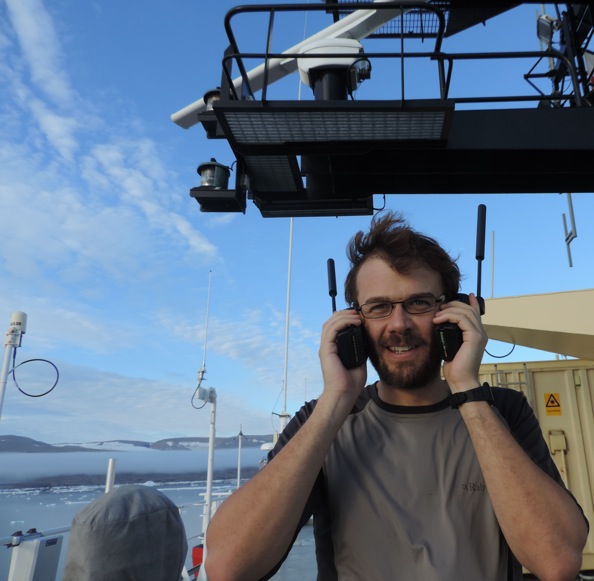
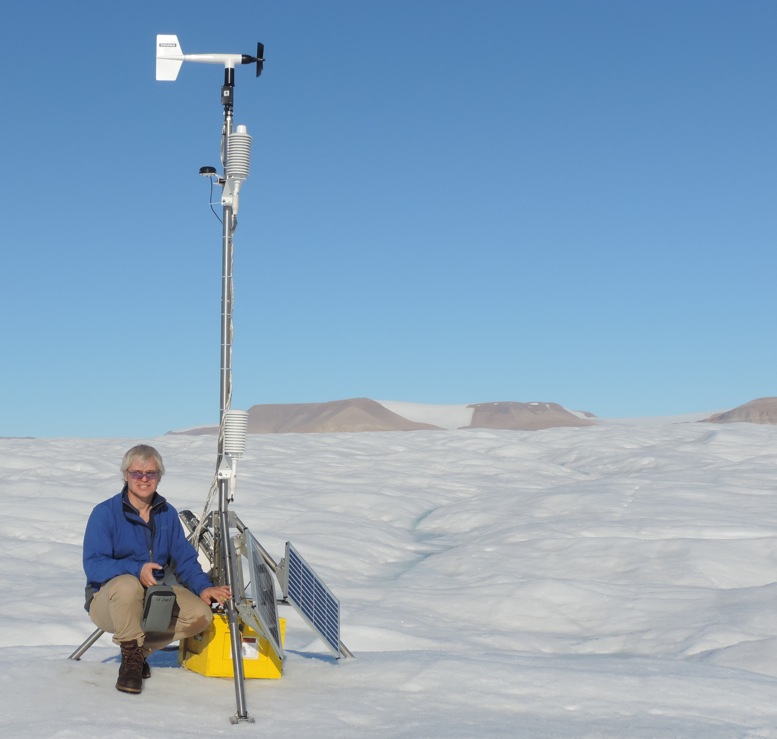
University of Delaware PhD student Peter Washam at the Ocean-Weather station on Petermann Gletscher after final installation 2015-Aug.-20, 17:00 UTC at 80 39.9697 N and 60 29.7135 W.
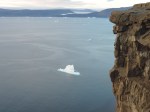
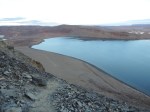
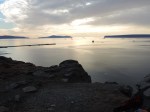
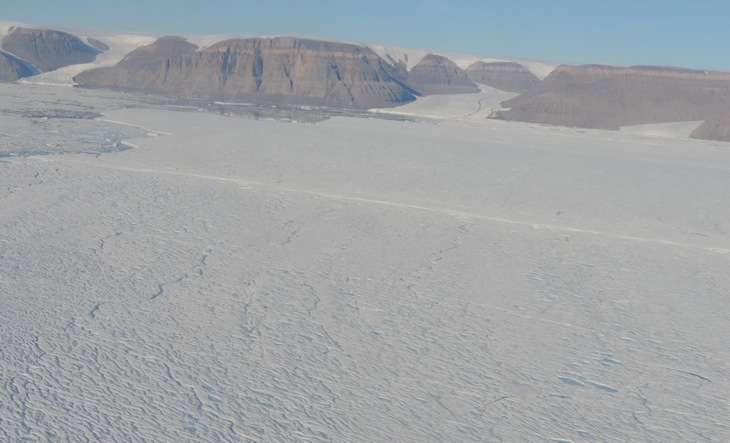
![Panoramic view of the ocean-weather station on Petermann Gletscher. View is towards the south-east with Washington Land in the background. [Photo credit: Peter Washam].](https://icyseas.org/wp-content/uploads/2015/09/img_3037.jpg)
Panoramic view of the ocean-weather station on Petermann Gletscher. View is towards the south-east with Washington Land in the background. [Photo credit: Peter Washam].
-
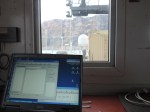
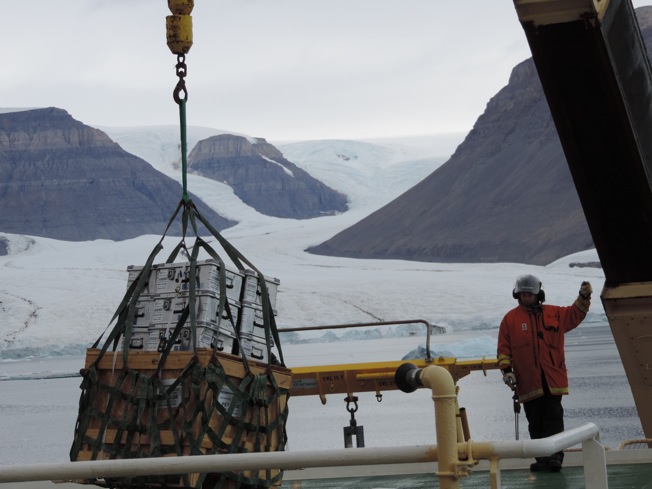
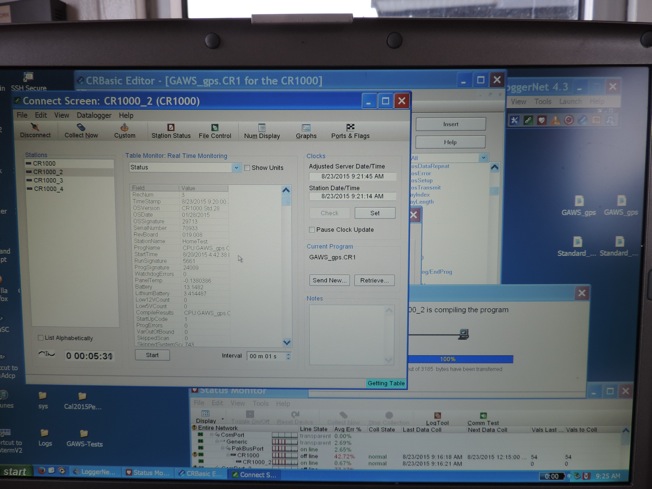
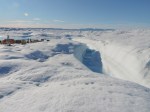
- Testing ocean weather station on I/B Oden in Petermann Fjord 2015-Aug.-5.
-
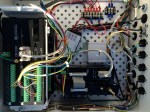
- Command and control of the University of Delaware Ocean-Weather Station with connectors on right and data logger on left.
-
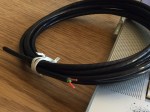
- Cable designed to talk to ocean sensors through the 800 meters of glacier and ocean.
It started with an off-the-shelf automated weather station that David Huntley at the University of Delaware put together for me with the non-standard addition of 5 serial ports that each allow one ocean sensor to be connected by cable to the weather station. It continued with the holes that Paul Anker and Keith Nicholls of the British Antarctic Service drilled through Petermann Gletscher. My PhD student Peter Washam was on the ice helping with the drilling, preparing the ocean sensors, and he is now processing some of the new ocean data.

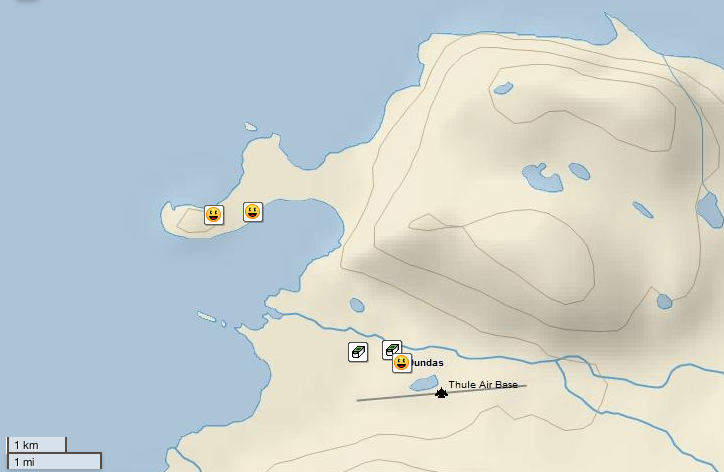
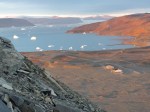
The map above shows Petermann Gletscher (bottom right), Petermann Fjord, and adjacent Nares Strait. The red lines are bottom depths at 500 and 1000 meters while the thick black line shows the location where the 550-m thick glacier sits on bed rock. All glacier ice seaward of this black line is floating with warm ocean waters below. These waters enter the fjord at he sill at the entrance to Petermann Fjord which is about 450 meters deep. The blue dots are locations where last months we collected detailed profiles of ocean temperature salinity, and oxygen. The warmest water inside the fjord and under the glacier enters near the bottom at this sill. The green dots on the glacier are the 3 drill sites where we put our ocean sensors down while red triangles are “fancy” GPS receivers that we placed for almost 2 weeks on the glacier. The one triangle on land (bottom right) is a permanent GPS station at Kap Schoubye that UNAVCO maintains under the code name SCBY. We will reference our moving glacier GPS station (the glacier moves) to this fixed station on bed rock, but that’s a story for another day.
The ocean data are worked up by a small, but wonder group of men and women of all ages working out of the universities of Gothenburg (Sweden), Oxford (England), and Delaware (USA) as well as BAS (England). It is very much an informal group of people who like each other and met in strange ways over the last year or so with all of us juggling way too many projects for which we all have way too many ideas. Bottom-up collaboration and sharing at its best from the bottom up.
Two quick highlights rushed onto these pages before I have to run off to teach a class on signal processing:
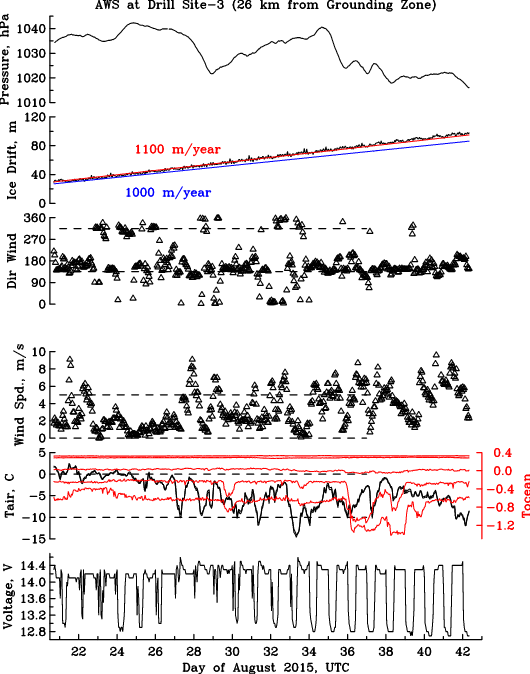
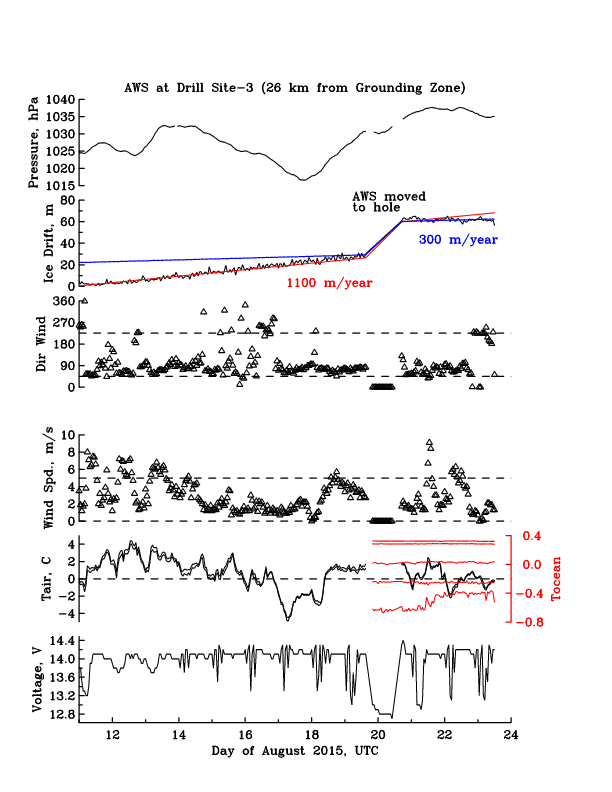
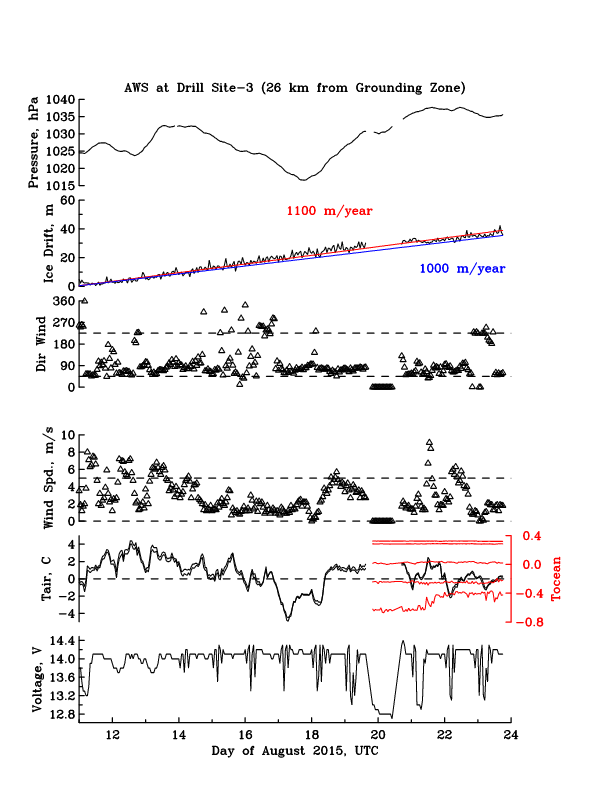
Measurements from the ocean weather station up until 2015-Sept.-11 as a function of time where Day-20 is Aug.-20 and Day-32 is Sept.-1. The station provides battery voltage (bottom panel), air and ocean temperatures, wind speed and direction, ice drift from GPS, and atmospheric pressure (top panel).

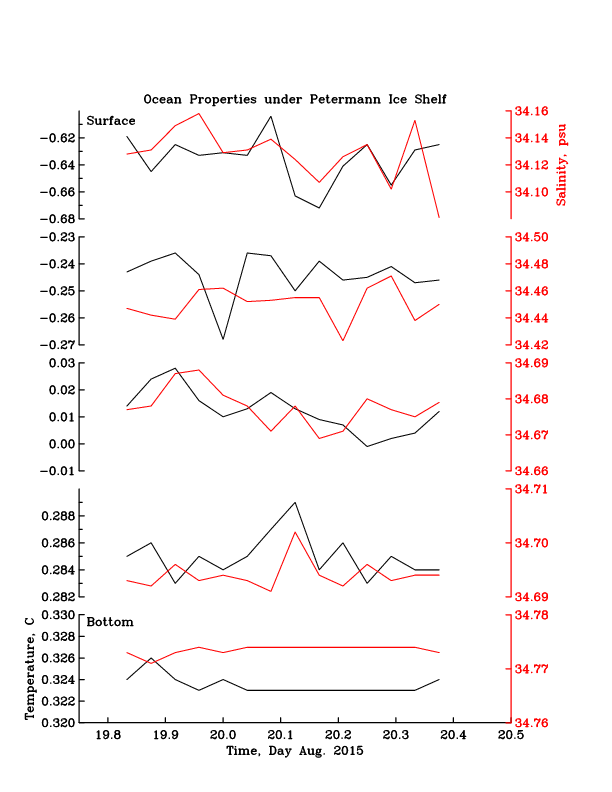
Ocean temperature (black) and salinity (red) observations from below the ice shelf of Petermann Gletscher at 5 different vertical levels from near the bottom (bottom panel) to the ice-ocean surface (surface panel).The bottom of the ice shelf is about 90 meters below sea level.
Note that the scales for temperature and salinity are different at different vertical levels. The warmest water is always found near the bottom while both temperature and salinity under the ice shelf vary by a larger amount that we had initially expected. This means that there are direct and fast connections of the ocean under the glacier with waters inside the fjord and beyond. Notice also that air temperatures are well below freezing (0 degrees Celsius) for 2-3 weeks now while the ocean waters are well above freezing (-1.7 degrees Celsius) everywhere. Hence there is no melting at the surface while there is much melting at the bottom of the glacier. While trivial, this emphasizes the controlling influence that the oceans have on glaciers and ice shelves such as Petermann Gletscher. In the meantime, we got much exciting and fun work ahead of us.
Shout of thanks to NASA (and the US tax-payers) who funded this ocean-weather station at the University of Delaware at about $64,000 for a single year and NSF (and again the US taxpayers) who funded the larger ocean- and land-based experiments within which small part was embedded.
Münchow, A., Padman, L., and Fricker, H.A. (2014). Interannual changes of the floating ice shelf of Petermann Gletscher, North Greenland from 2000 to 2012, Journal of Glaciology, Vol. 60, No. 221, doi: 10.3189/2014JoG13J135
Johnson, H., Münchow, A., Falkner, K., & Melling, H. (2011). Ocean circulation and properties in Petermann Fjord, Greenland Journal of Geophysical Research, 116 (C1) DOI: 10.1029/2010JC006519
Rignot, E., & Steffen, K. (2008). Channelized bottom melting and stability of floating ice shelves Geophysical Research Letters, 35 (2) DOI: 10.1029/2007GL031765