Posted by Pat Ryan for Andreas Muenchow
23-August-2015 at 80:57.3 N 061:27.1 W
(note correction below)
I just may have made a discovery that I cannot share with anyone on the ship right now. The giant mass of ice that is Petermann Gletscher just slowed down moving only 1 meter per day for the last 3 days rather than the 3 meters per day that it usually does and that has been reported in the scientific literature. This measurement comes from the newly deployed University of Delaware weather station that also contains a not-so-fancy $300 Garmin GPS as well as 5 ocean sensors that measure temperature and salinity about 95-m, 115-m, 300-m, 400-m, and 810-m below the surface of the floating and moving ice.
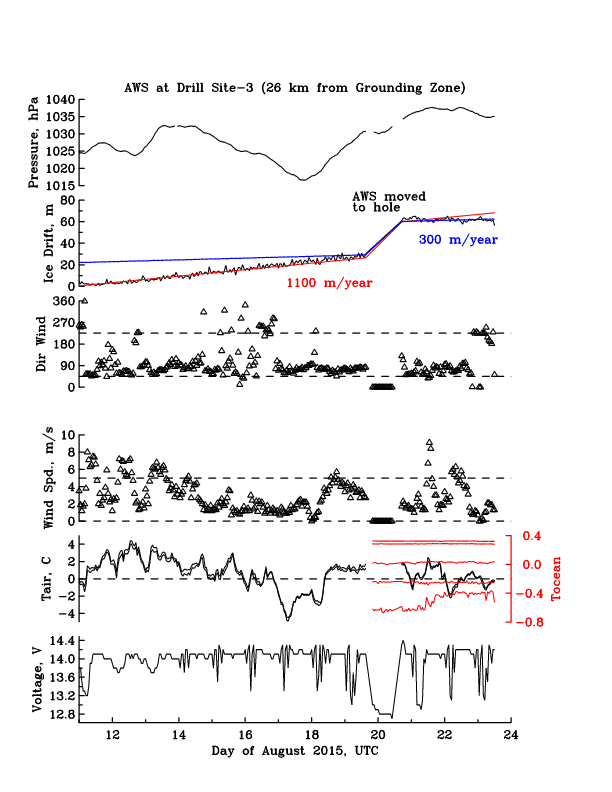
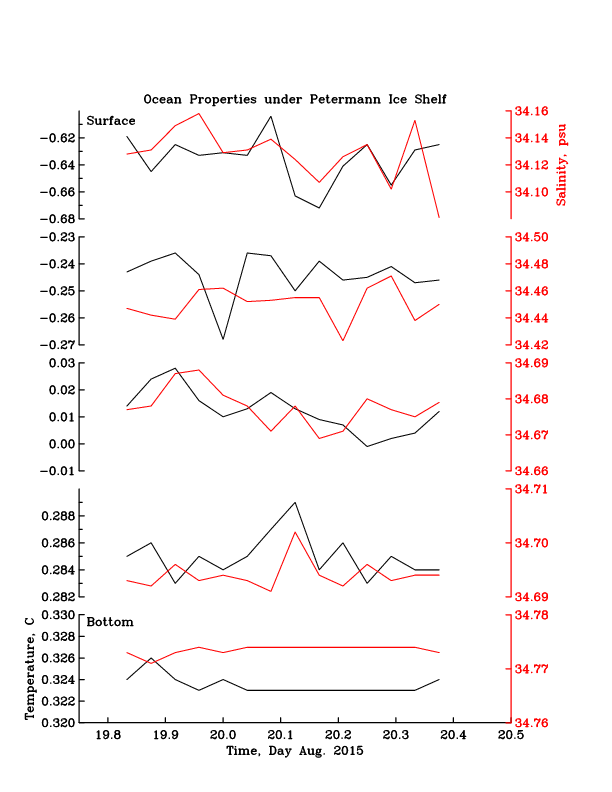
Time Series of Glacier Drift (correction appears below)
As the glacier puts on the breaks, I also see a rather dramatic increase in ocean temperature from -0.6 to -0.35 degrees Celsius within about 10-m of the ice-ocean interface. The saltiness of the ocean also increased from below 34.1 to above 34.2 practical salinity units that you can think of as grams of salt per kilogram of water, roughly. Only 20 m below in the water column, the opposite is happening: The water there cools a little bit and becomes fresher. This suggests some mixing as the salinity differences become smaller and heat from the lower layer moves up towards the ice. Some force must be applied to the fluid to do this. Recall that a force is mass times acceleration. The force of a mosquito splashing on the wind shield of your car is small, because the mass of the mosquito is small even though its acceleration (from zero to the speed of your car) is large. Now imaging this glacier: Its mass is enormous, so you only need to change its velocity a tiny amount, from 3 to 1 meter per day, say, to generate a massive amount of force.
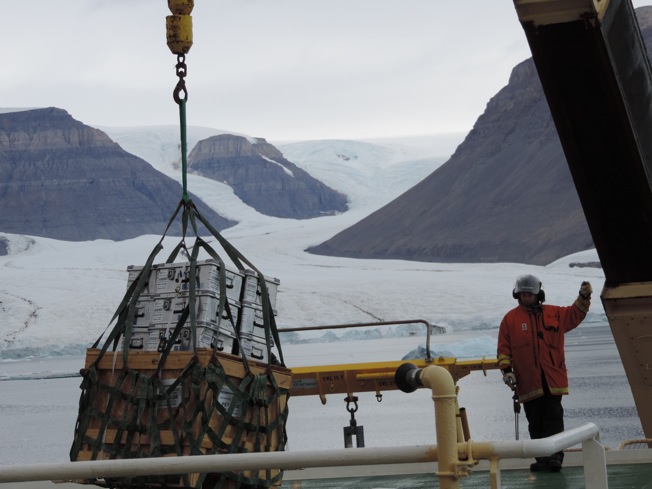
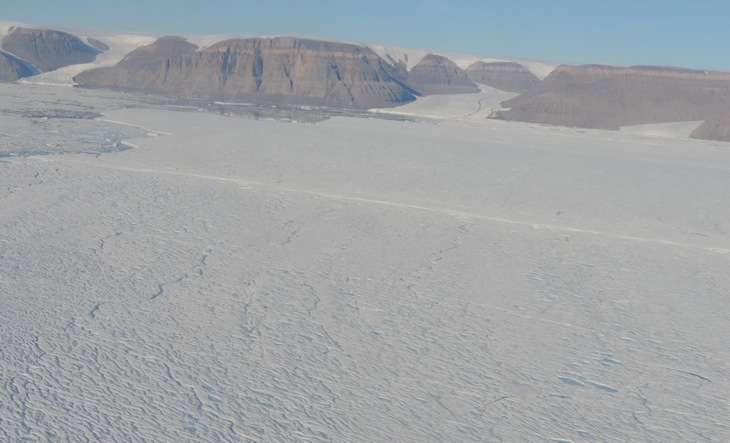
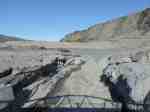
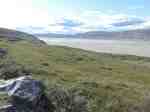
Photo of helicopter deck with Belgrave (left) and Petermann (right) Glaciers in back Aug.-23, 2015; view is to the north-east.
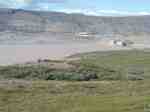
As I look outside my cabin window right now, I see the terminus of Petermann sitting there innocently not appearing to do much, but it is literally changing the face of the earth as it moves fast, slows down, moves some more, and over 1000s of years cut a very deep fjord and perhaps canyon deep into the mountains and even deeper into the sea floor. The helicopters are whizzing overhead right now returning all the gear that was needed to drill through 100s of meters of hard glacier ice to provide access holes to both ocean and sediments that has been in total darkness for many 100s of years.
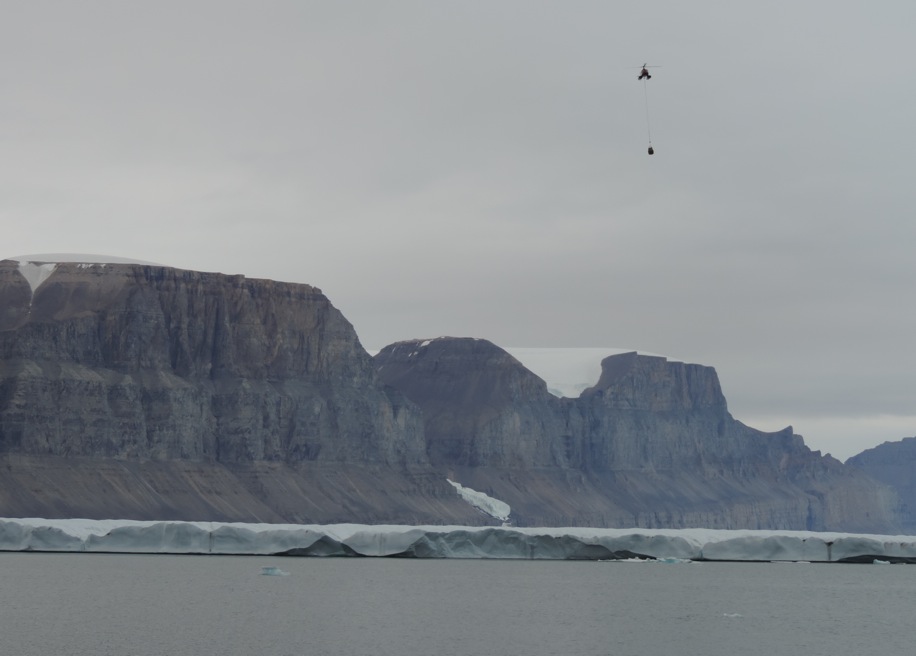
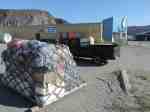
Photo of helicopter delivering cargo from the finished ice camp back to the ship on 23 Aug. 2015.
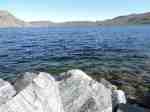
Still, there is life down there, lots of it Anne Jennings, who closely looks at the sediment cores, tells me. We speculate that the life is supported by vigorous ocean flow that connects the open fjord with the glacier covered deep ocean. Food stuff like plankton may move some distance under the floating glacier to support a population of other critters that I know nothing about. No narwhals this year so far, though.
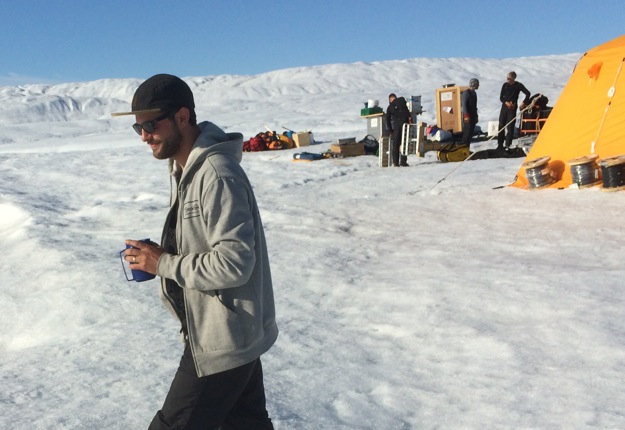
So why I am writing this up here rather than share it with people on the ship? Well, this is Sunday morning and there was much to celebrate last night when the ice drilling team returned after 2 weeks camping on the ice and collecting data from their three drill holes. Furthermore, the the ocean weather station reported for the first time in over 2 days uploading all the data I show above. This happened well past midnight and several of us discussed the data and future plans in the cafeteria until 1:30 am. So the people not working right now are all sleeping (10:30 am here) as we probably will work through the night to map the Atlantic waters flowing into the fjord at its sill towards Nares Strait … which we have not yet done over the 3 weeks we have been in the area. I probably also should help with unloading the helicopters or getting the Chief Scientist Alan the data files he needs to catalogue the water samples we collected last night. Work on Oden never stops … as there is so much to do as we are barely scratching the surface or bottom of the ocean here. [Incoming helicopter, 4th one since I wrote these lines too fast, perhaps.]
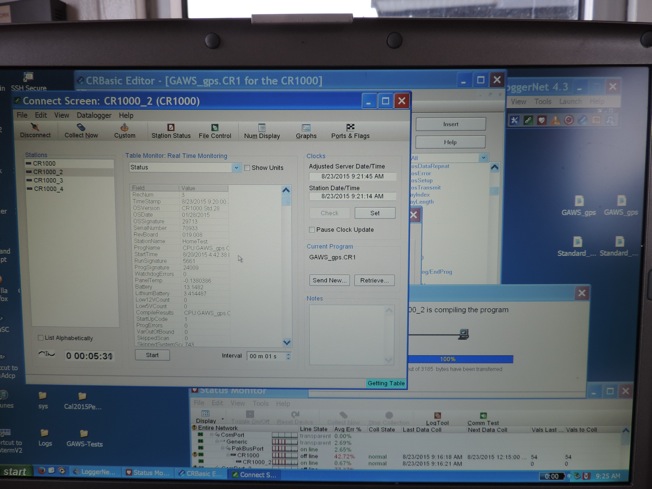
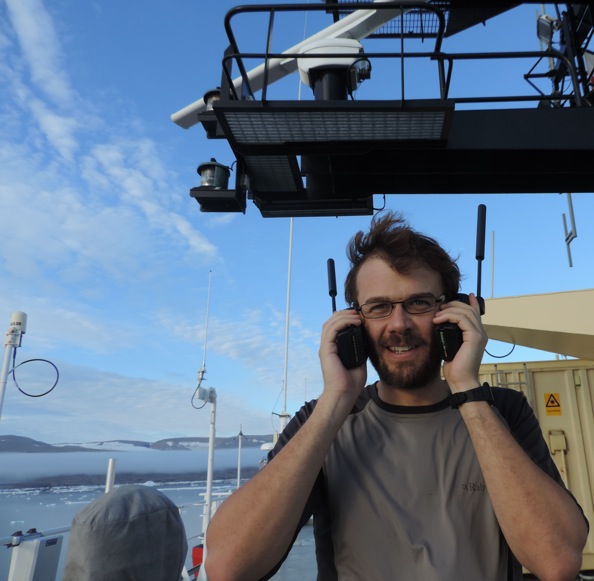
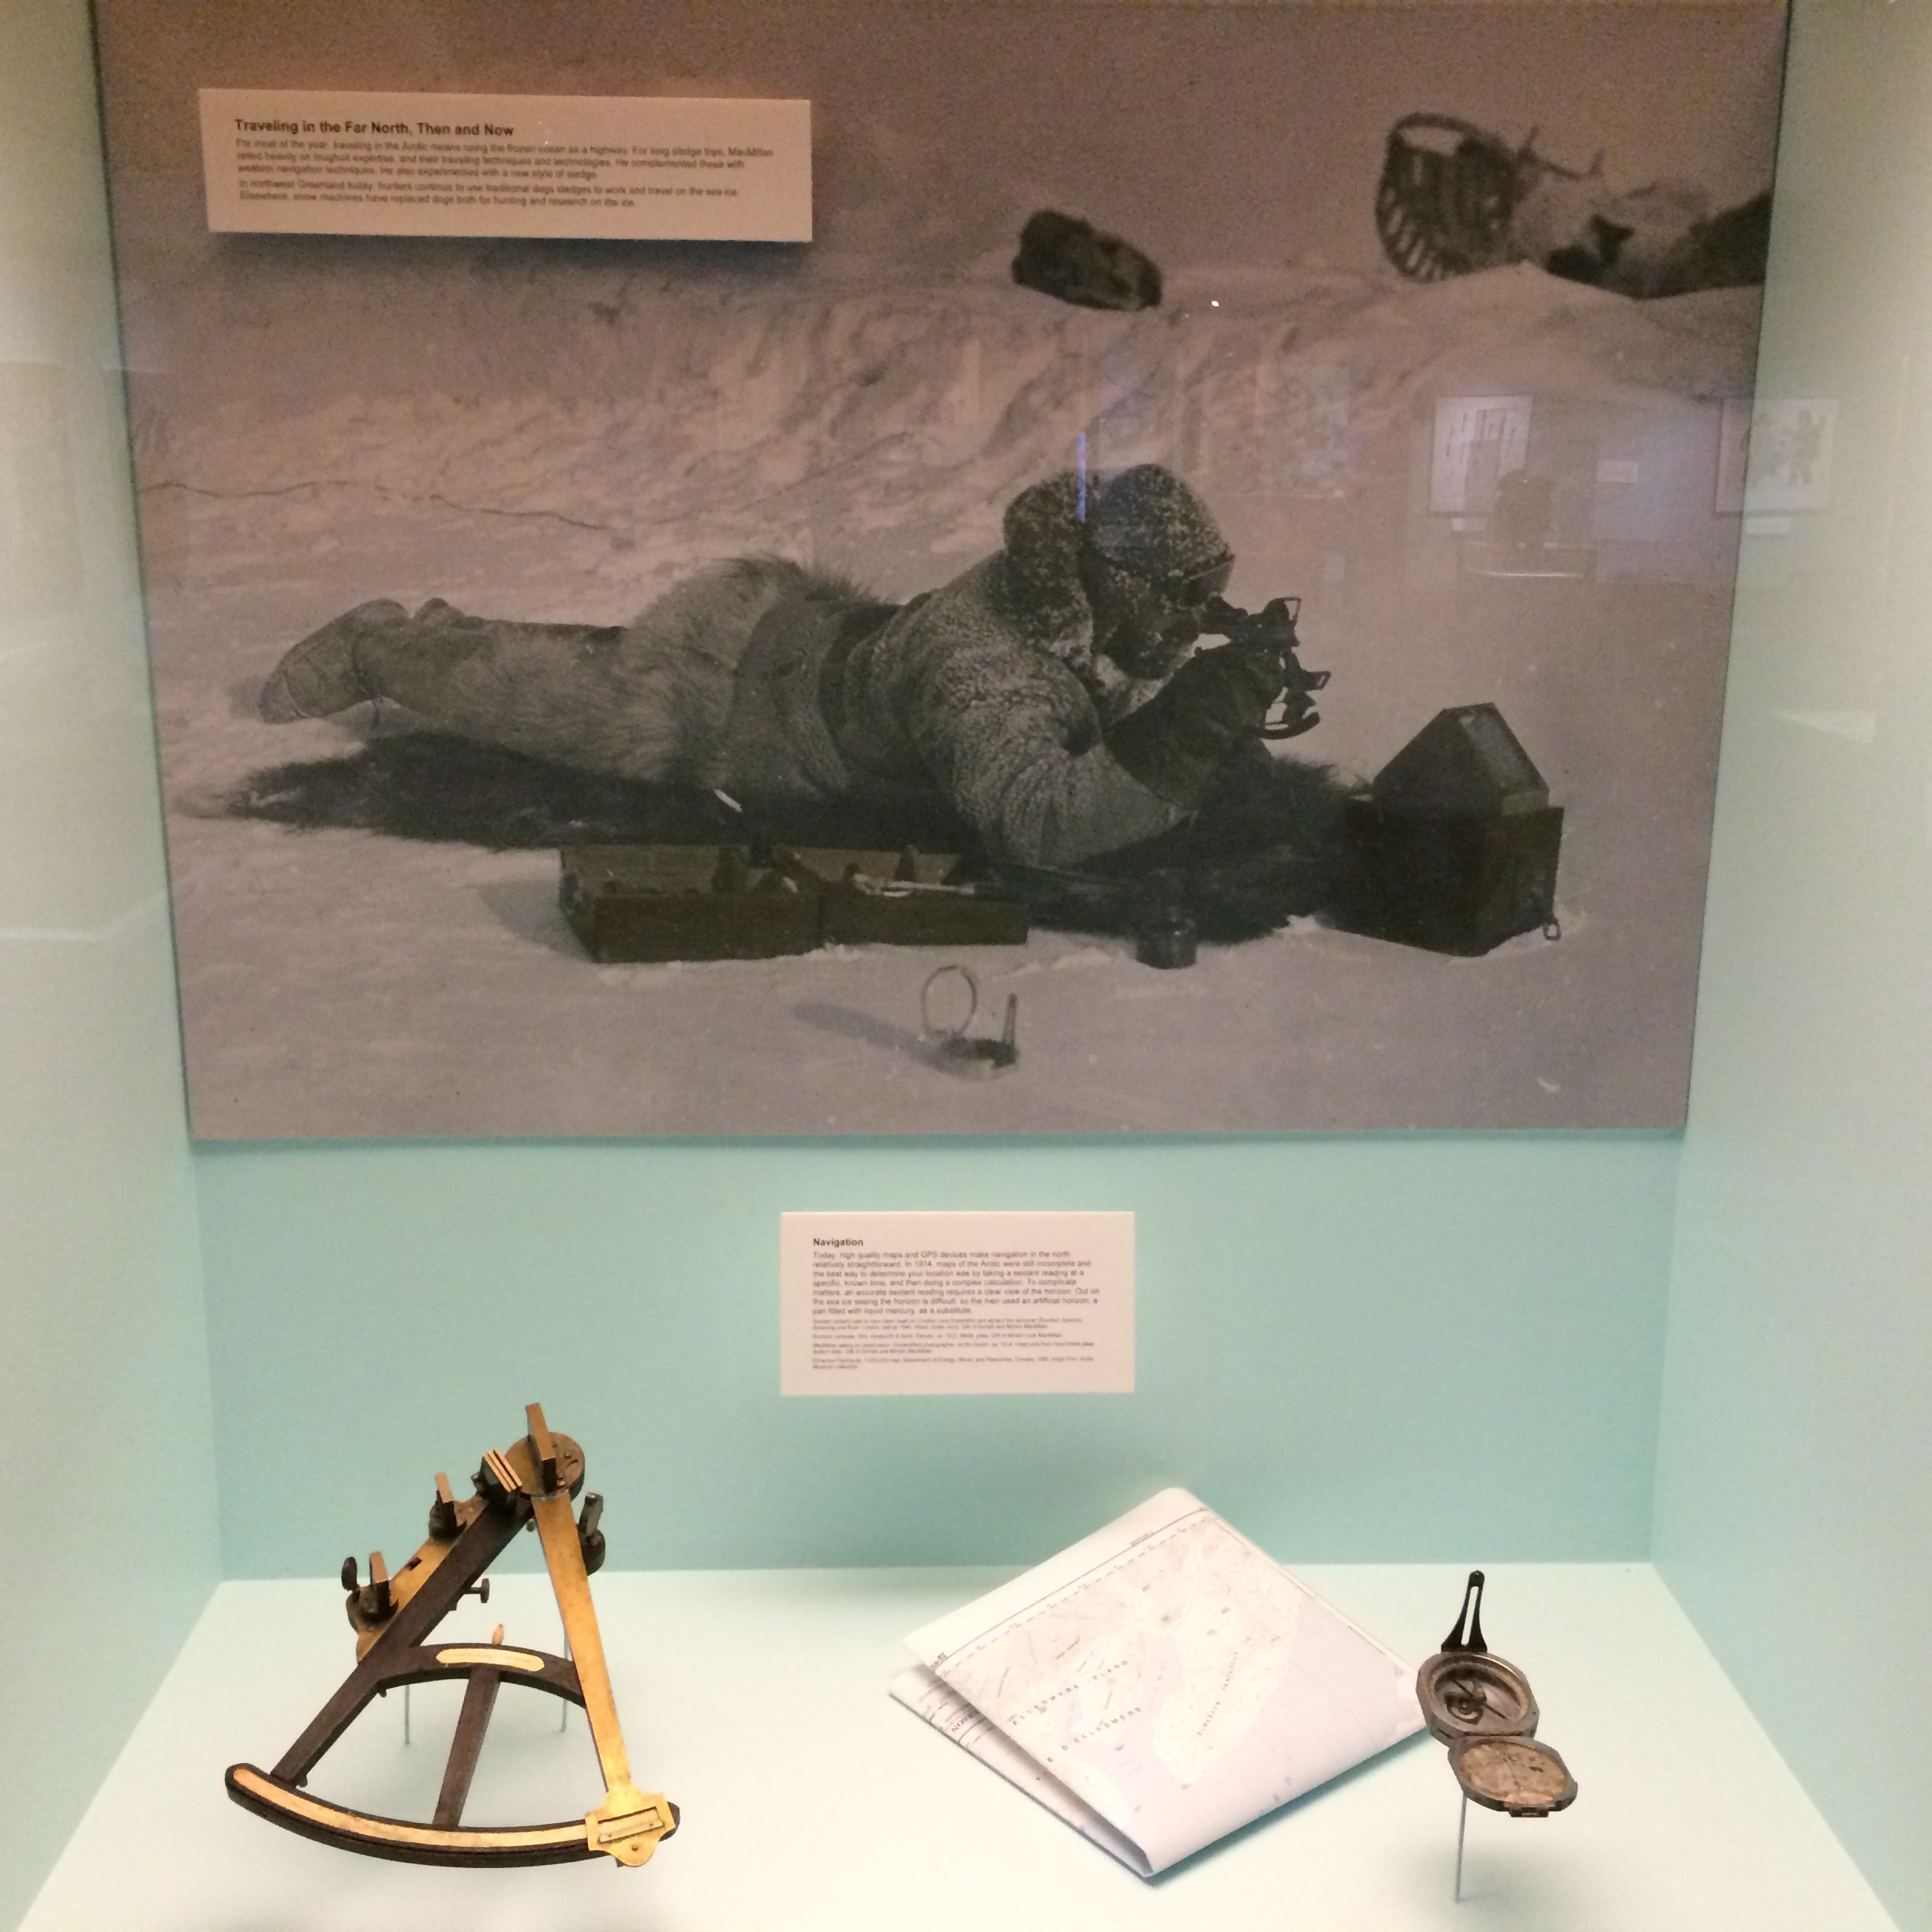
Screenshot of a successful RS-232 serial connection from ship to ocean weather station on Petermann Gletscher and ocean sensors deployed 810 m below the glacier’s ice surface with active real time data transmissions. This session uploaded new codes to the secondary data logger to activates its secondary back-up memory.
Correction:
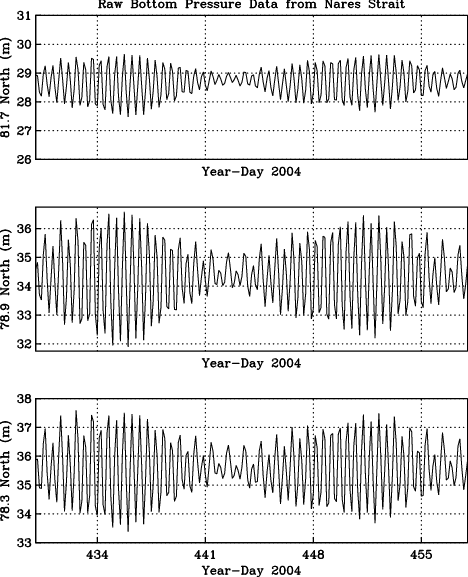
Petermann Gletscher did slow down the last few days by about 10% as measured by the GPS at the UDel ocean-weather station. The suggested slow-down to 300 meters per year, however, is false, because I did not properly take into account how the station was moved by 30 meters to the south-west. The correct and updated estimate is the figure below. Please discard the the above figure erroneous.
Sorry for the confusion … more data coming from this station will place the short term change in glacier speeds into a larger context. Furthermore, the present “cheap” GPS system will need to be verified by a set of three “fancy” differential UNAVCO GPS that were recovered today, but we have not yet decoded the data contained on those units.
Back to CTD profiling the water properties across the sill at the entrance to Petermann Fjord that we will have to complete by 3 am or in about 6 hours.
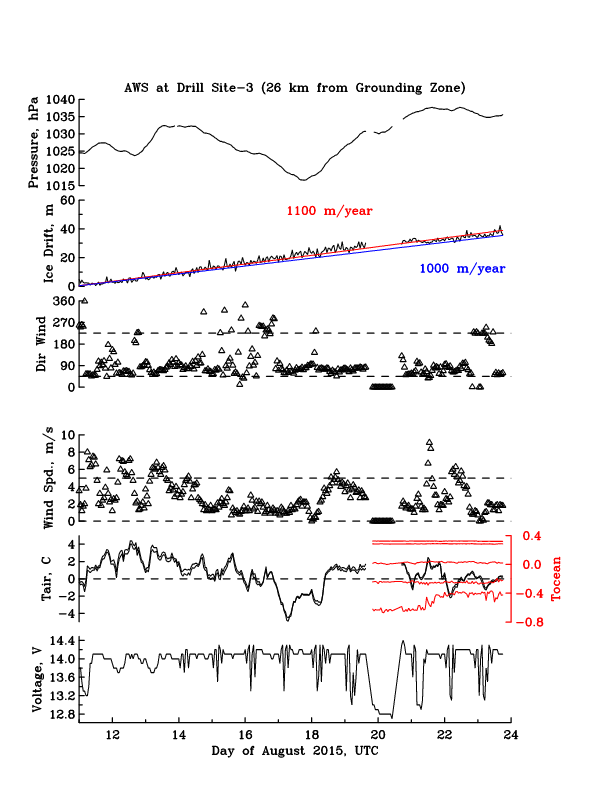
Time Series of Glacier Drift (Corrected)