Lights are out. Our ocean weather station on a floating glacier of northern Greenland confirms what the U.S. Naval Observatory reports for location 60 degrees and 30 minutes West longitude and 80 degrees and 40 minutes North latitude: As of today the sun is no longer above the horizon and will not rise until 23 February 2016. Total darkness means no solar power for the station that will have to survive on a fancy car battery temperatures as low as -50 degrees centigrade. Last week with the sun still up our station recorded -30.4 degrees celsius about 4 feet above the ice. How long will the station survive on that car battery?
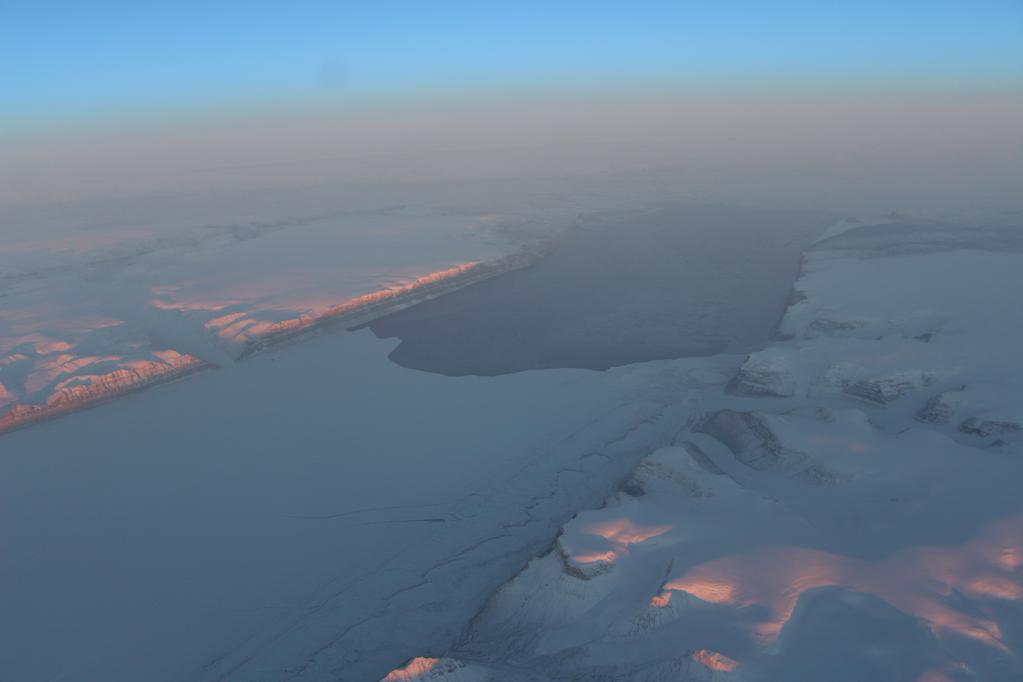
Petermann Gletscher at dawn on 5 Oct. 2015 as captured by NASA Operation IceBridge. Our Ocean Weather Station is in the corner bottom left.
Without power the station does not function, because each sensor, each computer, and each telephone call via the Iridium satellite system requires electricity. Without power I am in the dark about what the station does or what ocean or air temperatures are. Since I do have power at the moment, well, I got new data. For example, there is a voltage that the station sends me …
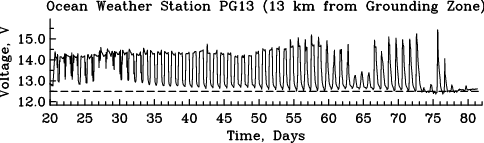
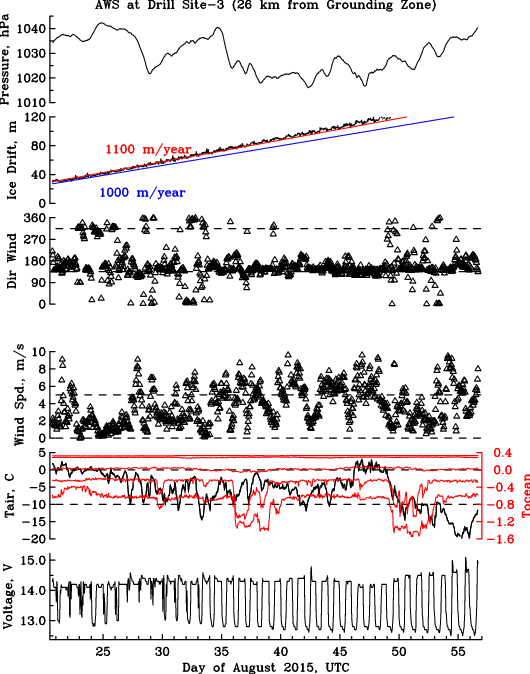
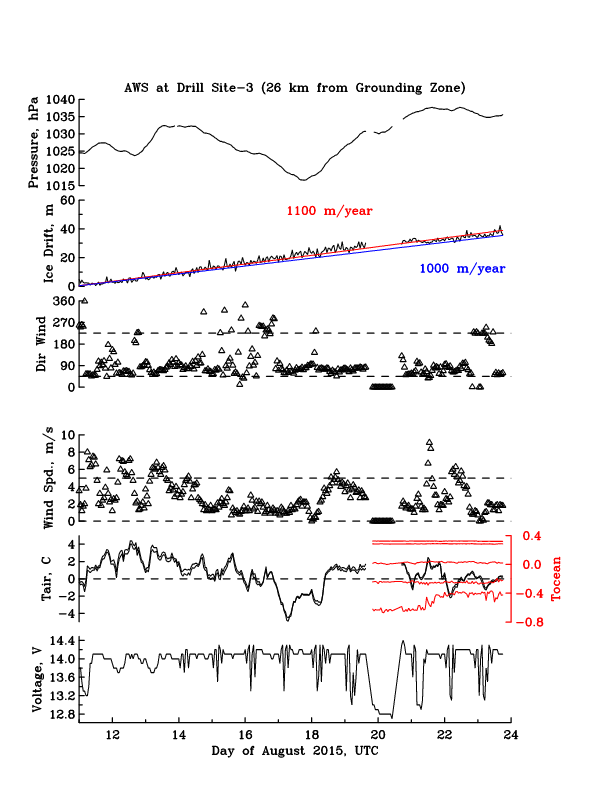
Voltage at Ocean Weather Station on Petermann Gletscher.
… whenever the sun is up, the solar panels recharge the battery and the voltage goes up. As I use electricity, the voltage goes down. Lets ignore a small temperature effect and details on how much electricity we draw at what “amperage.” Instead, lets focus on the regular up and down of voltage for the last 60 days and how it suddenly went flat. The flat line at 12.5 Volts tells me that the sun is down. The station now uses the car battery, but how long will this last? Quick answer is … a day, if I am dumb. Or 150 days, if I am smart. Time will tell, if I made a mistake in either my power budget or my computer code that gives and takes power to a range of sensors. Scary stuff, and my little sister Christina Parsons can attest, how nervous I was, when I uploaded new power-saving software that I wrote from my attic at home to the station in Greenland. The station did take the new software, restarted itself, and works making one data call each day instead of three. Data are still collected every hour, but I save 20% of total power.
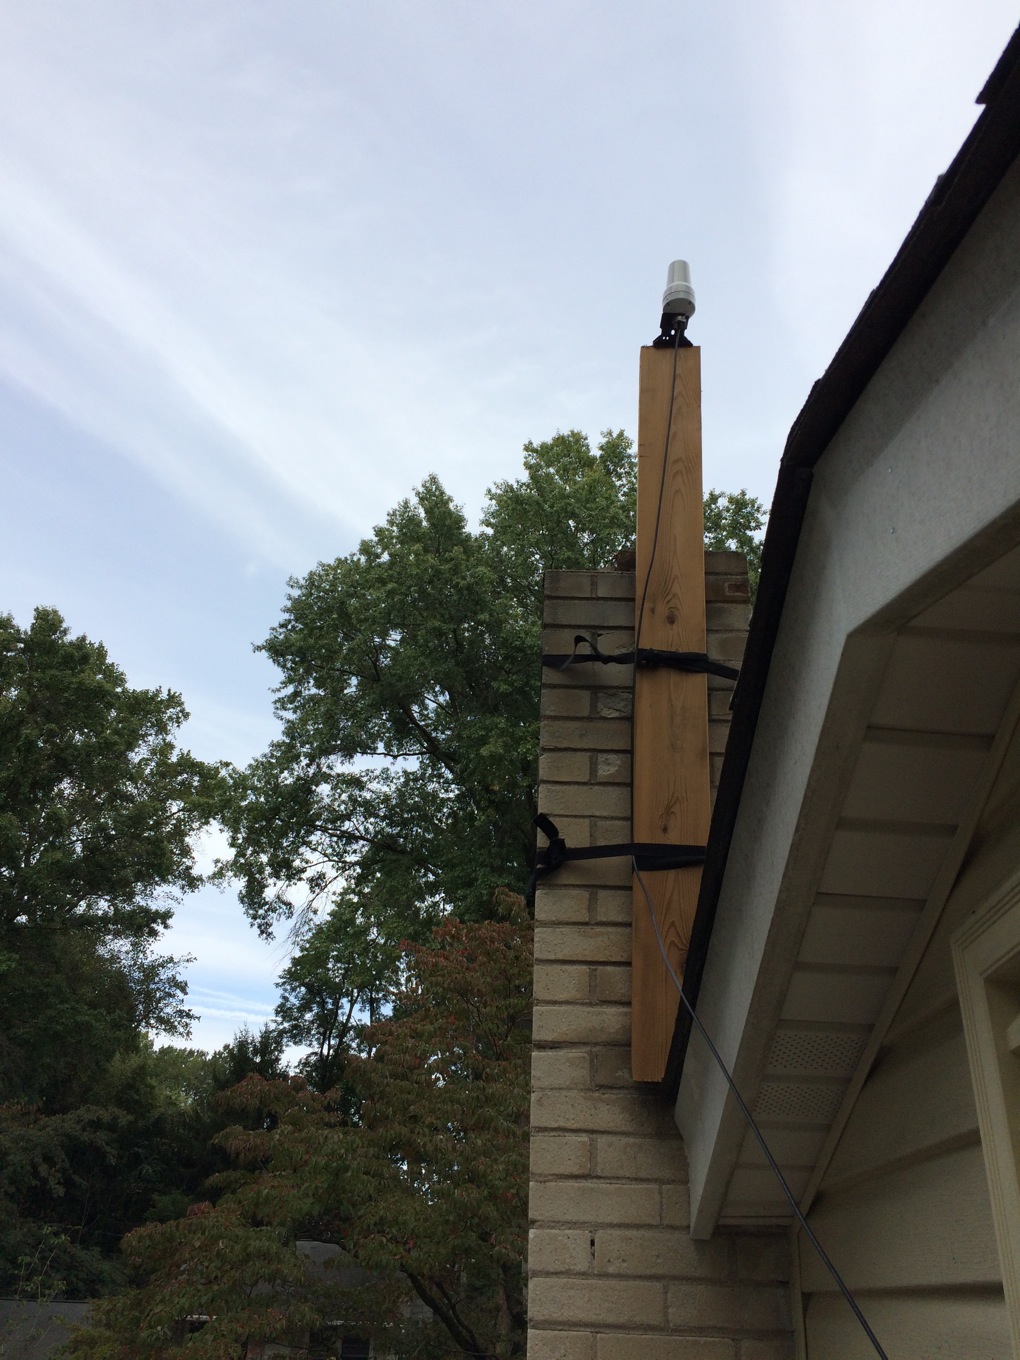
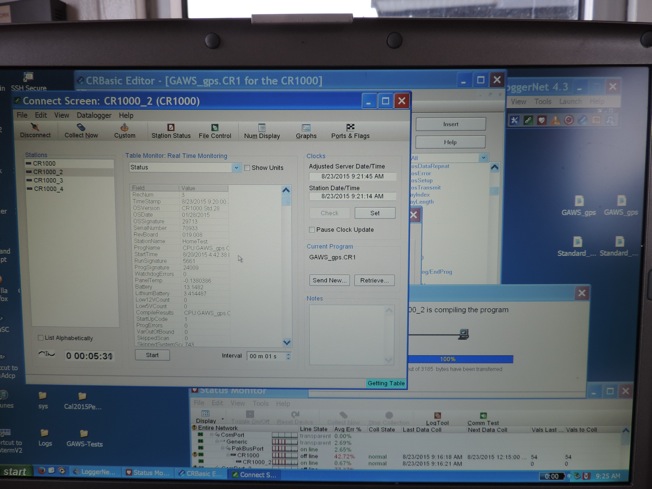
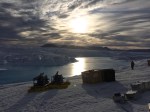
Power is something in Watts (40 W Light bulb anyone?) and you have to multiply voltage by current draw (0.5 Amps anyone?) to estimate the power needs of the device drawing 0.5 Amp current at 12 Volts. Incidentally, 0.5 Amps is what the Iridium satellite phone draws when it calls me with new data. Let me check my power budget, if this is true … nope, it only takes 0.365 Amps, so it takes 12 volts times 0.365 Amps equal 4.4 Watts which is about 1/10 of that 40 W light bulb you are looking at, perhaps, or the station we put up: the yellow box is the car battery powering all the gadgets you see and many more you do not:
-
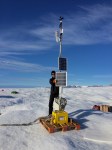
- University of Delaware Ocean Weather Station 13 km seaward from the grounding zone of Petermann Gletscher [Credit: Peter Washam]
-

- Petermann Gletscher 20 August 2015. Notice the freezing of the central channel. [Credit: Peter Washam]
What I just showed you is the beginning of a power budget that I had to make to get my station through the night, now that there is no more sun for the next 4-5 months. My car batteries are rated to give 110 Watts for an hour, so if I run my 4.4 W satellite phone all the time, I would be out of battery juice after 110 Watt-Hours divided by 4.4 Watts equals 25 hours. That’s bad, real bad, especially since one should not run a car battery to zero and the battery at -30 degrees Celsius may only give me half the power than it would at the more usual 15 degrees Celsius we got outside. The solution to this problem is to use the phone only for a few minutes each day, say 5 minutes. So, since I am using the phone only 5 minutes out of the 1440 minutes that each day has, it takes about 1440 minutes divided by 5 minutes times 25 hours equals 300 days for the phone running 5 minutes each day to run down the battery. Magic this math is not, but it shows how important it is to use resources (electricity) wisely. There are times and places where it is not possible to plug your iPhone into a power outlet. You get the picture … well, here are some that University of Delaware PhD student Peter Washam took who was part of the ice drilling team during last summer’s deployment of the ocean weather station:
-
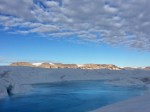
- Central channel on Petermann Gletscher at the University of Delaware Ocean Weather Station 19 August 2015. [Credit: Peter Washam]
-
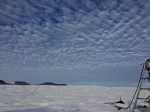
- Sky over Petermann Gletscher at Site PG13 about 13 km from the grounding zone.
-

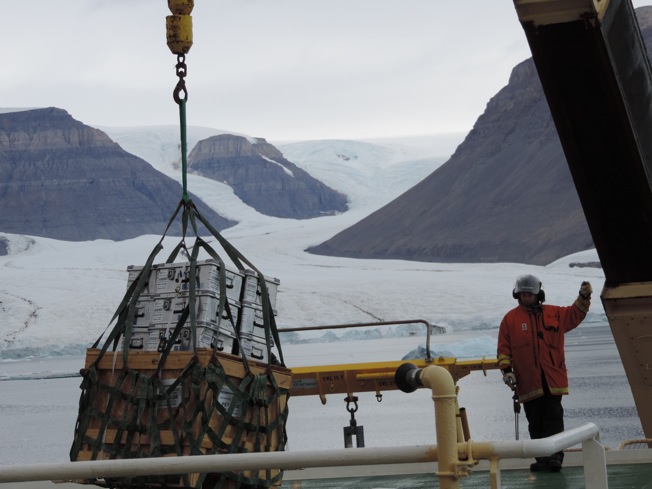
- Camping site of the ice drilling team on Petermann Gletscher in August 2015 during installation of the Ocean Weather Station. [Credit: Peter Washam]
-
- Midnight sun at ice drilling camp on Petermann Gletscher 20 August 2015. Notice central channel. [Credit: Peter Washam]
So, as of this morning at 4 am Delaware time, the station now in total darkness tells me that the ocean temperatures 700 meters below the 100 meter thick glacier are +0.3 degrees Celsius while air temperatures 2 meters above the ice are -11.1 degrees Celsius. Now what that means to the melting of the glacier by the ocean, I will have to tell you at another time in more detail. These data are the ONLY data from below any glacier to the north of the equator. We are really breaking new ground and are making new discoveries as we go along … as long as there is power. Hopefully there is no dumb mistake in my power budget.
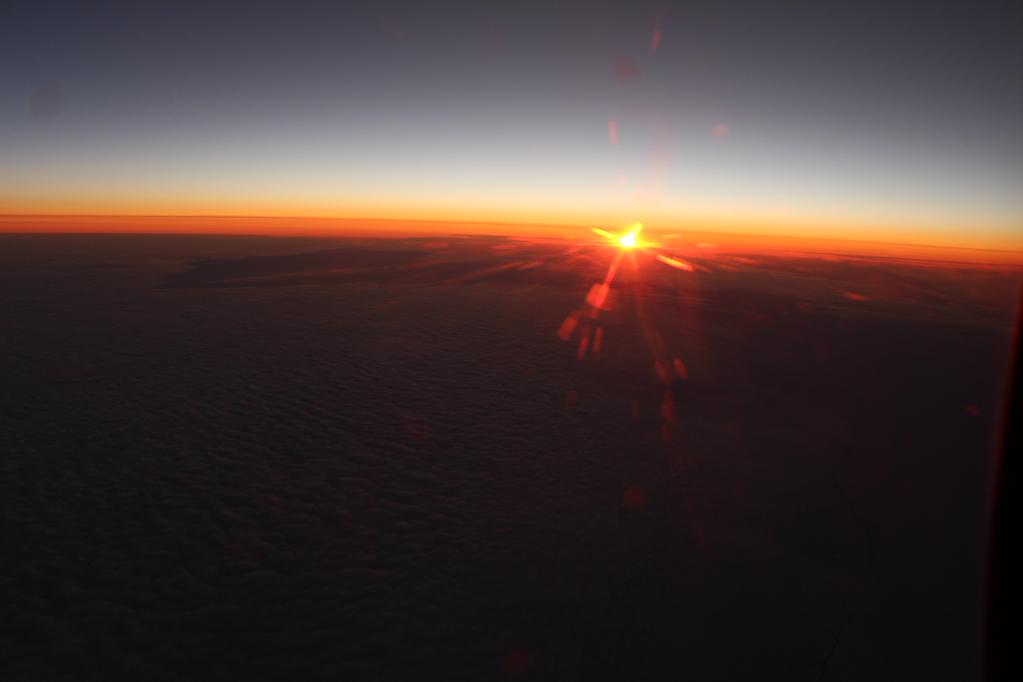
Sun over the horizon of Greenland as seen during NASA’s Operation IceBridge Flight in October 2015.
![University of Delaware Ocean-Weather station on Petermann Glacier with the hot-water drilling team UDel and British Antarctic Survey after deployment Aug.-20, 2015 [Credit: Peter Washam, UDel]](https://icyseas.org/wp-content/uploads/2015/09/udel-aows_3052.jpg)