Monthly Archives: June 2012

Nares Strait 2012 Ice Arch Collapsing (Updated 6/30)

UPDATE-2 6/30:

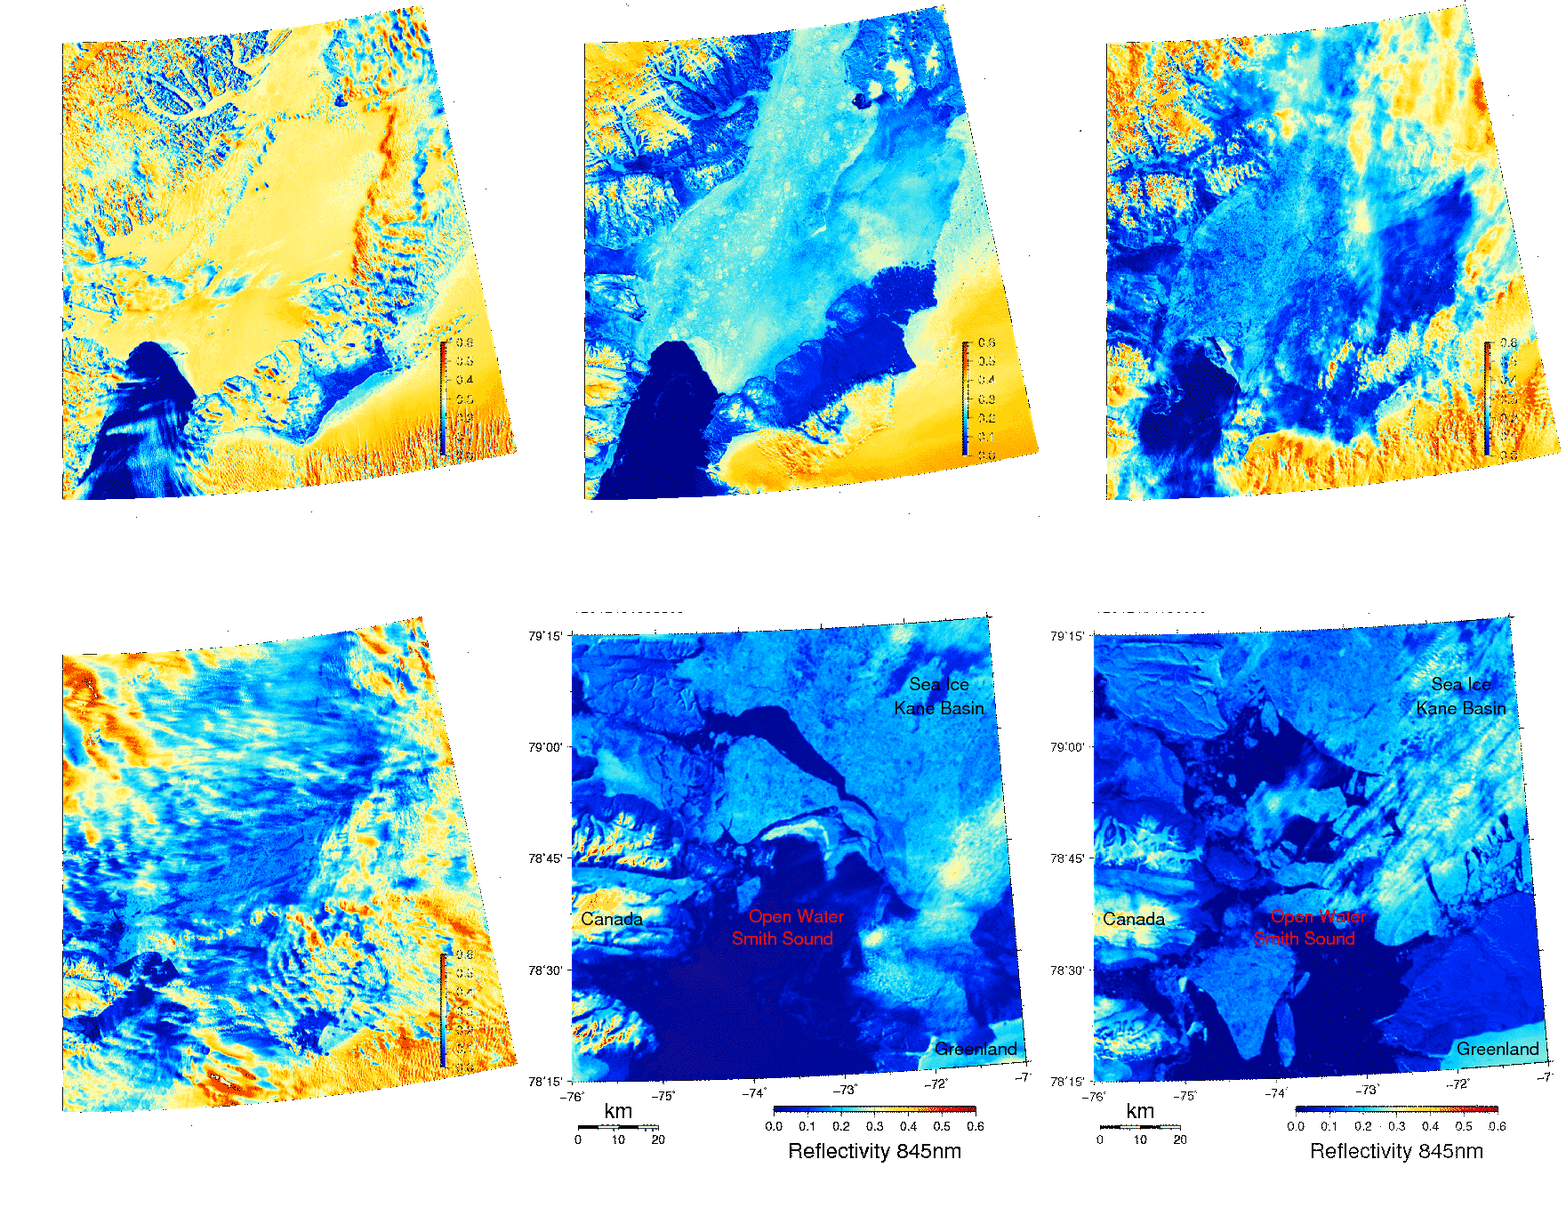
June-30, 2012 MODIS-Terra view of the collapsing Nares Strait ice arch. The separation occured at the location where the hairline fracture developed 3 days ago. The collapse is propagating upstream to the north as the buttressing support on the western anchor point near Bache Peninsula and Pim Island was removed.

UPDATE-1 6/29:
June-29, 2012 MODIS-Terra view of the collapsing Nares Strait ice arch. The separation occured at the location where the hairline fracture developed 2 days ago.

The most relevant weather information is from Hans Island near 81 N latitude.

ORIGINAL Post (6/28/2012):
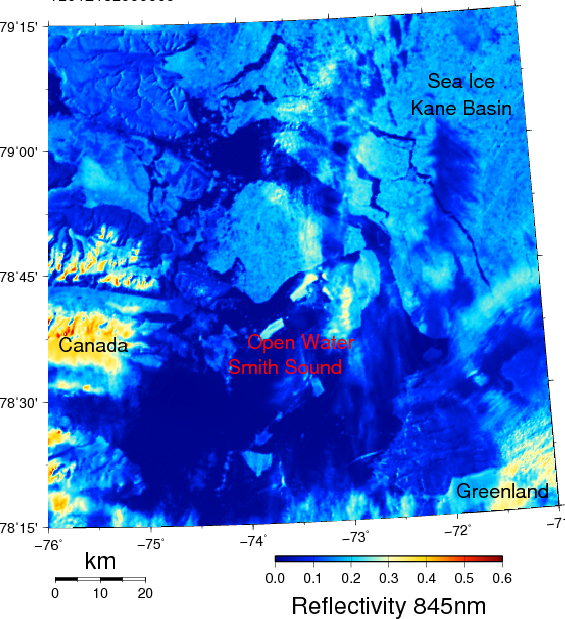
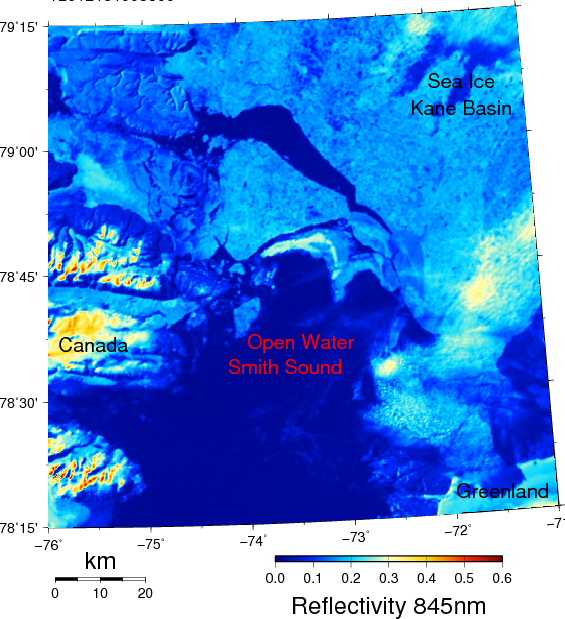
The collapse of the ice-arch in southern Nares Strait began June-27, 2012 with development of a small hairline fracture along the western side of the strait off Ellesmere Island, Canada. The fracture connects an isolated area of open water off Bache Peninsula, Canada at 79 N latitude. The front between land-fast ice in the north and the open water in the south has moved slightly southward. It has also lost a visible larger piece of ice that before anchored the bridge at its western connection to land. This motion will open the hairline fracture more, accelerating the collapse of the ice-arch. The missing support of the ice-arch on its western side will collapse the entire ice-arch and the previously land-fast ice of Nares Strait will stream rapidly to the south, I predict, before this weekend.

Updates (including an animation) will be posted daily at http://muenchow.cms.udel.edu/Nares2012/Kane/.
Ice-bridge at southern Nares Strait June-26, 2012 23:30 UTC from MODIS-Terra. There are no hairline fractures yet along the Ellesmere Island side near 79 N latitude. Greenland is on the right (east), Canada on left (west).
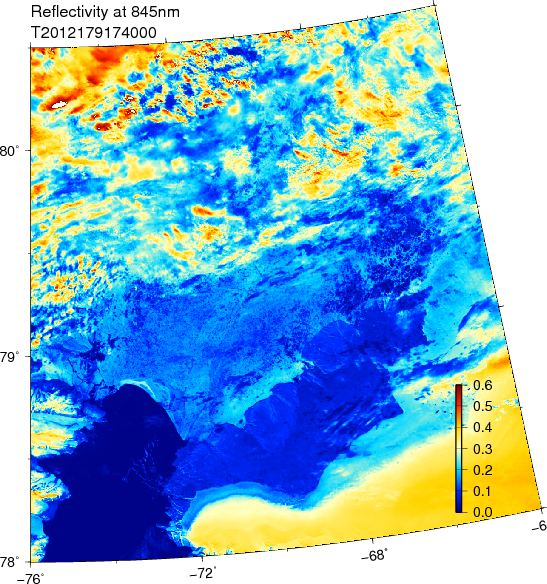
Ice-Bridge at southern Nares Strait on June-27, 2012 17:40 UTC from MODIS-Terra. Notice the crack and hairline fractures in the ice along the Ellesmere Island coast near 79 N latitude and 75 W longitude.

This collapse happens each year in the summer, though the timing varies from April for weak and July for strong arches. The arch in 2012 lasted longer than the one in 2011. No or only weak ice-arches formed at this site in 2007, 2008, and 2009, e.g., http://muenchow.cms.udel.edu/MODIS/.

EDIT-1: Same imagery, same gridding, but more focus and detail
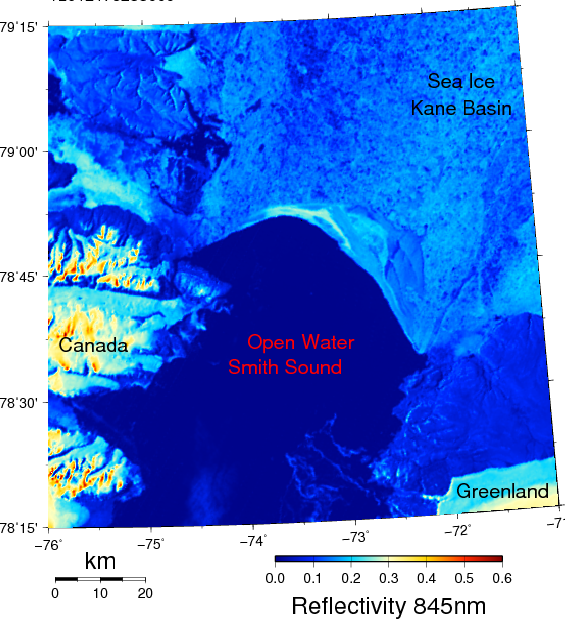
MODIS-Terra June-26, 2012 prior to collapse.
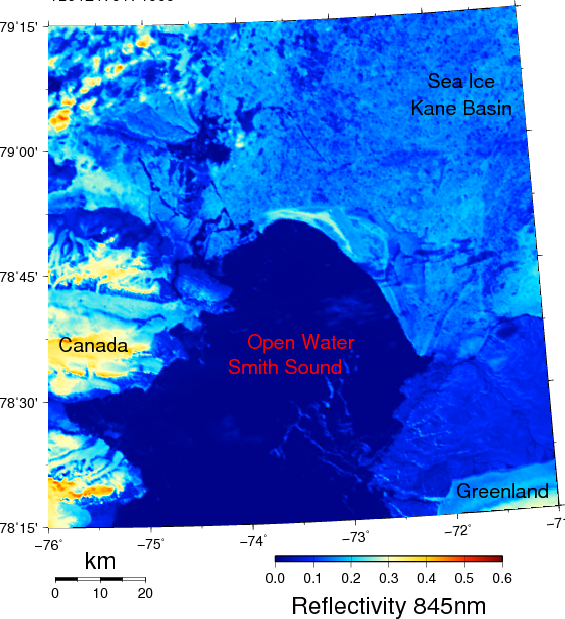
MODIS-Terra June-27, 2012 at the onset of collapse. Note the change near the Canada at 79 N latitude where open waters meets the sea ice.

EDIT-2: The moorings we try to recover this summer are to the north of Kane Basin and to the south where Petermann Fjord enters Nares Strait. This map shows it (also notice how badly the coastline of Greenland is surveyed):
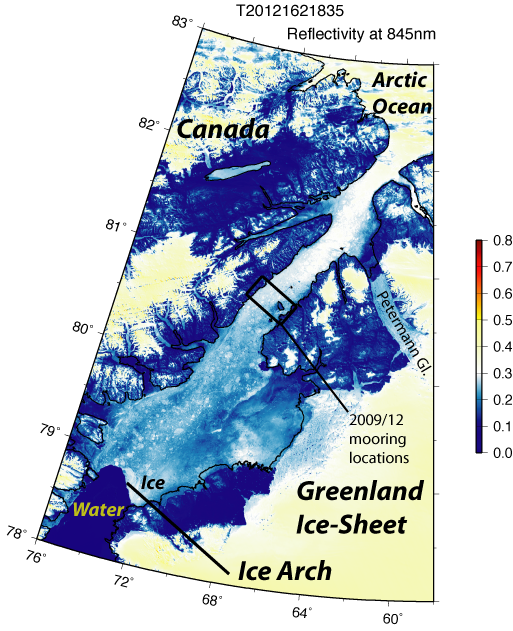
June-10, 2012 MODIS-Terra image showing location of moored array that was deployed in Aug. 2009 to be recovered in Aug. 2012.
Greenland’s Warming, Melting, and Sliding to Sea

Greenland is warming, Greenland’s warming is melting its ice, and Greenland melting ice is raising global sea level. All true, but it all has happened before during the last 100 years or so. Our technology to extract small signals buried deep in noise from both our backyard and remote Greenland is unprecedented. This skill should not fool us, that the large changes that we see in Greenland and elsewhere have not happened before. They have, but memory is a fickle thing, as “new” is exciting, while “old” is often forgotten and considered unimportant. Those who live in the past are doomed to miss the present, those who ignore the past, are doomed to repeat it. We need to learn from the past, live in the present, and prepare for the future.

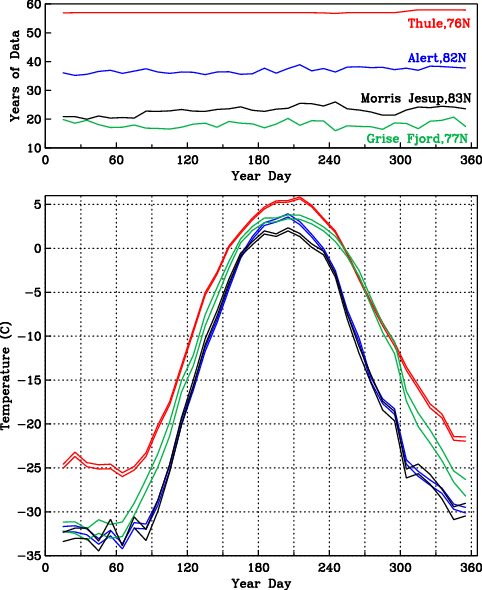
Preparing for an expedition to Nares Strait between northern Greenland and Canada in about 5 weeks, I am exploring temperature data from land, satellites, and ocean sensors to get a feel for what has changed. I started with data from weather stations such as the U.S. Air Force Base Thule , Canada’s former spy station Alert, and Denmark’s Station Nord about 700-1000 miles from the North Pole. So, it is cold up there:

Annual cycle of air temperature (bottom panel) from south to north at Thule (red), Grise Fjord (green), Alert (blue), and Cap Morris Jesup. Data years (top panel) for each year day are degrees of freedom. For each place two temperature curves indicate upper and lower limits of the climatological mean temperature for that day at 95\% confidence.

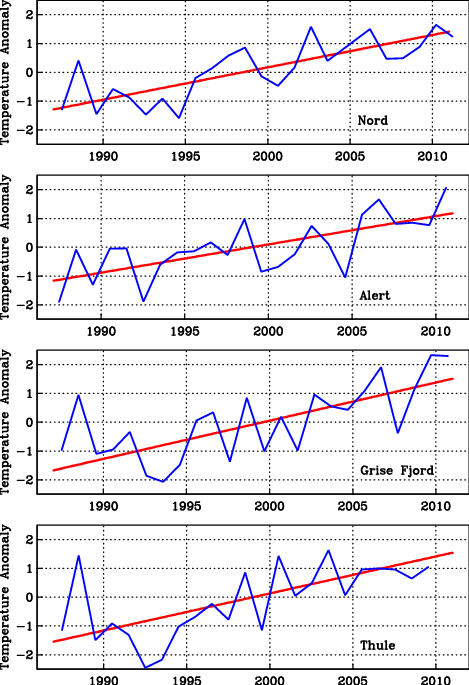
Well, we knew that, but the real question is: Has anything changed? Has Global Warming reached Greenland? The plot above does not tell, but this one does:

Annual averages and trends of air temperature anomalies for the 1987-2010 period for (top to bottom) Station Nord (Greenland), Alert (Canada), Grise Fjord (Canada), and Thule (Greenland). Scales are identical. The trends are fitted to daily, not annual data. The annual averages are shown for display purposes only.

To some it screams: “Warming, melting, Greenland is surging to sea.” [It is, but it did so before.]

There is lots of fancy signal processing that goes into this (see Tamino or a class I teach) to make a firm statement:

The air around northern Greenland and Ellesmere Island has warmed by about 0.11 +/- 0.025 degrees Celsius per year since 1987. North-west Greenland and north-east Canada are warming more than five times faster than the rest of the world.

This must be huge (yes, it is), it must have an effect on the Greenland ice sheet (yes, it does), and this must raise sea level (yes, perhaps 10 cm or 3 inches in 100 years, Moon et al., 2012).

Now where is the catch?

The catch is that my records all start in 1987, because that is the period for which I have actual measurements from all those stations. My satellite record is even shorter: it starts in 2000, but with lots of work can be extended back to 1978. And my ocean record is shorter yet: it starts in 2003. There just are no other hard data available from north-west Greenland.

So, does this mean we are stuck with the gloom and doom of a short record?

No, but we have to leave the comforts of hard, modern data with which to do solid science. People have to stick out their necks a little by making larger scale interferences. Based on the 1987-2010 results shown above, I can now say that trends and year-to-year variations are all similar in Alert, Thule, Kap Morris Jesup, etc., etc., so I will use the 60 year Thule record to make statements that somewhat represent all of Nares Strait. I could also start looking for softer and older data. With soft data I mean sketchy ship logs kept by whalers, tense expedition reports of starving explorers (Lauge Koch, Knud Rasmussen, Peter Freuchen), and imperial expeditions (George Nares, Adolphus Greely).

Further south there are a few ports where government or trading authorities started records early. The current capital of Greenland, Nuuk (formerly Godthab) is such a place. The Nuuk record starts 1881. And what I find is that the current warming in Greenland has happened just as dramatic as it does now in the 1920ies and 1930ies [well, except for the 2010 spike, but that story is still ongoing]:

Data from Nuuk, southern Greenland, where the temperature record goes back to 1881 (monthly data from NASA/GISS). The dashed line indicates 1987.

The trend is statistically significant, about 0.008 +/- 0.03 degrees centigrade per year or about 10 times smaller than what it is for northern Greenland starting in 1987. So the devil of Greenland warming, melting, and sliding to sea is in the details or records that are too short. The Global Warming signal is in there, but how much, we do not know and perhaps cannot know. Furthermore, most of the globe of “Global Warming” is covered by water and the ocean warming we know little about. Recall, my ocean record off northern Greenland only starts in 2003 and ends in 2009 or 2012, if we recover computers, sensors, and data from the bottom of Nares Strait this summer.

Greenland’s data and physics of ice, ocean, and air are exciting and all show dramatic change. To me, this is a big and fun puzzle, but one has to be careful and humble to avoid making silly statements for political purposes that are not supported by data. Do I think Global Warming is happening? Absolutely, yes. Do I think it is man-made? Probably. What do I do about it? I ride my bicycle to and from work every day. And that’s what I do next … bicycle home.

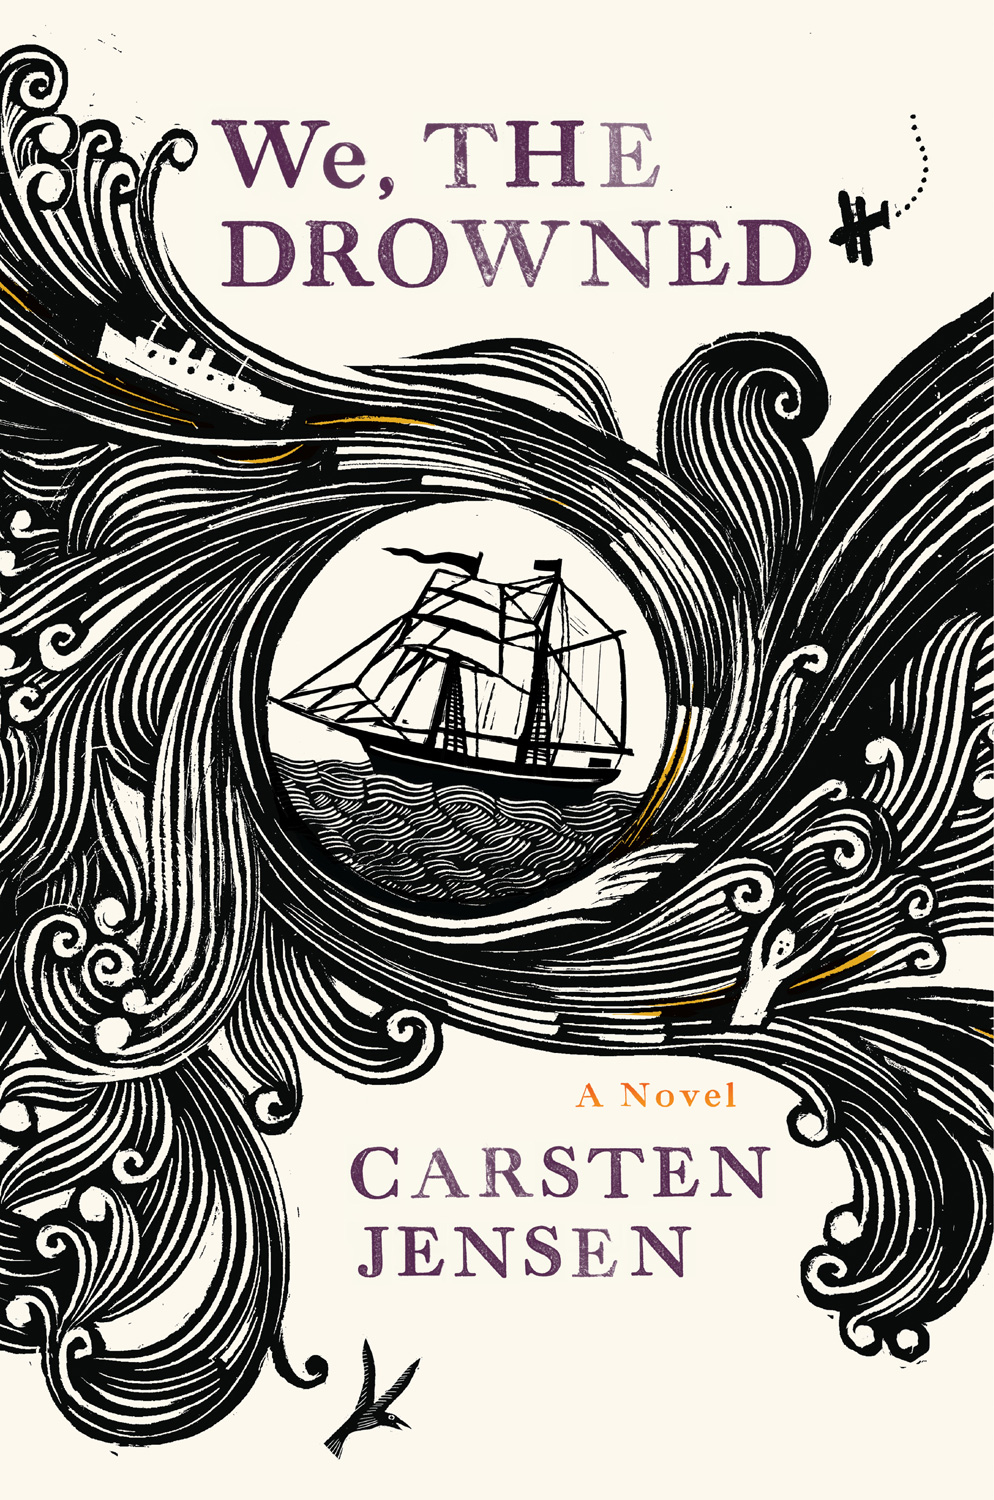
Book Review: We, the Drowned

An epic journey often ends at home. Odysseus was sailing home towards his wife and family, Jason and the Argonauts return home to Thessaly with the Golden Fleece, King Arthur’s Knights return to Camelot after they fail or succeed at their Grail Quest, and, in more modern literature, Frodo returns to the Shire. The hero of an epic fights to preserve his home, and is drawn back there after many adventures. Similarly, sailors paint their bodies with reminders of home: names of loved ones, swallows who travel far but always return to the nest, and navigational stars pointing them home.

Appropriately, Carsten Jensen’s novel We, the Drowned centers its epic tales of traveling the seven seas on the place all of the characters at one point call home: the port town of Marstal, Denmark. Spinning tales of adventure spanning more than a century, Jensen draws from the rich history of Marstal, where he grew up, as well as generations of nautical literature.

Told in a series of shorter stories, reading We, the Drowned is more like listening to the bedtime stories of childhood and the legends you hear around the campfire than reading a 700-page tome. The story loosely follows three generations of Marstallers as they are drawn to the magic and adventure of the sea, living their lives at the beck and call of King Neptune.

The tale begins with Laurids Madsen, the sailor who “went up to Heaven and came down again, thanks to his boots,” and who eventually disappears into an Australian port. The story of his son and their generation growing up is fraught with the misery of a sadistic teacher and lost fathers, but Albert, Laurids son, becomes determined to find him. Albert becomes a central focus of the book, representing Marstal’s past, present and future.

The stories range from shrunken heads and selfish traders to brutal wars and sweet romances. These adventures occur wherever the winds blow the sailors of Marstal, including the coasts of Pacific Islands, the Americas, the depths of Africa, and the frigid waters of the Arctic.

We, the Drowned is a fascinating nautical epic, exploring all of the fantastic, wonderful, terrible and awesome faces of the ocean and the people who travel King Neptune’s realm.

Nares Strait Ice Bridge and Arctic Ice Thickness Change

The ice of the Arctic Ocean is rapidly disappearing. This happens every summer, but for the last 30 years there is a little less ice left at the end of each summer than there was the year before. The areas covered by ice are not only shrinking, the ice is also getting thinner, or so many do believe.

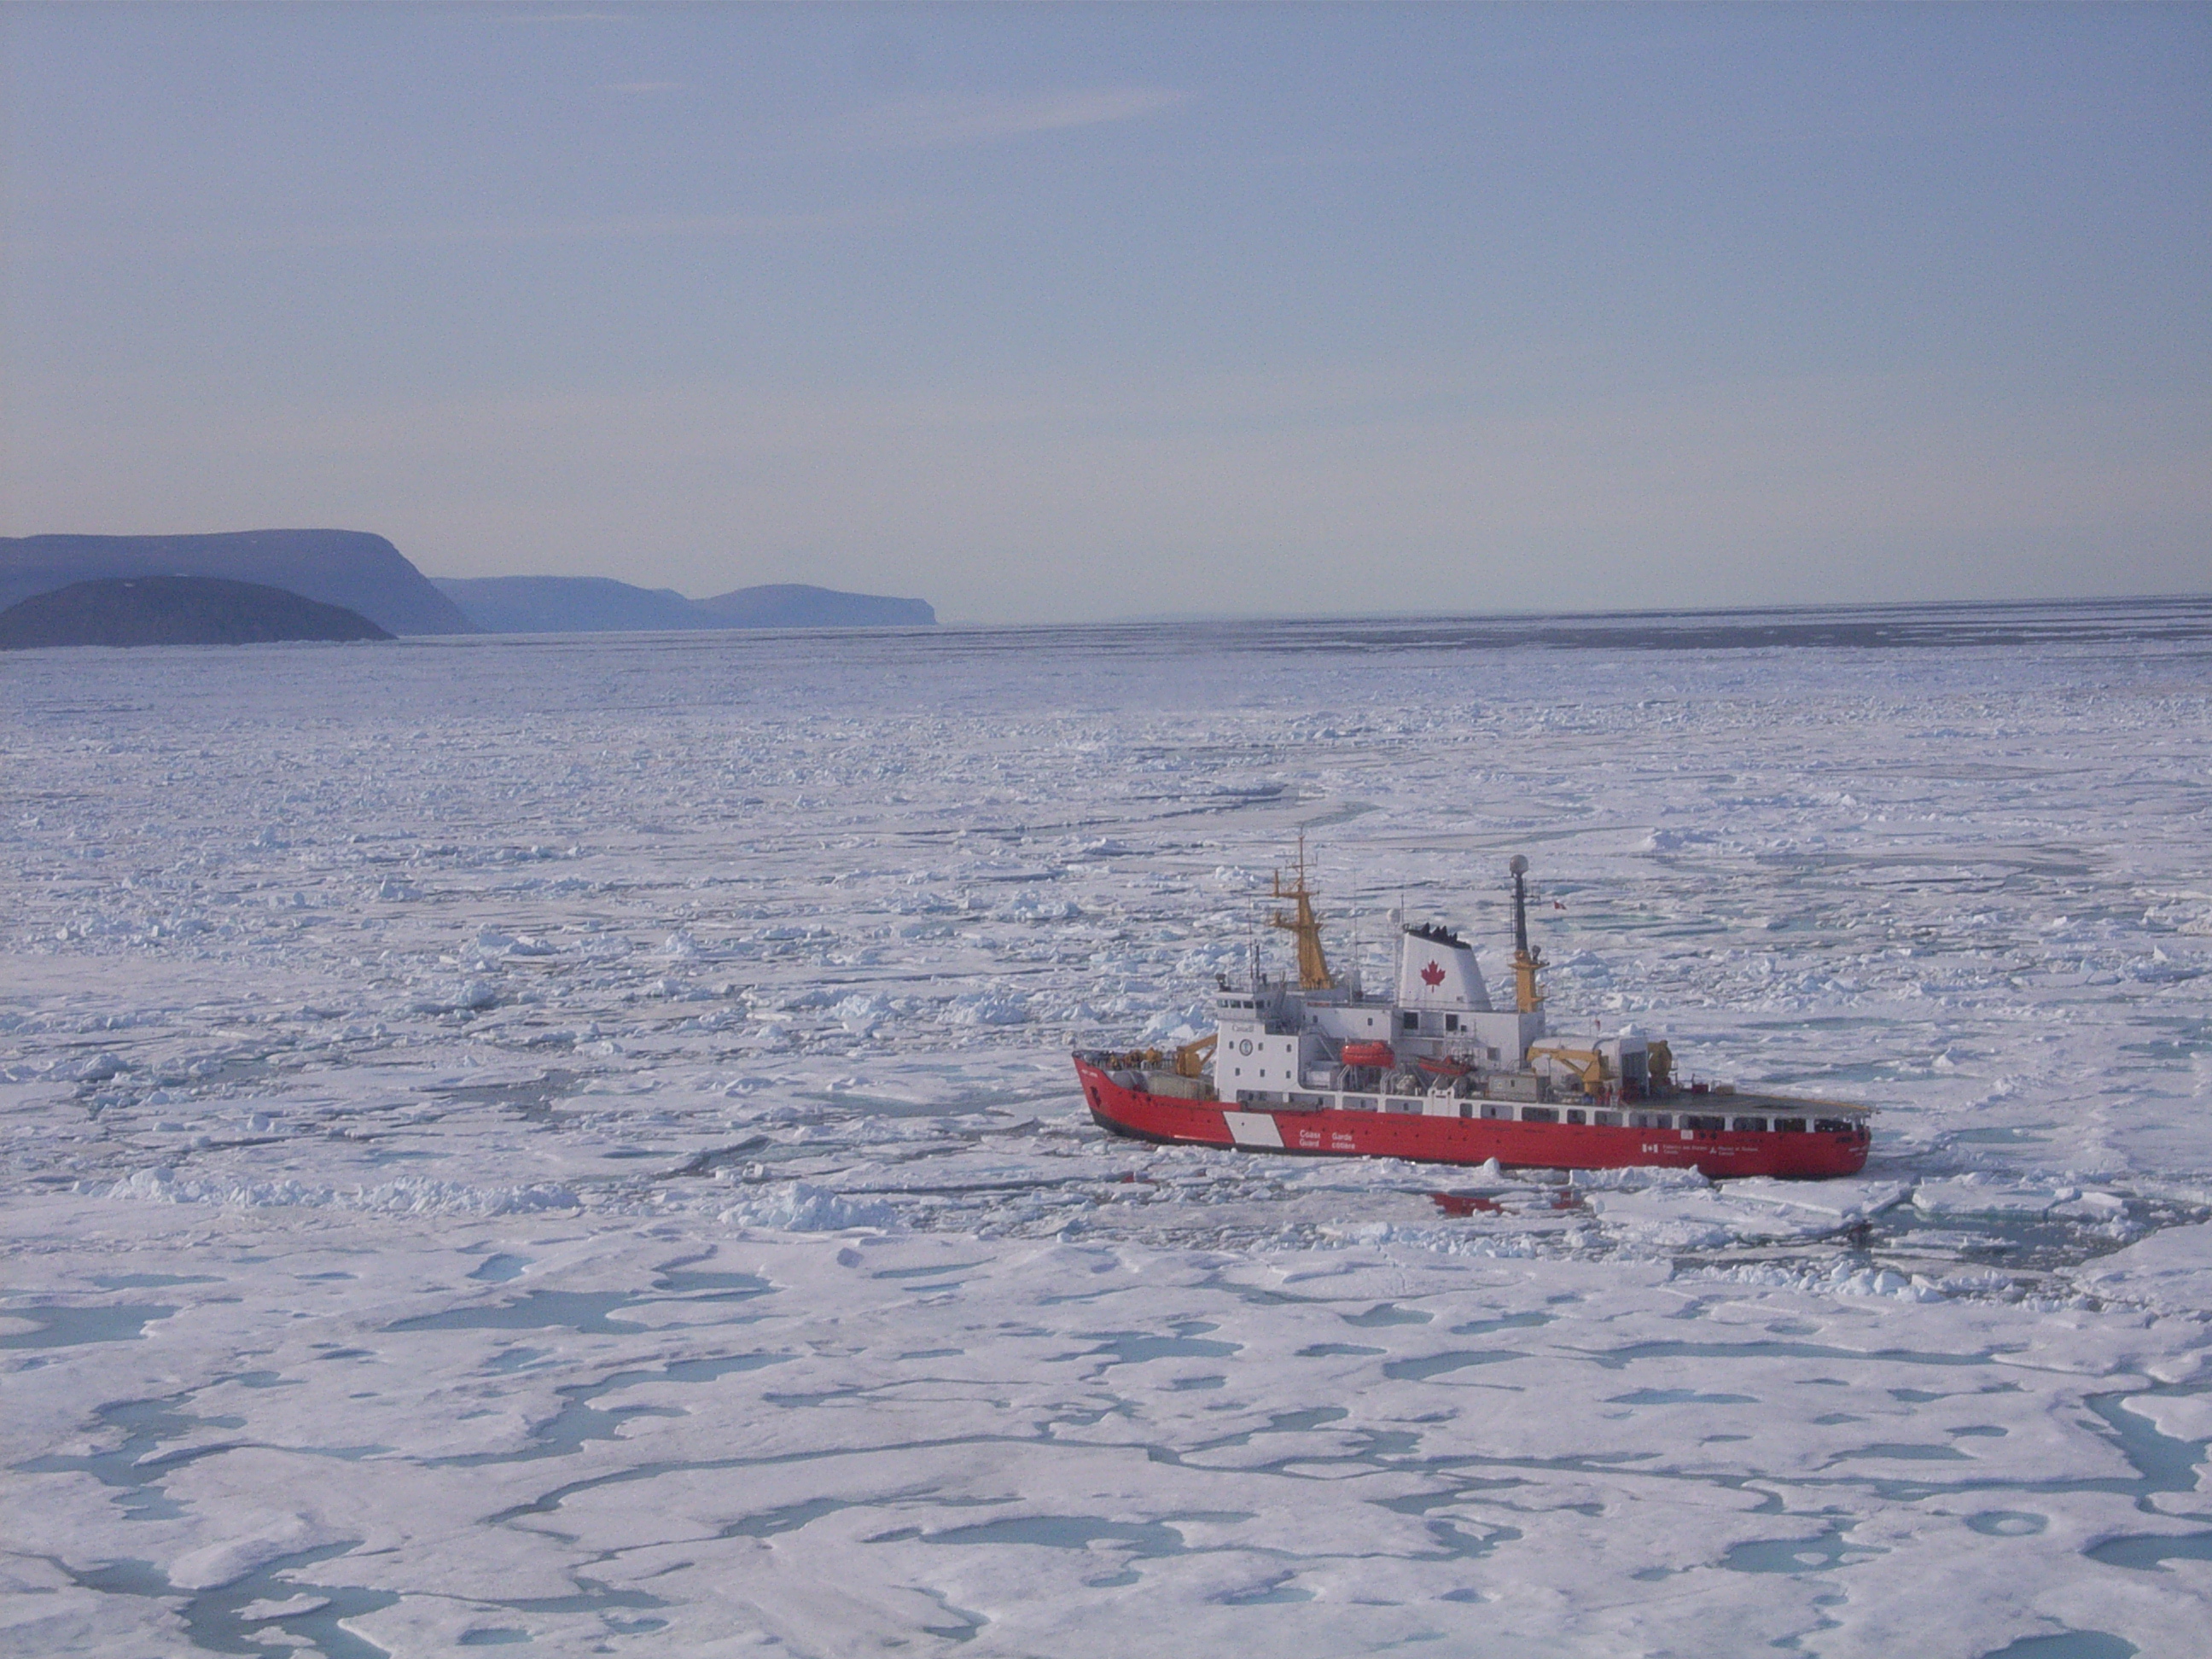
To check out such claims, we placed sound systems on the ocean floor of Nares Strait from which to find out how much the thickness of the ice above has changed. We started this in 2003, were told to stop it in 2009, but privately parked our instruments where they would collect data. We must get to check our sound systems and retrieve the private recordings, because otherwise Poseidon will claim our possessions for parking violations. The Canadian Coast Guard Ship Henry Larsen, we hope, will help us to negotiate water and ice to get us deep into Nares Strait as she and her crew did so well in 2006, 2007, and last in 2009.

CCGS Henry Larsen in thick and multi-year ice of Nares Strait in August 2009. View is to the south with Greenland in the background. [Photo Credit: Dr. Helen Johnson]

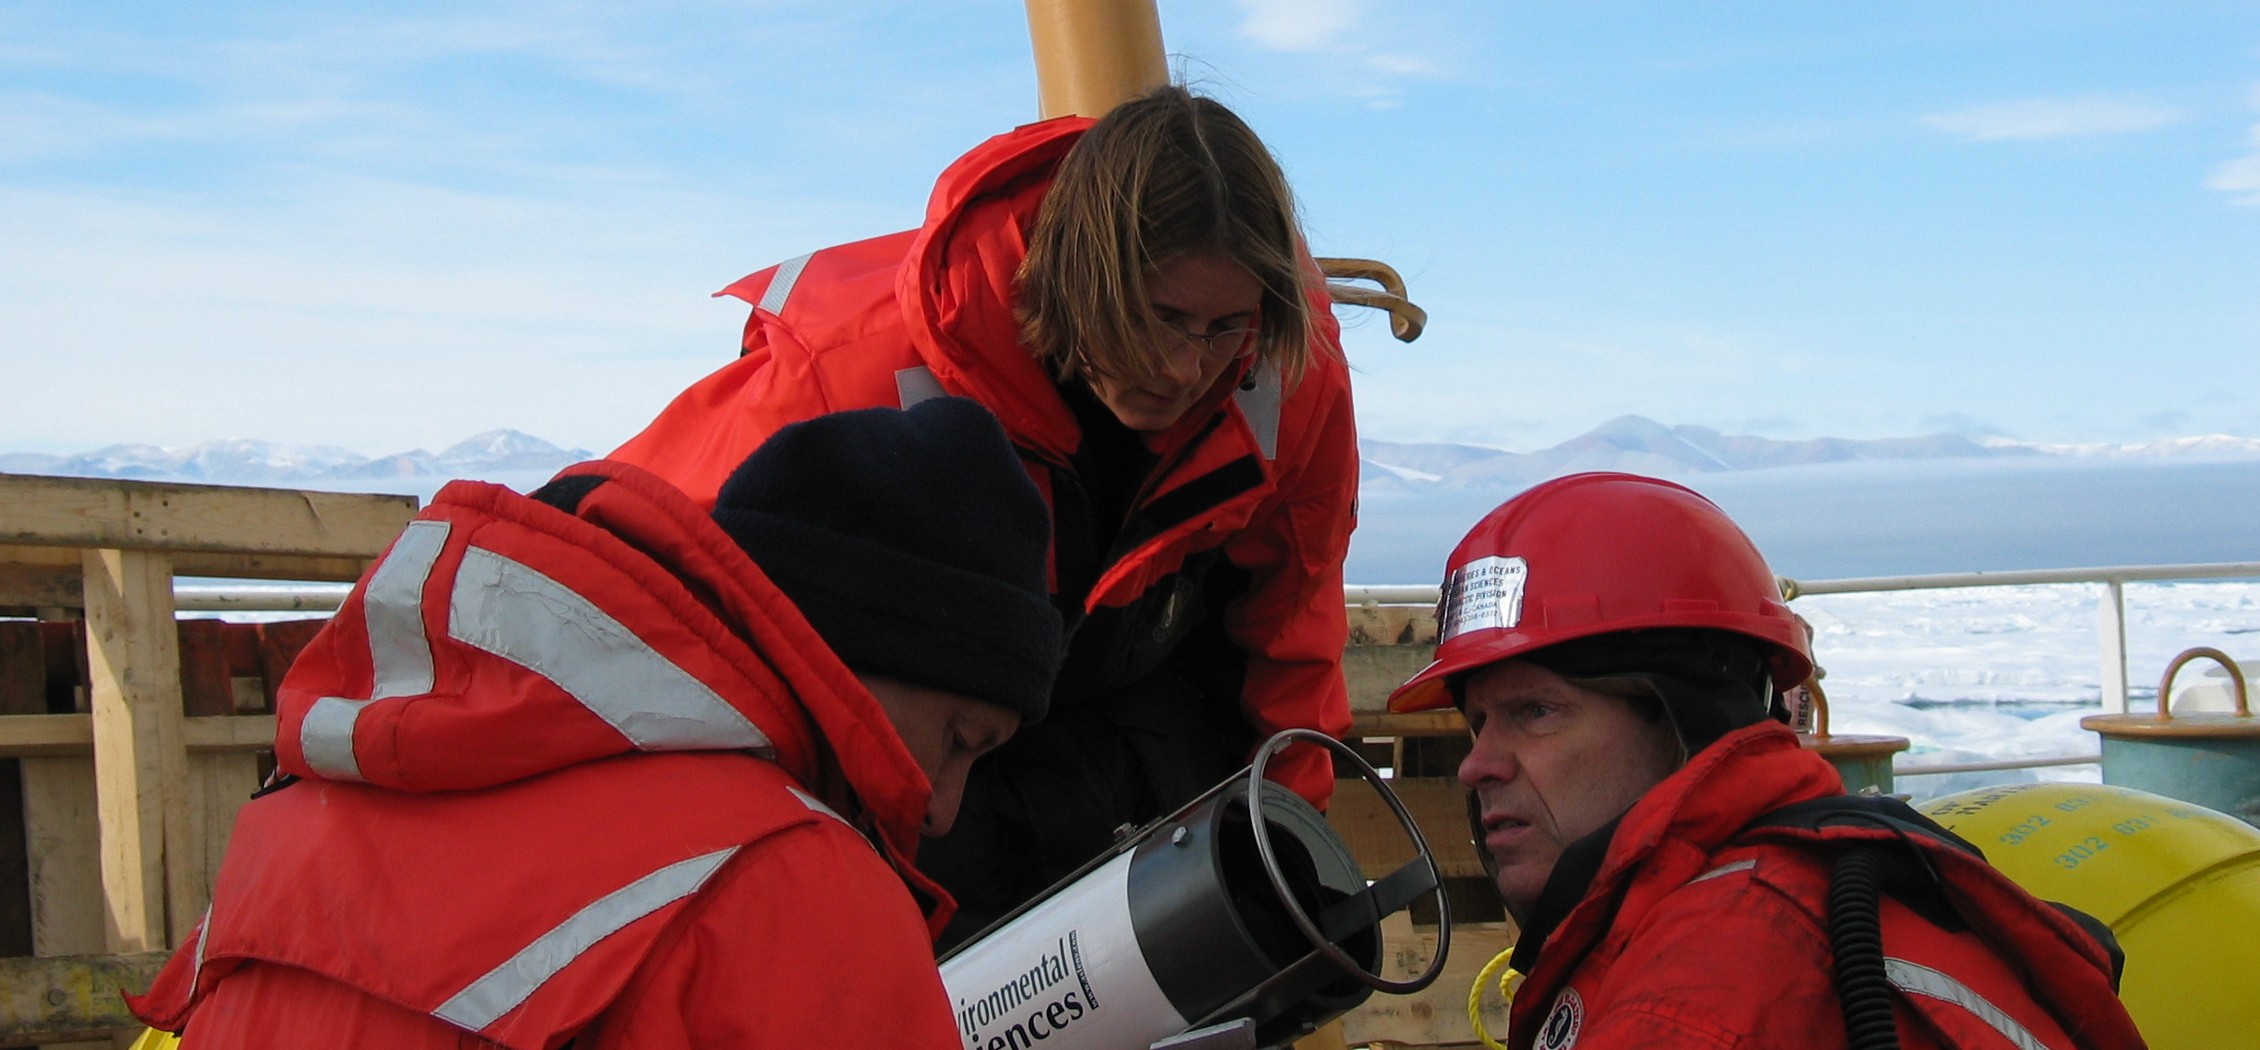
The ice profiling sonar sounds system before its first deployment in Nares Strait in August 2003 from aboard the USCGC Healy. It measure ice thickness many times each seconds for up to 3 years. View is to the north-west with Ellesmere Island, Canada in the background. Listening in are Jay Simpkins (left), Helen Johnson, and Peter Gamble.

Nares Strait to the west of northern Greenland is one of two major gates for the thickest, the hardest, and the oldest ice to leave the Arctic for the Atlantic Ocean [Fram Strait to the east of Greenland is the other.] This gate is closed at the moment by an arching ice bridge that locks all ice in place. No ice can leave the Arctic via Nares Strait as long as these arches hold. The ice arch acts as a dam that holds back the flood of ice that will come streaming south hard once the dam breaks. And break it will, usually between the end of June and July.

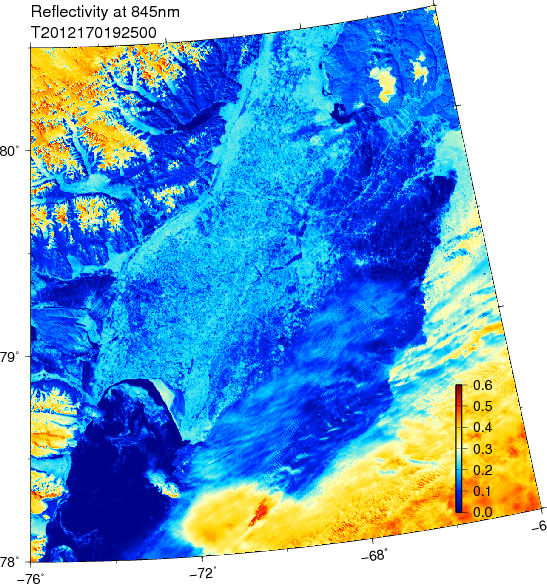
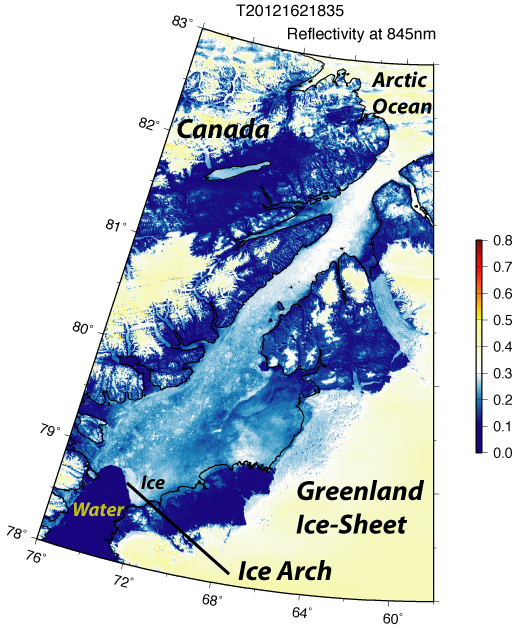
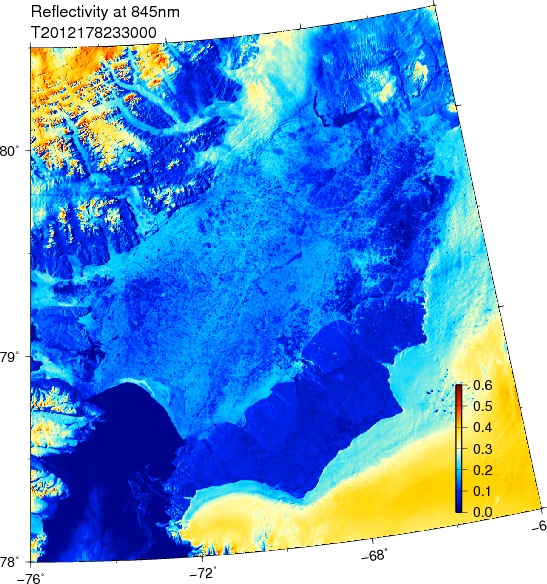
Ice arch in southern Nares Strait as seen by MODIS Terra on June-18, 2012. Greenland is on the right, Canada on the left. The dark blue colors in the bottom-left are open water, yellow are the ice caps of Greenland and Ellesmere Island and lighter shades of blue are warm ice or land. Humboldt Glacier is the on the right-center where Nares Strait is at its widest with Kane Basin at about 80 N latitude.

Nares Strait Jun.-10, 2012 image showing land-fast ice between northern Greenland and Canada as well as the ice arch in the south (bottom left) separating sea ice from open water (North Water). The coastline is indicated as the black line.

The sooner it breaks, the more old ice the Arctic will lose and the better it is for us to get an icebreaker to where must be to recover our instruments and data. The data will tell us if the ice has changed the last 9 years.

I processed and archived maps of Nares Strait satellite images to guide 2003-2012 analyses of how air, water, and ice change from day to day. Ice arches formed as expected during the 2003/04, 2004/05, and 2005/06 winters lasting for about 180-230 days each year. In 2006/07 no ice arch formed, ice streamed freely southward all year, and this certainly contributed to the 2007 record low ice cover. In 2007/08 the arch was in place for only 65 days. In 2009/10, 2010/11, and now 2011/12 ice cover appear normal as the arches formed in December and lasted until July.

We live in exciting times of dramatic change, some to the better and some to the worse. Some of the change is caused by global warming while most is probably not. We do not know for sure, but most of the evidence points towards us people as a major driver of the change we observe in the Arctic and elsewhere. Nevertheless, climate and its change is one grand puzzle that no single scientist, no single discipline, no single country, and no single continent can solve. There are many pieces that all contribute to how and why the Arctic ice changes the way it does. And this includes the ice arches of Nares Strait. There are many mysteries and unresolved physics in what makes these ice arches tick and what makes them blow to bits, but blow they will … watch it, it’s fun, and perfectly natural.

EDIT: This movie shows just how stable the ice arch is at the moment.

Petermann Ice Islands Stuck in Ice

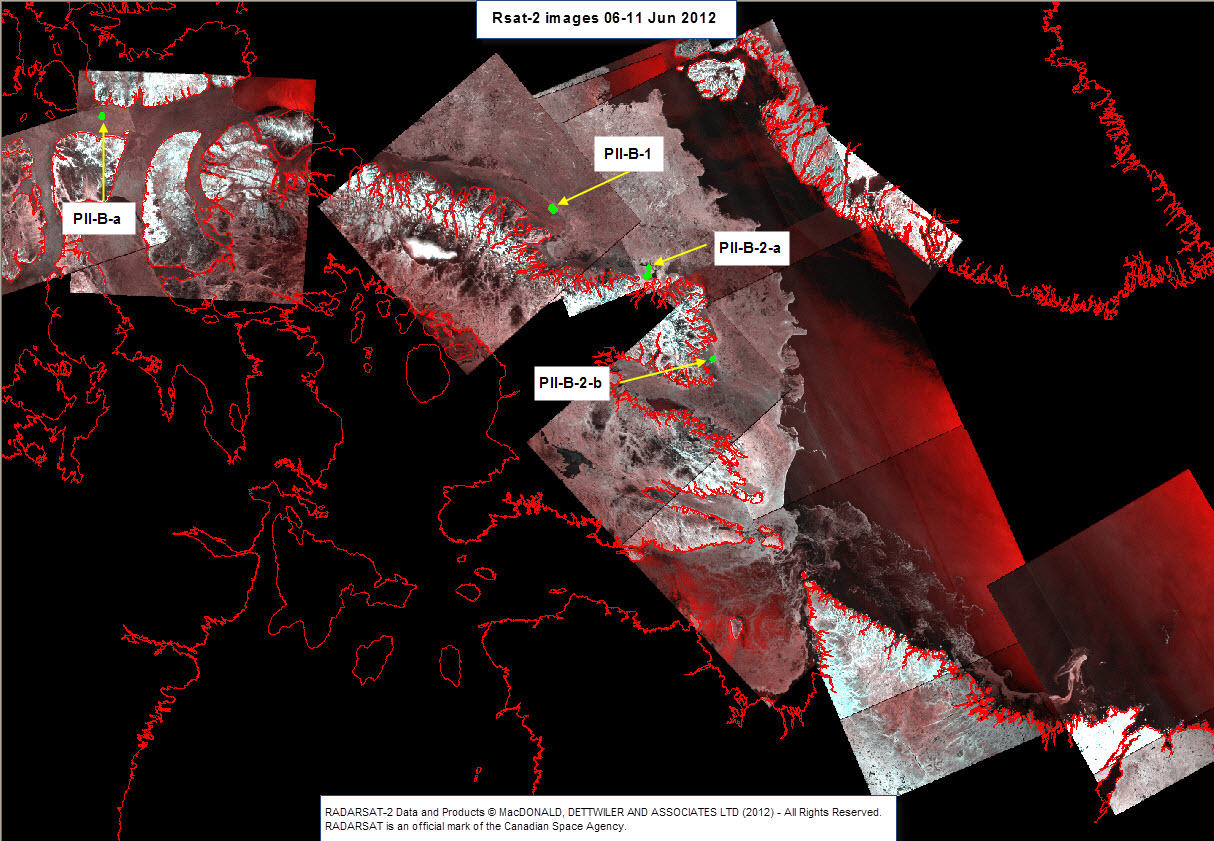
Several pieces of the Manhattan-sized ice island that broke off Petermann Glacier, Greenland in 2010 arrived, dispersed, and melted off Newfoundland last summer. They provided stunning displays visible to the naked eye from the coast. The Canadian Ice Service just distributed this set of radar images showing 4 pieces that are all grounded and/or stuck in ice. None are moving.

Overview of fragments of Ice Islands that broke off Petermann Glacier, Greenland in 2010 as of June-11, 2012 from RadarSat composites. [Credit: Luc Desjardins, Canadian Ice Service]

In the open ocean ice is moved by winds stressing the ice from above and by ocean currents stressing the ice from below. Typical sea ice varies in thickness from 1-5 meters (3-15 feet) which is much less than the 30-130 meters (90-400 feet) thick ice islands. Winds thus push thick ice islands much less than they do push the thinner sea ice. Thick ice islands are moved by ocean currents, not winds.

This is why oceanographers like myself love these bits of ice islands to bits: they tell us about the ocean below the surface that satellites do not see, but, sadly, all fragments are stuck either to the seafloor in shallow coastal waters or are cemented in place by immobile sea ice that is “land-fast:” Think of it as ice that is glued to land and to each other. This sheet of glued-together ice extends some distance offshore. The distance can be a few yards during a cold winter night in Maine or 100s of miles off Siberia. Offshore islands, rocky outcroppings, or grounded ice islands all anchor land-fast ice by adding local support and thus strength and stability to the immobile land-fast ice.

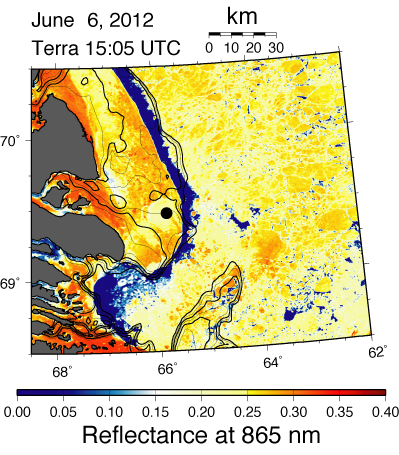
Too much talk, lets explain this with an image of the largest ice islands, called PII-B1. It is about 4 km wide and 9 km long. I dropped a black dot in its center as it is hard to see where to look in this image. I also show land in grey, open water in blue, and ice in shades of white and yellow:

Land-fast and mobile sea ice off Baffin Island with Petermann Ice Island PII-B1 grounded near the 150 meter isobath (black dot). Thick lines are 100, 200, and 300-m bottom depths. MODIS Terra data at 250-m resolution from June-6, 2012, 15:05 UTC.

There is clearly a 30-km wide band of ice attached to the land with a line of blue water separating it from ice that is mobile and has different signatures. A blue band of ocean has emerged, I speculate, as the result of winds from the south that moved the mobile ice to the north-east (to the right in the image). Neither the land-fast nor the grounded ice island PII-B1 embedded in it moved, so open water appears where there was mobile ice before. This is called a shore lead and I bet there are plenty of seals and whales feasting there now. Note also the arched entrance to Home Bay (bottom left) where loose ice is scattered towards the headland of Henry Kater Peninsula.

As summer is arriving fast in the Arctic, the land-fast ice will disappear, breaking up as the sun and air above and the ocean below weakens the ice by melting. This will expose the thicker ice islands and icebergs to wind-forced storms and waves more violently than it does now. And even those ice island grounded to the bottom of the ocean in shallow water will become free during a time of higher than normal sea level, perhaps during a spring tide, perhaps during strong winds from the north. Then these currently stuck-in-the-ice ice islands will continue their journey south towards Newfoundland and the Atlantic Ocean that they began in 2010 when they were born in northern Greenland.

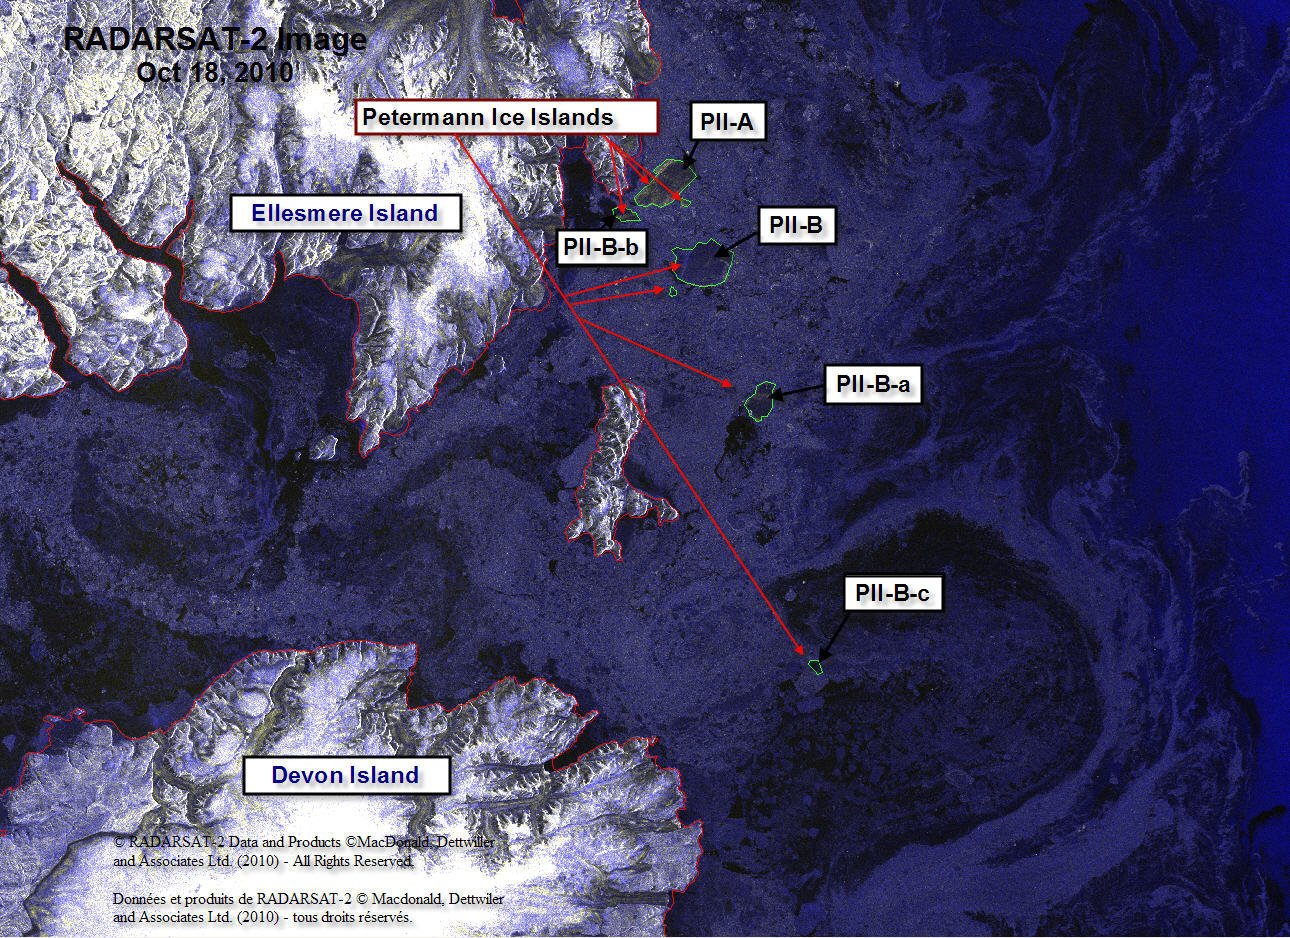
EDIT: For context I append an earlier RadarSat image from October-18, 2010 when all segments were much closer in space.

Petermann Ice Islands in northern Baffin Bay of Coburg Island, Canada at 76 N latitude on Oct.-18, 2010, about 2 month after they separated from Petermann Glacier, Greenland at 81N latitude. [Credit: Luc Desjardins, Canadian Ice Service]