Tag Archives: physics

Ice Thickness in Nares Strait 2008 and 2009

[Editor’s Note: Undergraduate Julie Jones of the University of Delaware summarizes her work that was supervised by Helga Huntley as part of an NSF-funded summer internship.]

Three years ago in 2009 Andreas Muenchow left from Delaware for Greenland with students Pat Ryan and Berit Rabe to recover instruments that recorded salinity, temperature, current velocities, and ice thickness in Nares Strait since 2007.  This summer, I used those observations to estimate ice thickness for April through June in 2008 and compare them to estimates for the same spring period in 2009.  An ice bridge had formed in 2008 but not in 2009.  Working as a group, we wanted to investigate the effect of ice arches on the ice thickness.  Allison Einolf, another summer intern who focused on ocean currents during the same time periods and Andreas produced these maps that introduce the study area, spatial ice cover, and mean ocean currents:

Image

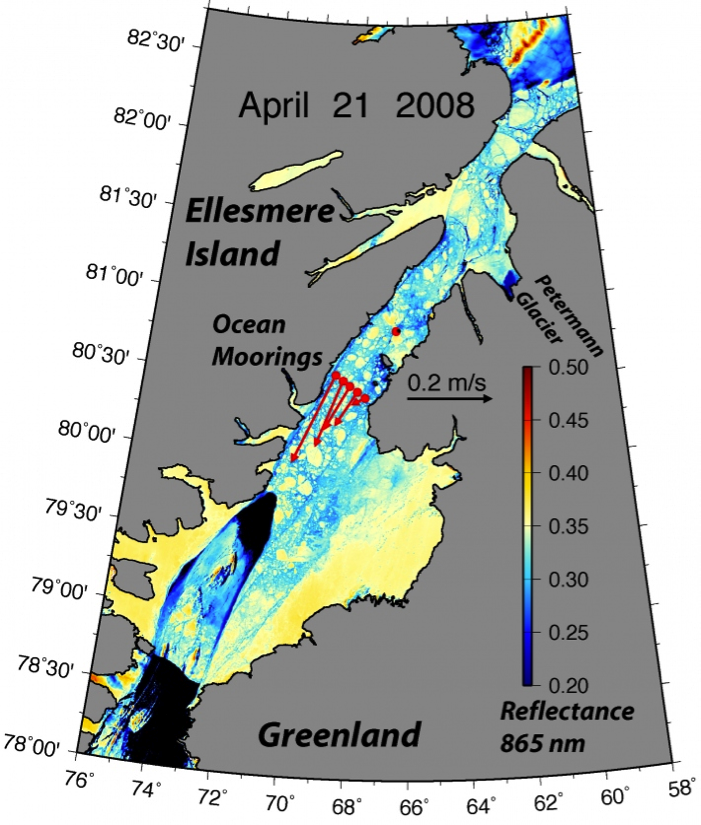
Nares Strait MODIS satellite imagery of the study area and ice arch April 21, 2008. Red dots are instrument locations. Arrows show current velocities.

Image

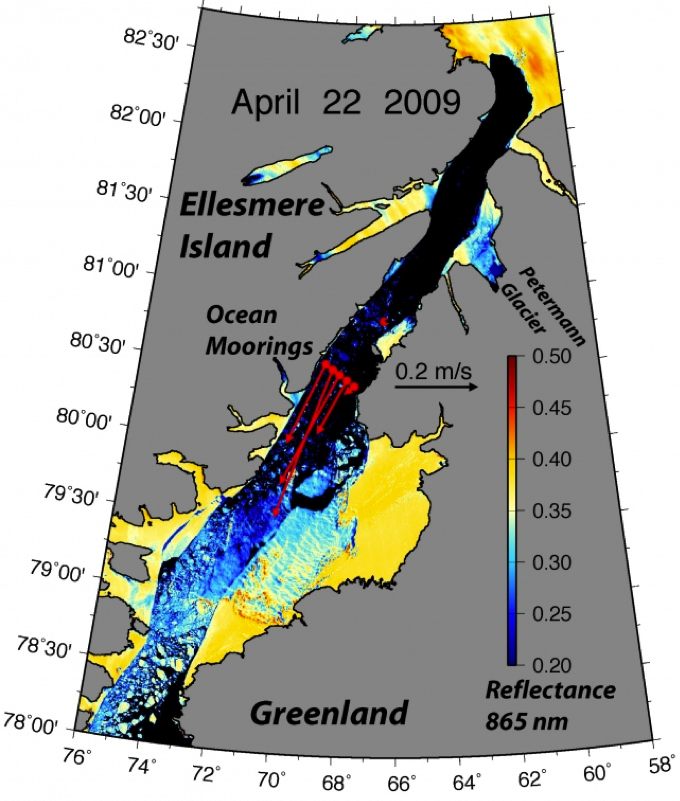
Nares Strait MODIS satellite imagery of the study area and ice arch April 22, 2009. Red dots are instrument locations. Arrows show current velocities. Note the lack of the southern ice arch, but the presence of one north of the study area.

I used Matlab for most of the data processing, more specifically the Ice Profiling Sonar (IPS) Processing Toolbox for Matlab provided by the manufacturer of the instrument that collected the data: ASL Environmental Sciences, Inc. First I transformed the data from the IPS instrument into a range time series.  I then manually “despiked” the data, taking out any data points that were likely due to bubbles or fish within the acoustic path from the sensor system to the ice above and back.  In a second step I wrote a function using sound speed data from Andreas, atmospheric pressure from Dr. Samelson at Oregon State University, and pressure (depth) data from the IPS instrument to get a time series of the thickness of the ice.  In a third step I applied a Lanczos raised cosine filter that was taught as part of a 2012 Summer Intern Page Workshop. Hence I finally had some nicely filtered data for the periods of the April-June of 2008 and 2009.

Now the results:  Just as we expected, there was much thicker ice in the 2008 spring with a southern ice arch present than there was in the spring of 2009 when no such ice arch was present:

Histogram for April – June 2008 ice. There is a peak at 3 meters, with almost 25% of the ice that thick.

Histogram for April – June 2009 ice. The ice does not get thicker then 2 meters with most of the ice thinner than one meter.

The histograms show thicker ice in 2008, about 2-6 meters on average and with some ice even reaching 10 meters.  In 2009, the ice doesn’t get thicker than 2 meters with most of the ice being thinner than 1 meter.  More specifically, the mean ice thickness for April – June 2008 (2009) is 3.8 (0.58) meters with a standard deviation of 1.8 (0.29) meters.  This further shows that there was thicker ice in 2008 than there was in 2009.  I attributed the cause for the thin 2009 ice to ice flowing freely through Nares Strait all winter and spring as no ice arch in the south blocked such flow.  The ice, thus, did not spend enough time in the high Arctic to thicken.

I noticed something else in my histograms when the 2008 ice bridge collapsed.

April 2008 ice thickness

May 2008 ice thickness

June 2008 Ice Thickness

The monthly histograms show that the ice in April and May is thicker than the ice in June.  We know that the 2008 ice bridge collapsed near June 6th, so it is interesting and it makes a lot of sense that the ice in June would be thinner than the ice two months earlier.

The mean ice thickness for April 2008 was 4.6 meters with a standard deviation of 2.40 meters.  In May 2008 the mean ice thickness was 3.5 meters with a standard deviation of 1.40 meters.  Lastly, in June the mean ice thickness was 3.5 meters with a standard deviation of 1.30 meters.  The ice thickness decreased after April and the variability decreases in June, which helps detect the bridge collapse in the data.

Lastly here are the filtered time series of April – June of 2008 and 2009.

Filtered time series for April – June 2008

Filtered time Series for April – June 2009 with the same scale as 2008 (above figure)

Filtered time series for April – June 2009 with a different scale to see the variability over time more clearly.

Hopefully we can see more interesting and exciting results from the instruments that the Nares Strait team picked up this summer even though they were hit hard by the 2010 Petermann Ice Island!

Two Ice Profiling Sonars (IPS) aboard the CCGS Henry Larsen in Aug.-2012. The protective stainless steel frame was bent by the 2010 ice island that hit both instruments in Sept.-2010. [Photo Credit: Andreas Muenchow]

Nares Strait Ice Bridge and Arctic Ice Thickness Change

The ice of the Arctic Ocean is rapidly disappearing. This happens every summer, but for the last 30 years there is a little less ice left at the end of each summer than there was the year before. The areas covered by ice are not only shrinking, the ice is also getting thinner, or so many do believe.

To check out such claims, we placed sound systems on the ocean floor of Nares Strait from which to find out how much the thickness of the ice above has changed. We started this in 2003, were told to stop it in 2009, but privately parked our instruments where they would collect data. We must get to check our sound systems and retrieve the private recordings, because otherwise Poseidon will claim our possessions for parking violations. The Canadian Coast Guard Ship Henry Larsen, we hope, will help us to negotiate water and ice to get us deep into Nares Strait as she and her crew did so well in 2006, 2007, and last in 2009.

CCGS Henry Larsen in thick and multi-year ice of Nares Strait in August 2009. View is to the south with Greenland in the background. [Photo Credit: Dr. Helen Johnson]

The ice profiling sonar sounds system before its first deployment in Nares Strait in August 2003 from aboard the USCGC Healy. It measure ice thickness many times each seconds for up to 3 years. View is to the north-west with Ellesmere Island, Canada in the background. Listening in are Jay Simpkins (left), Helen Johnson, and Peter Gamble.

Nares Strait to the west of northern Greenland is one of two major gates for the thickest, the hardest, and the oldest ice to leave the Arctic for the Atlantic Ocean [Fram Strait to the east of Greenland is the other.] This gate is closed at the moment by an arching ice bridge that locks all ice in place. No ice can leave the Arctic via Nares Strait as long as these arches hold. The ice arch acts as a dam that holds back the flood of ice that will come streaming south hard once the dam breaks. And break it will, usually between the end of June and July.

Ice arch in southern Nares Strait as seen by MODIS Terra on June-18, 2012. Greenland is on the right, Canada on the left. The dark blue colors in the bottom-left are open water, yellow are the ice caps of Greenland and Ellesmere Island and lighter shades of blue are warm ice or land. Humboldt Glacier is the on the right-center where Nares Strait is at its widest with Kane Basin at about 80 N latitude.

Nares Strait Jun.-10, 2012 image showing land-fast ice between northern Greenland and Canada as well as the ice arch in the south (bottom left) separating sea ice from open water (North Water). The coastline is indicated as the black line.

The sooner it breaks, the more old ice the Arctic will lose and the better it is for us to get an icebreaker to where must be to recover our instruments and data. The data will tell us if the ice has changed the last 9 years.

I processed and archived maps of Nares Strait satellite images to guide 2003-2012 analyses of how air, water, and ice change from day to day. Ice arches formed as expected during the 2003/04, 2004/05, and 2005/06 winters lasting for about 180-230 days each year. In 2006/07 no ice arch formed, ice streamed freely southward all year, and this certainly contributed to the 2007 record low ice cover. In 2007/08 the arch was in place for only 65 days. In 2009/10, 2010/11, and now 2011/12 ice cover appear normal as the arches formed in December and lasted until July.

We live in exciting times of dramatic change, some to the better and some to the worse. Some of the change is caused by global warming while most is probably not. We do not know for sure, but most of the evidence points towards us people as a major driver of the change we observe in the Arctic and elsewhere. Nevertheless, climate and its change is one grand puzzle that no single scientist, no single discipline, no single country, and no single continent can solve. There are many pieces that all contribute to how and why the Arctic ice changes the way it does. And this includes the ice arches of Nares Strait. There are many mysteries and unresolved physics in what makes these ice arches tick and what makes them blow to bits, but blow they will … watch it, it’s fun, and perfectly natural.

EDIT: This movie shows just how stable the ice arch is at the moment.

Ice Arches and Gothic Cathedrals

Soaring towards heaven awash in light, Gothic Cathedrals awed medieval kings, jesters, and peasants alike. Their upward pointing arches allowed walls of stained windows to filter light into these massive buildings when most dwellings from royal castle to decrepit hut were dark, damp, and filthy. While the power of god was both invoked and abused, it was physics and engineering that allowed these cathedrals to scrape the skies. A delicate balance of forces is of the essence to avoid accelerations and collapse.

Arched windows within an arch inside the Cathedral of Reims, France.

Hence it should not surprise that ice arches buttressed by land show similar elegance and stability, but also dramatic collapse. When these ice arches form and collapse is one factor to determine when the Arctic Ocean will be free of ice in summer.

June-10, 2012 ice arch in Nares Strait between northern Greenland and Canada. The arch has been in place since Dec.-8, 2011.

Nares Strait Jun.-10, 2012 image showing land-fast ice between northern Greenland and Canada as well as the ice arch in the south (bottom left) separating sea ice from open water (North Water).

The Nares Strait ice arch forms between December and April most winters. Unlike the medieval cathedrals it consists of blocks of ice. Once in place, the arch shuts down all ice movement. The ocean water under the ice moves undisturbed southward sweeping newly formed ice away. This creates the North-Water polynya, first reported by William Baffin in his ship logs in 1616. The North Water supports wild life for millenia providing food and trading items for people. Even viking remnants from the time the first Gothic Cathedrals were built in Europe were found here: sections of chain mail, iron point blades, cloth, and boat rivets.

I want the ice arch in Nares Strait to collapse as soon as possible so that a Canadian ice breaker can get us to where we like to recover instruments and data that we deployed in 2009. And while I researched the stability of ice arches and studied Moira Dunbar’s 1969 satellite imagery, I came across a wonderful NOVA broadcast on medieval skyscrapers of glass and stone.” PBS stations will show it on Sept.-9, 2012.

Digging a little deeper, I also found a series of Open University podcasts and videos. My favorite 3-minute segment covers lines of thrust where barely connected irregular blocks of wood form a surprisingly stable yet wobbly arching bridge. If you want to build your own arch, then play interactively for fun with the physics of stone arches.

Since I want to understand and predict when the ice arch of Nares Strait collapses, I must understand how medieval architects and engineers designed their Gothic Cathedrals. I will also need understand why some cathedrals are still standing while others collapsed. My icy building blocks in Nares Strait are not as solid as the stones of Reims Cathedral, but unlike the medieval scientists, today we have computers and mathematics to help … as well as more than 800 more years of experience in science and engineering.

Ice Island Flotilla From Petermann Glacier Continue Southward Flow

More icebergs and ice island from Greenland are heading south along northern North-America this year. Petermann Glacier’s first piece arrived last year off Newfoundland causing a local tourist sensation for a stunning display of ice along its shores. There are many more pieces from Petermann to come for a few more years.

Track of Petermann Ice Island from Aug.-2010 through Aug.-2011 traveling in shallow water from northern Greenland along Baffin Island and Labrador to Newfoundland.

April 29/30, 2012 locations of Petermann Ice Island 2010 on their way south along northern North America. [Credit: Luc Desjardins, Canadian Ice Service]

Yet, how come that these arrivals are both so predictable in their pattern, but are almost impossible to pin down for an exact location and time? The answer involves mystical and fake forces, stunningly beautiful experiments, elegant mathematical equations, and, most important of all: spin.

The earth spins rapidly around its axis and neither ocean nor glaciers leave the planet for outer space. The obvious answer that gravity holds all the pieces in place is neither the correct nor the full answer. A subtle balance of several other forces makes Planet Earth the perfect place to keep us supplied with water to drink and air to breath. Additional forces besides gravity relate to the difference in pressure between the top and the bottom of the ocean as well as the rotational force that forces our car off the road if we speed too fast around a curve. The net effect of these is that earth fatter at the equator than at the North Pole. There appears to be more of gravity pulling us in at the North Pole than there is at the equator. Put another way, a scale measuring our own weight dips almost a pound more in Arctic Greenland than it does in the tropical forests of Borneo even if we do it naked in both places. Lose a pound of your weight instantly, travel to the far north. (GRACE)

This makes no sense intuitively, but common sense and intuition help little when it comes to how the ocean’s water and the atmosphere’s air move on a rotating planet. For example, we all know intuitively that a down-pour of rain flows down a slope into the ditch. It requires work to bring water up to the top of a hill or into the water towers to make sure that water flows when we open the faucet. Not true for the ocean at scales that relate to climate, weather, and changes of both. Here all water flows along, not down the hill. Better yet, it requires no work at all to keep it moving that way for all times. This is why Greenland’s ice keeps coming our way as soon as pieces break off. The earth’s spin makes it go around the hill, to speak loosely of pressure differences. Winds and friction have little effect. The ocean’s natural and usually stable state is in geostrophic balance. Geostrophy is a fancy word for saying that the ocean’s water flows along, not down a hill, because it is balanced by a fake and mystical Coriolis force that I will not explain. I teach a graduate class on Geophysical Fluid Dynamics for that.

In technical language, most of the oceans tend to flow along not down a pressure gradient. A kettle of boiling water discharges water from high pressure inside the kettle to the lower pressure in the kitchen. Yet the steam dissolved in the atmosphere moves around high or low-pressure systems. That’s how we read weather maps: Clockwise winds around high-pressure over Europe, North-America, and Asia to the north of the equator, counter-clockwise winds around low-pressure systems. If I apply this spin-law to Baffin Bay containing all the icebergs and ice islands, the spin rule states that these large and deep pieces flow along lines where the earth’s local rate of rotation, lets call it planetary spin f, divided by the local water depth, lets call it H, is a constant. So, to a first approximation, the icebergs and ice islands flow along a path where f/H is constant. If the planetary spin is constant, then the ice island follow lines of constant water depth H. There is more to the story, much more, such as the effects of waters of different densities residing next to each other, but I better continue this later, as I got a dinner date with a sweetheart and “Thermal Wind” can wait 😉

Physics and Engineering of Breaking Dams, Glaciers, and Tides

The title “Bombing Hitler’s Dams” fascinated me when I saw it featured on my TiVo last night. The story told was that of a group led by a smart, creative, and somewhat crazy Cambridge University engineer Dr. Hugh Hunt trying to recreate all the engineering elements needed to blow up a dam with a bomb that skips along the surface of the water the same way that a flat stone skips over a calm pond. While we all know intuitively how to throw a flat stone at the right speed at the correct angle, imagine to do it from an aircraft dropping a bomb to skip a few hundred yards over the surface of a reservoir, kiss the dam, sink, then blow it up via a depth charge. After many elaborate tests starting with 3 foot baby’s pool 5 inches deep, the show concluded with the real blowing up of real dam in northern Canada by a much enlarged group of engineers, construction workers, students, pilots, contractors, etc.

Photograph of the breached Möhne Dam taken by Flying Officer Jerry Fray of No. 542 Squadron from his Spitfire PR IX, six Barrage balloons are above the dam

If you think this is hard to do, it is. On May 16/17, 1943 a British bombing raid called “Operation Chastise” deployed cylindrical drums filled with explosives like skipping stones to hop over torpedo nets meant to protect the dams from subsurface mines. Two of three targeted dams were blown up, 53 airmen perished, German heavy industry in the Rhine-Ruhr valley was disrupted for 4 months, and over 1500 civilians drowned in the flood wave created by the breaking dams:

The story reminds my of my adviser, Dr. Richard Garvine (an aeronautical engineer by training) whom I met in 1986 while a physics student from Germany studying physical oceanography for a year in Bangor, Wales. Rather than returning to Germany, I went to the United States for graduate school where I met my sweetheart. One of my first graduate assignment was to study the “breaking dam” problem (Stoker, 1948: “The Formation of Breakers and Bores”, Communications of Pure and Applied Mathematics, 1, 1-87). The “breaking dam” problem is now a classical problem in fluid dynamics that relates to breaking waves, tsunamis, tides, as well as the discharge of fresh water from cooling plants, estuaries, and glaciers. I applied it to tides in the Conway Estuary in North-Wales for my MS thesis that the Swedish Royal Society saw fit to publish as my first contribution to science.

Conwy Estuary at its mouth near high tide.

I stole the above photo of the Conway Estuary, North Wales from a set of beautiful travelogues of an area where I camped for 6 weeks to guard instruments that measured currents along the 50 km tidal reach of this beautiful estuary. The tides rush in like the waves of a breaking dam, yet, they do not break (no bore forms, why?). To model the physics, I needed to study the work done by American, British, and French engineers who labored hard to defeat Nazi Germany by blowing up actual dams developing new and applying old ideas in physics and engineering along the way. Studying their work, I got my answer, too.

Addendum: A review of the aftermath and devastation of the 1943 flood wave from a German perspective is posted here with original photos from both British and German sources.