If shots of whiskey make you dizzy, shots of laser stun. NASA stunned me this week, when I discovered that they provide millions such shots of Greenland from which to construct detailed images of the landscape. The shots are free, no age-limit. This is better than the usual remote sensing or photography of “just” brightness. The laser gives us height, and not just the perception of it by shadows and fake angles of illumination, but hard and direct measurements of, well, height above sea level. Have a look at several million such shots of Petermann Gletscher taken in 2010 before the glacier broke to Manhattan-sized pieces:

Petermann Glacier surface elevation from laser shots on Mar.-24, 2010 at the site where the Manhattan-sized ice island formed Aug.-6, 2010. The background shows the same scene at the same time at 250-m resolution from MODIS (see below). Colors along the 350-m wide laser track line show height above sea level in meters.

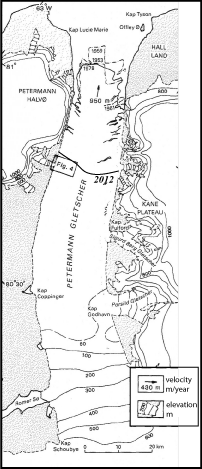
Petermann Glacier on March 24, 2010 as seen from MODIS satellite at 250-m resolution with two flight tracks along which laser data are collected. The black box shows the site of the figure above. The color figure on the right shows the slope or gradients of the data shown on left. It emphasizes regions where brightness changes fast. Multivariate calculus is useful!
We see two tracks: the one on right (east) has the ice stick more than 20-m above sea level (yellow colors) while about a mile to left (west) the ice’s surface elevation is only 10-m above sea level (light blue). Since the ice is floating and densities of ice and water are known, we can invert this height into an ice thickness. Independent radar measurements from the same track prove that this “hydrostatic” force balance holds, the glacier is indeed floating, so, multiply surface elevation by 10 and you got a good estimate of ice thickness. The dark blue colors of thin ice show meandering rivers and streams, ponds and undulations, as well as a rift or hairline fracture from east to west. This rift is visible both in the right and left track, it is the line along which the glacier will break to form the 2010 ice island. All ice towards the top of this rift has long left the glacier and some of it has hit Newfoundland as seen from the International Space Station by astronaut Ron Garan:

Last remnant of Petermann Ice Island 2010-A as seen from the International Space Station on Aug.-29, 2011 when it was about 3.5 km wide and 3 km long [Photo credit: Ron Garan, NASA]
Both are images of Petermann ice. The photo measures the brightness that hits the lens, but the laser measures both brightness and ice thickness. The laser acts like flash photography: When it is dark, we use a flash to provide the light to make the object “bright.” Now imagine that your camera also measures the time between the flash leaving your camera and brightness from a reflecting object to return it. What you think happens at an instant actually takes time as light travels fast, but not infinitely fast. So you need a very exact clock to measure the distance from your camera to the object. Replace the flash of the camera with a laser, replace the lens of your camera with a light detector and a timer, place the device on a plane, and you got yourself an airborne topographic altimeter. So, what use is there for this besides making pretty and geeky pictures?
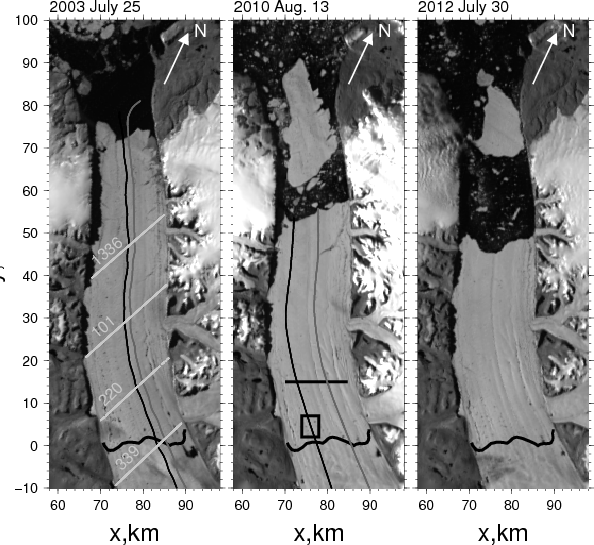
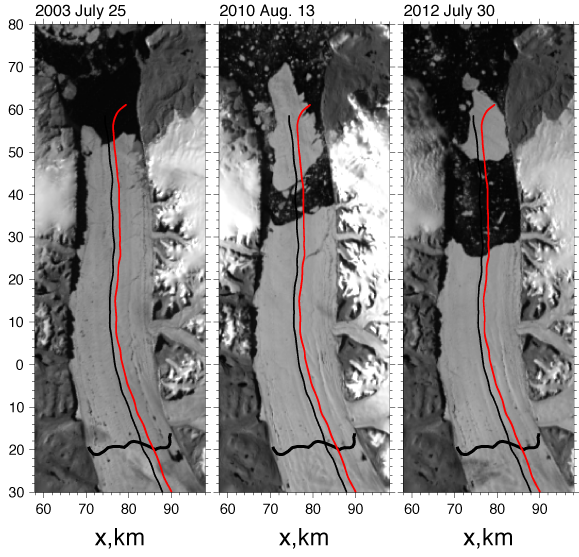
The laser documents some of the change in “climate change.” Greenland’s glaciers and ice-sheets are retreating and shrinking. Measuring the surface and bottom of the ice over Greenland with lasers and radars gives ice thickness. The survey lines above were flown in 2002, 2003, 2007, 2010, and 2011. These data are a direct and accurate measure on how much ice is lost or gained at Petermann Gletscher and what is causing it. My bet is on the oceans which in Nares Strait and Petermann Fjord have increased the last 10 years to melt the floating glacier from below.
There is more, but Mia Zapata of the Gits sings hard of “Another Shot of Whiskey.” What a voice …

Johnson, H., Münchow, A., Falkner, K., & Melling, H. (2011). Ocean circulation and properties in Petermann Fjord, Greenland Journal of Geophysical Research, 116 (C1) DOI: 10.1029/2010JC006519
Krabill, W., Abdalati, W., Frederick, E., Manizade, S., Martin, C., Sonntag, J., Swift, R., Thomas, R., & Yungel, J. (2002). Aircraft laser altimetry measurement of elevation changes of the greenland ice sheet: technique and accuracy assessment Journal of Geodynamics, 34 (3-4), 357-376 DOI: 10.1016/S0264-3707(02)00040-6
Münchow, A., Falkner, K., Melling, H., Rabe, B., & Johnson, H. (2011). Ocean Warming of Nares Strait Bottom Waters off Northwest Greenland, 2003–2009 Oceanography, 24 (3), 114-123 DOI: 10.5670/oceanog.2011.62
Thomas, R., Frederick, E., Krabill, W., Manizade, S., & Martin, C. (2009). Recent changes on Greenland outlet glaciers Journal of Glaciology, 55 (189), 147-162 DOI: 10.3189/002214309788608958

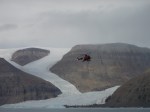
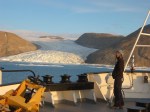
![North-eastern section of Petermann Glacier on Aug.-11, 2012, the meandering river is the centerline, view is almost due east. [Photo Credit: Canadian Coast Guard Ship Henry Larsen.]](https://icyseas.org/wp-content/uploads/2012/08/petermannglacier_cghl-360_20.jpg)
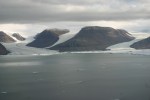
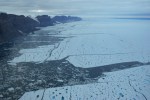
![Seaward front of Petermann Glacier Aug.-11, 2012. View is from a small side-glacier towards the south-east across Petermann Fjord with Petermann Gletscher to the left (east). [Photo Credit: Erin Clarke, Canadian Coast Guard Ship Henry Larsen]](https://icyseas.org/wp-content/uploads/2012/11/p1080580.jpg)
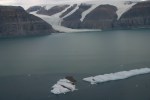

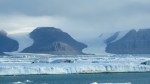

![Northern Kennedy Channel near the entrance to Petermann Fjord with Kap Morton in cloud banks. [Credit: Andreas Muenchow]](https://icyseas.org/wp-content/uploads/2013/05/img_0032.jpg)


![The merging of Sigurd Berg and Hubert Glaciers which discharge into Petermann Gletscher on its eastern wall. The view is landward towards the north-east as the helicopter flies in from Petermann. [Credit: Barbara O'Connell, Canadian Coast Guard]](https://icyseas.org/wp-content/uploads/2013/05/img_4690.jpg)
![Petermann Gletscher and Fjord in Aug.-2012. View is to the north-west with Faith Glacier (top left) and Kap Lucie Marie (top right) showing the western wall of Petermann. [Photo Credit: CCGS Henry Larsen]](https://icyseas.org/wp-content/uploads/2013/05/peterman-040.jpg)
![Looking down Belgrave Glacier discharging into Petermann Gletscher at its terminus in Aug. 2012 [Credit: CCGS Henry Larsen]](https://icyseas.org/wp-content/uploads/2013/05/peterman-050.jpg)
![RadarSat imagery of eastern Baffin Island (bottom, right), western Greenland (top, right), and Nares Strait with Petermann Fjord (top, left) with pieces of Petermann and Ryder Ice Islands identified. [Credit: Luc Lesjardins, Canadian Ice Service]](https://icyseas.org/wp-content/uploads/2013/01/ice-island-overview-25-27-jan-2013.jpg)


